97. The Rise and Fall of U.S. Inflation#
97.1. Overview#
1993 Prospects for Bounded Rationality in Macroeconomics closed the Bounded Rationality suite by handing on a government that keeps re-estimating its Phillips curve: the policy maker of Sims and Chung, grown up.
This lecture opens a suite that asks that government to explain the history of U.S. inflation.
The suite is based on Thomas Sargent’s The Conquest of American Inflation [Sargent, 1999], and this first lecture combines chapters 1 and 2 of that book, with a preview of its concluding chapter.
Readers arriving from the Bounded Rationality suite have already met a condensed version of the model.
A government learning the Phillips curve studies a constant-gain government with the calibration of the static model in Escaping Nash Inflation, One recursion, many learners sets out the stochastic-approximation and E-stability tools that we use to analyze such governments, and The econometricians did return the compliment tells how econometricians came to estimate them.
The suite asks a question about post-war U.S. macroeconomic history:
If we take for granted that inflation is under the control of the Federal Reserve, how can we explain the rise of U.S. inflation into the 1970s and its abrupt fall under Paul Volcker in the early 1980s?
The essay evaluates two interpretations, both based on policy makers’ beliefs about the Phillips curve.
In both stories, the Federal Reserve learns the natural-rate-of-unemployment theory from a combination of experience and a priori reasoning.
The stories differ in how that theory is cast:
The triumph of natural-rate theory. Academic economists discovered the natural-rate hypothesis, taught that any inflation-unemployment tradeoff is temporary, and eventually persuaded policy makers to pursue low inflation.
The vindication of econometric policy evaluation. Policy makers never abandoned the methods that Robert Lucas criticized in his famous Critique.
Recurrently re-estimating a Phillips curve and using it to choose a target, they were led toward lower inflation by the data itself, an adversely shifting empirical Phillips curve.
This lecture presents the facts that motivate both stories, sketches the two interpretations, and reviews the Lucas Critique that chapter 2 both invokes and modifies.
It then previews, in The road ahead, how the remaining twelve lectures build the models, and closes by carrying the book’s data through to the present.
Let’s start with some imports:
import matplotlib.pyplot as plt
import numpy as np
import pandas as pd
from statsmodels.tsa.filters.bk_filter import bkfilter
Note
The figures in the next two sections reproduce the ones in chapter 1 of Sargent [1999], which were drawn from data available in the late 1990s.
We download the underlying series directly from FRED and restrict attention to the same historical window.
The section Data patterns after 1999 then carries the most enlightening of these figures through to the present and asks what the additional quarter-century of data means for the two stories.
97.2. Facts#
We begin with the single fact that the whole essay seeks to explain: the hump-shaped path of U.S. inflation since World War II.
For a much longer view of price levels, reaching back centuries and across countries, see Price Level Histories.
We measure inflation as the book does, by the annualized monthly change in the consumer price index (all items, not seasonally adjusted), smoothed with a 13-month centered moving average to remove seasonal and high-frequency noise.
The function below reads a series straight from FRED; we use it for the price index and for the unemployment rate that we need in the next section.
def fred_series(series_id):
    "Download a monthly series from FRED as a pandas Series."
    url = f'https://fred.stlouisfed.org/graph/fredgraph.csv?id={series_id}'
    frame = pd.read_csv(url, index_col=0, parse_dates=True, na_values='.')
    return frame.iloc[:, 0].rename(series_id)

cpi_all = fred_series('CPIAUCNS')      # CPI, all items, not seasonally adjusted
u_all = fred_series('LNS14000028')     # unemployment rate, white men 20 and over

book_window = slice('1948', '1999-01')
cpi = cpi_all[book_window]

# annualized monthly inflation, then a 13-month centered moving average
inflation = 1200 * np.log(cpi).diff()
inflation_ma = inflation.rolling(13, center=True).mean()
Figure 1.1 plots the smoothed series over the book’s window.
fig, ax = plt.subplots(figsize=(9, 5))
ax.plot(inflation_ma, lw=1.2)
ax.axhline(0, color='k', lw=0.5)
ax.set_xlabel('year')
ax.set_ylabel('inflation (percent, annualized)')
ax.set_title('Figure 1.1: Monthly inflation, CPI all items, '
             '13-month centered moving average')
plt.show()
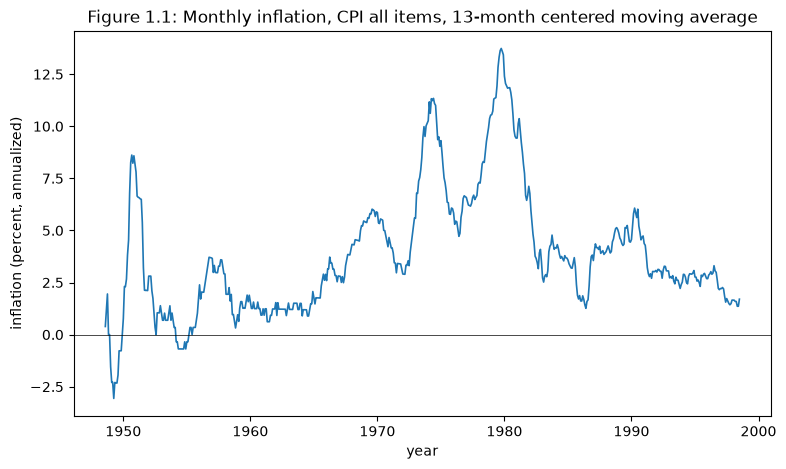
Fig. 97.1 Monthly CPI inflation, 13-month centered moving average, 1948-1999#
Inflation was low during the late 1950s and early 1960s, swept upward into the 1970s, and then fell abruptly with Volcker’s stabilization in the early 1980s.
Any explanation that treats inflation as under the Federal Reserve’s control must account for this rise and fall.
97.3. The Phillips curve in the data#
Despite its disrepute in some academic and policy-making circles, the Phillips curve persists in U.S. data, and simple procedures detect it.
To coax the Phillips curve from the data, we follow the book in two ways.
First, we use the unemployment rate for a single demographic group — white men 20 years and over — rather than the aggregate rate, which is contaminated by slow-moving shifts in the demographic mix.
Second, we look at business-cycle frequencies, filtering out slowly moving components so that the eye can spot the inverse relationship between inflation and unemployment.
The unemployment series begins in January 1954, so the joint sample does too.
u = u_all[book_window]

data = pd.concat([inflation.rename('inflation'),
                  u.rename('unemployment')], axis=1).dropna()
data.head()
| inflation | unemployment | |
|---|---|---|
| observation_date | ||
| 1954-01-01 | 0.000000 | 3.6 |
| 1954-02-01 | 0.000000 | 3.8 |
| 1954-03-01 | 0.000000 | 4.1 |
| 1954-04-01 | -4.469279 | 4.7 |
| 1954-05-01 | 4.469279 | 4.6 |
Figure 1.2 plots the two series together, with inflation smoothed as in Figure 1.1.
fig, ax = plt.subplots(figsize=(9, 5))
ax.plot(inflation_ma[data.index[0]:], 'C0', lw=1,
        label='inflation (CPI, 13-month centered moving average)')
ax.plot(u, 'C1:', lw=1.2, label='unemployment (white men 20+)')
ax.axhline(0, color='k', lw=0.5)
ax.set_xlabel('year')
ax.set_ylabel('percent')
ax.set_title('Figure 1.2: Monthly unemployment and inflation rates')
ax.legend()
plt.show()
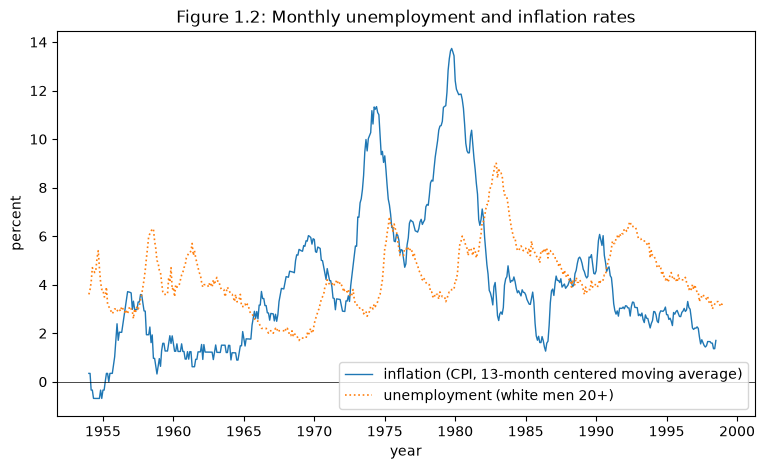
Fig. 97.2 Monthly unemployment (white men 20+) and inflation (13-month centered moving average)#
To isolate the business-cycle relationship, we apply the finite-lag bandpass filter of Baxter and King [Baxter and King, 1999] to the monthly series.
Following the book, we keep fluctuations with periods between 24 and 84 months and use a lead-lag truncation of 84 months.
Because the filter needs 84 months of data on each side of a date, it drops the first and last seven years of the sample, so the filtered series begin in 1961.
# Baxter-King bandpass: periods between 24 and 84 months, truncation 84
bk = bkfilter(data, low=24, high=84, K=84)
bk.columns = ['inflation_cycle', 'unemployment_cycle']
print(f"filtered sample: {bk.index[0]:%Y-%m} to {bk.index[-1]:%Y-%m}")
filtered sample: 1961-01 to 1992-01
Figure 1.3 plots the filtered components.
fig, ax = plt.subplots(figsize=(9, 5))
ax.plot(bk.index, bk['inflation_cycle'], 'C0', lw=1, label='inflation')
ax.plot(bk.index, bk['unemployment_cycle'], 'C1:', lw=1.2,
        label='unemployment')
ax.axhline(0, color='k', lw=0.5)
ax.set_xlabel('year')
ax.set_ylabel('deviation from trend (percent)')
ax.set_title('Figure 1.3: Business-cycle components '
             '(Baxter-King bandpass filter)')
ax.legend()
plt.show()
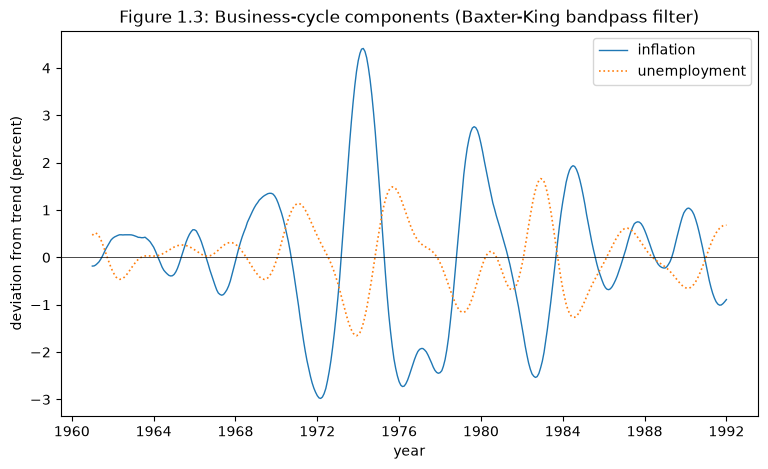
Fig. 97.3 Business-cycle components of inflation and unemployment, Baxter-King bandpass filter#
The filtered components tend to move in opposite directions: a business-cycle Phillips curve.
We can see the tradeoff more directly in scatter plots for the subperiod that interests us most, 1960-1982.
As in the book, Figure 1.4 plots smoothed inflation against unemployment and Figure 1.5 plots the business-cycle components, with unemployment on the horizontal axis in both.
In Figure 1.5 a faint line joins successive months.
sub = slice('1960', '1982')
cycle_sub = bk.loc[sub]

fig, axes = plt.subplots(1, 2, figsize=(12, 5))

axes[0].scatter(u[sub], inflation_ma[sub], s=8, alpha=0.6)
axes[0].set_xlabel('unemployment (white men 20+)')
axes[0].set_ylabel('inflation (13-month centered moving average)')
axes[0].set_title('Figure 1.4: Smoothed series, 1960-1982')

axes[1].plot(cycle_sub['unemployment_cycle'], cycle_sub['inflation_cycle'],
             lw=0.5, alpha=0.4)
axes[1].scatter(cycle_sub['unemployment_cycle'],
                cycle_sub['inflation_cycle'], s=8, alpha=0.6)
axes[1].set_xlabel('unemployment (business-cycle component)')
axes[1].set_ylabel('inflation (business-cycle component)')
axes[1].set_title('Figure 1.5: Business-cycle components, '
                  f'{cycle_sub.index[0].year}-{cycle_sub.index[-1].year}')

plt.tight_layout()
plt.show()
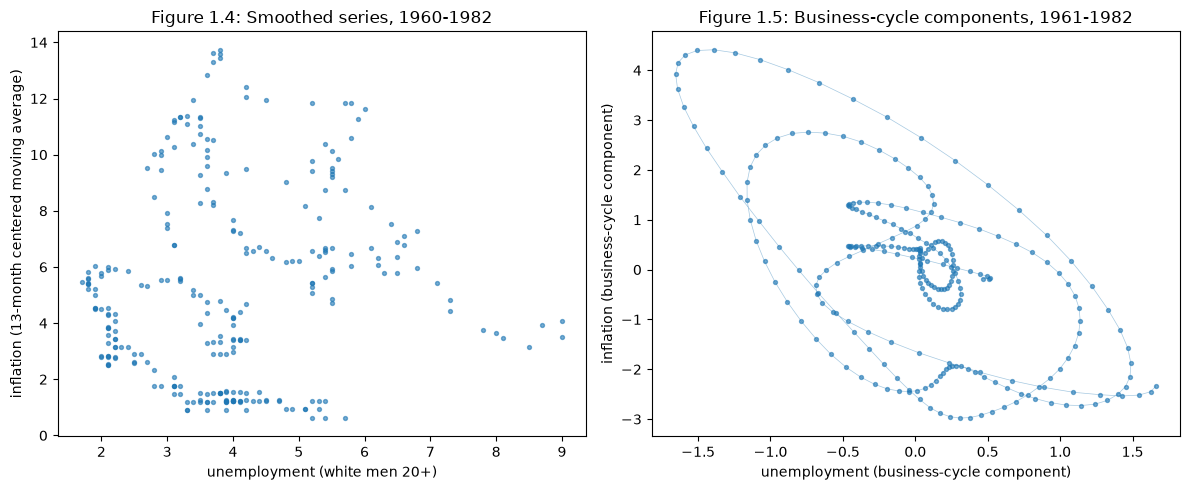
Fig. 97.4 Inflation against unemployment, 1960-1982: smoothed series and business-cycle components#
Focusing on the business-cycle components sharpens the apparent Phillips curve.
Figure 1.5 reveals Phillips loops: followed month by month, the business-cycle components trace out clockwise loops rather than a single stable curve.
Clockwise loops mean that inflation lags unemployment.
As unemployment falls, inflation is slow to rise, so the path runs leftward along the bottom of a loop; as unemployment rises again, inflation is slow to fall, so the path runs rightward along the top.
At these frequencies the negative correlation between inflation and unemployment is strongest when inflation is paired with unemployment about six months earlier (Exercise 97.1 asks you to verify this).
Slowly adjusting expectations of inflation, which the natural-rate theory places at the center of the story, are one possible source of that lag.
Note
The book adjusts for demographic change by choosing a single unemployment series, and in chapter 9 it uses these same data to estimate an adaptive model of policy making (Econometric Policy Evaluation).
A broader definition of unemployment would inject additional low-frequency demographic components, which one might model with a unit-root process.
The essay instead puts a unit root into the inflation-unemployment process from a different source: the drifting beliefs of a monetary authority cut loose from the discipline of Bretton Woods.
97.4. Two interpretations#
Both stories start from the same initial conditions — the history of inflation and unemployment, and the state of expectations, inherited by policy makers around 1960 — and both assume that the data conform to the natural-rate hypothesis, whether or not policy makers realized it.
97.4.1. The triumph of natural-rate theory#
Adherence to the gold standard and then to Bretton Woods gave the U.S. low inflation and low expected inflation.
In 1960, Paul Samuelson and Robert Solow [Samuelson and Solow, 1960] found a Phillips curve in U.S. data and taught that it was exploitable — that policy could raise inflation to reduce unemployment.
That is the lesson of their page 192; on page 193 they themselves warned that “it would be wrong, though, to think that our Figure 2 menu that relates obtainable price and unemployment behavior will maintain its same shape in the longer run.”
Within a decade the recommendation was widely endorsed and implemented.
To everyone’s dismay, the Phillips curve then shifted adversely: inflation rose, but unemployment on average did not fall.
Meanwhile Edmund Phelps [Phelps, 1967], Milton Friedman [Friedman, 1968], and Robert Lucas [Lucas, 1972] created and refined the concept of the natural rate of unemployment, which assigns a central role to expectations of inflation in locating the Phillips curve.
The natural-rate theory allowed only a temporary tradeoff and explained the adverse shifts; its rational expectations version implied that policy makers should ignore the temporary tradeoff and strive only for low inflation.
In this story, these ideas diffused from academics to policy makers and ultimately produced the lower inflation of the 1980s and 1990s.
Events were shaped by policy makers’ beliefs — some false, others true — and the actions those beliefs inspired.
Lucas [Lucas, 1976] then used Samuelson and Solow’s method of deducing policy from a statistical Phillips curve as an example of erroneous methodology.
His reasoning soon banished the method from academic research centers, but, as the book puts it, “the method survived and prospered within the Federal Reserve System” — a fact that inspires the second story.
97.4.2. The vindication of econometric policy evaluation#
The alternative story ascribes Volcker’s conquest partly to the success of the very econometric and policy-making procedures that Lucas challenged.
It had been told before, by Christopher Sims [Sims, 1988] and Heetaik Chung [Chung, 1990].
Policy makers accepted the Samuelson-Solow Phillips curve as an exploitable tradeoff and adopted their methods for learning from data and deducing policy.
Recurrently, they re-estimated a distributed-lag Phillips curve and used it to reset a target inflation-unemployment pair.
Interpreted mechanically — without identifying expectations as the hidden state variable — the adversely shifting empirical Phillips curve eventually led policy makers to pursue lower inflation.
This story is told with an adaptive theory of policy that departs minimally from rational expectations.
It connects a sequence of ideas that the rest of the suite develops: drifting coefficients, self-confirming equilibria, least squares and other recursive learning algorithms, convergence of least squares learners to self-confirming equilibria, and recurrent dynamics along escape routes from those equilibria.
The key idea, taken from Sims [1988], is that an adaptive model lets a government learn from its past attempts to exploit the Phillips curve, and eventually discover a version of the natural-rate hypothesis that instructs it to reduce inflation.
To Sims’s insight the book adds an account of how the escape-route dynamics of the adaptive system can spontaneously generate regime shifts.
In this story inflation policy is not made in a vacuum or delivered as a natural experiment; it emerges gradually from an adaptive process.
Although it backs away slightly from rational expectations, the vindication story imposes more restrictions on government policy than the triumph story, which occasionally shifts free parameters describing government behavior to fit the facts.
97.5. Ignoring the Lucas Critique#
Chapter 2 of the book confronts the obvious objection to the vindication story: doesn’t the Lucas Critique forbid the mechanical, exploitable Phillips curve on which it rests?
The essay resurrects the econometric and policy-evaluation procedures that Lucas decisively criticized [Lucas, 1976], and emphasizes a neglected aspect of his Critique: drifting coefficients.
97.5.1. The Critique#
An econometric model is a collection of stochastic difference equations, some of which describe private agents’ decision rules.
Econometric policy evaluation in the Tinbergen-Theil tradition holds those private decision rules fixed while the government optimizes its own rule against an objective function.
Lucas noted that if private agents solve intertemporal optimization problems, their decision rules depend on the government’s rule.
By missing this dependence, the Tinbergen-Theil method mistranslates the government’s preferences over outcomes into an ordering over decision rules, and so gives unreliable policy advice.
A rational expectations equilibrium builds the dependence in, by requiring the law of motion that private agents perceive to coincide with the actual law of motion that their own decisions help generate (Rational Expectations Equilibrium).
Least Squares Learning in Self-Referential Models shows how agents who estimate their perceived law of motion by least squares can find such a fixed point, and the self-confirming equilibria below are fixed points of the same kind.
97.5.2. The appeal to drifting coefficients#
Lucas conceded the impressive forecasting record of Keynesian models but argued that good forecasting is no evidence for the invariance under intervention that Tinbergen-Theil assumes.
He stressed that forecasters routinely adjusted the constant terms of key equations, and interpreted these adjustments as an adaptive-coefficients model in the spirit of Cooley and Prescott [Cooley and Prescott, 1973].
The intertemporal instability of estimated relationships — coefficient drift, presumably present even under stable operating rules for policy — undermined treating them as invariant to systematic changes in policy rules.
But Lucas did not read the drift as confirming his theoretical point that private decision rules vary with the government’s rule.
His three examples compare stationary environments indexed by different government rules, and they are silent about drifting coefficients; the book recalls that many early readers misunderstood his reference to drifting coefficients as supporting his basic point.
Lucas left the drift unexplained, and neither the macroeconomic theory nor the rational expectations econometrics built after the Critique accounts for it: both focus on environments with time-invariant transition functions.
97.5.3. Parameter drift as a point of departure#
The essay starts from parameter drift, treating it as a smoking gun — the key evidence that the government’s beliefs about the economy, and hence its policy toward inflation, have evolved over time.
It builds a model from two components:
a Tinbergen-Theil theory of government decision making — the Phelps problem of Adaptive Expectations and the Phelps Problem; and
a drifting-coefficients econometric procedure for the government, featuring the constant adjustments that Lucas wrote about.
It disciplines the exercise by assuming that a rational expectations version of the natural-rate hypothesis is true, and it sets other explanations aside: “I do not examine unusual supply shocks and other plausible explanations of post-World War II U.S. inflation.”
If the fundamentals of the environment are time-invariant, the forces behind consistency proofs in econometrics make the government’s estimates and its decision rule converge [Marcet and Sargent, 1989].
In the limit there can emerge a self-confirming equilibrium (Self-Confirming Equilibria), in which the government’s estimates are reinforced jointly by its own behavior and the private sector’s reactions to it.
Within a self-confirming equilibrium, some of the force of the Lucas Critique vanishes.
Although the government’s invariance assumption is wrong, it is not disappointed in outcomes, because those outcomes are statistically consistent with its beliefs.
A self-confirming equilibrium also restricts the government’s model and its behavior: because the government’s rule is derived from its fitted model, the free parameters that described government policy in Lucas’s models disappear.
So a self-confirming equilibrium is a rational expectations equilibrium with fewer free parameters than the models of Lucas [1972] and Lucas [1976], and the lost parameters are exactly the ones we would shift to represent a regime change.
Sims [1982] implicitly appealed to a self-confirming equilibrium when he argued that regime changes are rare because existing policies are approximately optimal.
To admit regime changes and drifting coefficients, convergence to a self-confirming equilibrium must be resisted.
The essay arrests convergence by replacing the government’s least squares estimator with a constant-gain, adaptive-coefficients algorithm like Cooley and Prescott’s, which overweights recent data — endowing the government with a suspicion that the environment is unstable.
This weakens the pull toward a self-confirming equilibrium and sustains dynamics along an escape route, along which regime changes occur.
Ironically, as we shall see in Adaptive Learning and Escape Dynamics, the procedures that violate the Lucas Critique can yield better outcomes than ones that respect it.
97.6. A premature summary: triumph or vindication?#
The rest of this suite builds models.
Before we start, it is worth previewing where they lead and the tension they leave unresolved — a premature summary of the journey, adapted from the concluding chapter of Sargent [1999].
Everything can be organized around two benchmark models.
In the first, due to Phelps [1967], the public forms expectations adaptively while the government chooses policy optimally, taking the public’s rule as given.
In the second, the rational-expectations natural-rate model, the public is rational while the government’s policy is treated as exogenous and arbitrary.
Lucas recommended replacing the first benchmark with the second.
Coming to grips with the two stories drives us to propose models that make various compromises between these poles — and the remaining lectures are those compromises.
97.6.1. The road ahead#
We begin by imposing rationality on both sides.
The Credibility Problem (chapter 3) studies the one-period model of Kydland and Prescott [1977], whose time-consistent (Nash) outcome is a pessimistic prediction: high inflation, with nothing gained for it.
Credible Government Policies (chapter 4) repeats that economy forever. Computing the whole set of sustainable values with the recursive methods of Abreu et al. [1990], it finds so many outcomes sustainable that the theory replaces pessimism with agnosticism.
That agnosticism is the first reason to hesitate before declaring the triumph of natural-rate theory.
Following Sims and Chung, we then turn back from the Lucas Critique and start again from the Phelps benchmark.
Adaptive Expectations and the Phelps Problem (chapter 5) solves the Phelps problem against an arbitrary adaptive-expectations Phillips curve and shows why the induction hypothesis matters.
Next we make one change: the government’s model of the private sector is no longer arbitrary — it is fit to historical data.
Varying the details of that fitting problem generates the next five lectures.
Optimal Misspecified Beliefs (chapter 6) introduces equilibria with optimal but misspecified forecasting functions, in Bray’s market.
Self-Confirming Equilibria (chapter 7) requires the government’s Phillips curve to be self-confirming, and finds that self-confirming equilibria reproduce the Nash outcome or something worse, before closing with an equilibrium in which a subtly misspecified public forecast does better than Nash.
Adaptive Learning and Escape Dynamics (chapter 8) makes the government a real-time econometrician, an “anticipated-utility” learner in the sense of Kreps [1998], and finds spontaneous, Volcker-like stabilizations when the gain is constant.
Escaping Nash Inflation characterizes those escapes analytically, following Cho et al. [2002].
Priors, Escapes, and Learning Cycles follows Sargent and Williams [2005] in showing how the government’s prior about drifting coefficients shapes convergence, cycles, and escapes.
The next three lectures take the models to data.
Econometric Policy Evaluation (chapter 9) estimates the adaptive model on U.S. data by maximum likelihood, following Chung, and asks whether the estimates vindicate econometric policy evaluation.
Drifts and Volatilities follows Cogley and Sargent [2005] in fitting a vector autoregression with drifting coefficients and stochastic volatility to data through 2000, and asks whether the Great Inflation was bad policy or bad luck.
Drifts and Volatilities after 2000 brings that model up to date with the data since 2000.
Finally, The Lost Conquest: Fed Policy in the 2020s follows Sargent and Williams [2025] in turning the suite’s tools, including an anticipated-utility Federal Reserve, on the inflation of the 2020s and the Federal Reserve’s slow response to it, and so returns to the question with which this lecture’s survey of the data ends: was the conquest lost?
Symbols change from lecture to lecture, because each lecture follows its source; A note on notation records the translations and the gain each lecture uses.
The adaptive models are a disciplined retreat from rational expectations, not an abandonment of it.
Apart from a single gain parameter, they carry no free parameters governing expectations, and period by period they impose the same cross-equation restrictions as a rational expectations model.
And because a self-confirming equilibrium is the attractor of their mean dynamics, under tranquil conditions, with a gain that eventually falls like \(1/t\), they converge back to it, and hence, on the equilibrium path, to rational expectations, satisfying a desideratum of Kreps [1998].
That convergence holds for least squares; Priors, Escapes, and Learning Cycles exhibits other priors under which the self-confirming equilibrium is unstable.
But to match the data, our main interest, like Sims’s, is in the dynamics that adaptation adds.
Those dynamics come in two kinds.
Sims [1988] and Chung [1990] gave their governments Kalman filters on drifting coefficients, whose gains do not vanish; Sims’s government fit a static Phillips curve and Chung’s a distributed lag.
In their simulations the government escapes from the Nash outcome once and then stays near the Ramsey outcome, apparently indefinitely.
The governments of Sargent [1999] and Cho et al. [2002] instead use constant-gain recursive least squares, and their escapes recur: each is followed by a return toward Nash, producing the sawtooth of A government learning the Phillips curve.
Why the two kinds of history differ was a puzzle until Sargent and Williams [2005] traced it to the government’s prior: the drift covariance and the noise variance that its filter assumes.
Priors, Escapes, and Learning Cycles works through their account.
The learning governments of Adaptive Learning and Escape Dynamics and Escaping Nash Inflation are Sargent’s: suspecting that the Phillips curve is prone to wander, they use a constant-gain algorithm, the sensible choice when coefficients drift.
The payoff is a striking one: the adaptive models produce abrupt stabilizations of inflation that defy the inferior self-confirming outcome toward which the mean dynamics point.
These regime shifts arise not from any change in the government’s procedures, nor from large shocks, but from changes in beliefs created by the government’s own econometrics — the mathematics of escape routes in the space of approximating models.
97.6.2. The induction hypothesis: villain and hero#
At the center of the story sits the induction hypothesis — the restriction that the weights on lagged inflation in an expectations equation sum to one, so that a permanently higher inflation rate is eventually fully expected.
It was built almost without comment into the adaptive expectations hypothesis of Friedman [1957] and Cagan [1956], and it was the basis of Solow’s and Tobin’s early tests of the natural-rate hypothesis [Solow, 1968, Tobin, 1968].
Cast as a villain in Lucas’s Critique — a naive restriction that rational expectations does not imply — the induction hypothesis re-emerges as the hero of the adaptive models: activating it is exactly what makes the government’s Phelps problem call for near-Ramsey, low-inflation policy.
In the distributed-lag model of Adaptive Learning and Escape Dynamics, the escape routes are precisely the paths along which the government’s estimated model, by using a unit root to approximate a constant, stumbles into believing the induction hypothesis.
Wrestling with such approximation problems, with several models simultaneously in play, is what led Sims [1980] to call bounded rationality a wilderness, set apart from the tidy one-model world of rational expectations.
97.6.3. The reservation#
Which story, then — triumph or vindication?
The contest is not rational expectations versus an alternative, because both stories selectively apply and withdraw from rational expectations.
And the vindication story, however well it fits, is an exercise in positive economics, not normative economics.
It is tempting to read its long stretches of near-Ramsey inflation as an endorsement of the adaptive policy-making procedures that produce them — but that temptation should be resisted.
For the same adaptive dynamics that permit a stabilization also make it temporary: once beliefs come close to the induction hypothesis, the mean dynamics point away from it, back toward the region where the Phelps problem recommends resuscitating inflation.
It can take a long time for the mean dynamics to push the system back to the self-confirming equilibrium, but it is bound to happen.
The simulations contain long episodes that look like Paul Volcker — and others that look like Arthur Burns.
Theoretical work after Kydland and Prescott [1977], such as Rogoff [1985], insists that durable low inflation must rest on commitment mechanisms that keep a monetary authority from choosing sequentially — not on the hope that an adaptive government, armed with an approximate model, will by chance eventually learn to do approximately the right thing.
So the book ends on a hope rather than a verdict: we hope that the triumph story is the right one — that policy makers have learned a correct rational expectations version of the natural-rate hypothesis and have found devices to commit themselves to low inflation.
Because if instead the vindication story is closer to the truth, then the mean dynamics that pull beliefs back toward the self-confirming equilibrium are always waiting, eventually, to carry inflation back up.
The quarter-century of data since 1999 — a long, quiet Great Moderation interrupted by a sudden surge in 2021-2022 — is a running test of exactly this hope, and we turn to it next.
97.7. Data patterns after 1999#
Sargent [1999] was written at the end of the long disinflation that began with Volcker.
We now have another quarter-century of data.
This section carries the book’s most enlightening figures through to the present and asks what the new observations mean for the two stories.
We use the full FRED series, through the latest month available, and first check each for months that are missing inside the sample.
def missing_months(series):
    "Months between the first and last observation that have no value."
    months = pd.date_range(series.first_valid_index(),
                           series.last_valid_index(), freq='MS')
    return months.difference(series.dropna().index)

for series in (cpi_all, u_all):
    gaps = [f'{m:%Y-%m}' for m in missing_months(series)]
    print(f"{series.name:12s} last observation "
          f"{series.last_valid_index():%Y-%m}, missing months: {gaps}")
CPIAUCNS     last observation 2026-09, missing months: ['2025-10']
LNS14000028  last observation 2026-09, missing months: ['2025-10']
The federal government shutdown of late 2025 left the October 2025 observations of both series uncollected.
One missing month would turn every 13-month moving average and every 12-month change that touches it into a missing value, silently cutting the smoothed series short.
We therefore fill isolated missing months by interpolation, geometric for the price index and linear for unemployment, and leave longer gaps alone.
def fill_isolated(series, log=False):
    "Interpolate single missing months; leave longer gaps missing."
    s = np.log(series) if log else series
    isolated = s.isna() & s.shift(1).notna() & s.shift(-1).notna()
    s = s.where(~isolated, s.interpolate(limit_area='inside'))
    return np.exp(s) if log else s

cpi_full = fill_isolated(cpi_all['1948':], log=True)
u_full = fill_isolated(u_all)
print("still missing:",
      [f'{m:%Y-%m}' for m in missing_months(cpi_full).union(missing_months(u_full))])

# the book's measure (annualized monthly change, 13-month centered MA)
inflation_full = 1200 * np.log(cpi_full).diff()
inflation_ma_full = inflation_full.rolling(13, center=True).mean()

# year-over-year inflation: smoother, and the measure usually quoted today
inflation_yoy = 100 * (cpi_full / cpi_full.shift(12) - 1)
print(f"13-month centered average available through "
      f"{inflation_ma_full.last_valid_index():%Y-%m}")
still missing: []
13-month centered average available through 2026-03
A centered 13-month average needs six months of data on each side of a date, so the smoothed series ends six months before the latest observation.
97.7.1. The rise and fall, extended#
Figure 1.1 showed inflation rising into the 1970s and falling under Volcker.
Extending it to the present adds three chapters the book could not see: the Great Moderation of low, stable inflation from the mid-1980s; a decade of low, below-target inflation after the 2008 financial crisis, dipping below zero in 2008-09 and briefly again in 2015; and a sudden surge in 2021-2022 to the highest rate since 1981, followed by a rapid decline.
fig, ax = plt.subplots(figsize=(11, 5))
ax.plot(inflation_ma_full, lw=1)
ax.axhline(0, color='k', lw=0.5)
ax.axvspan(pd.Timestamp('1948-01-01'), pd.Timestamp('1999-01-01'),
           color='C0', alpha=0.06, label="the book's window")
for date, y, txt in [('1951-01-01', 9.3, 'Korean\nWar'),
                     ('1970-01-01', 12.0, '1970s\nacceleration'),
                     ('1984-06-01', 0.5, 'Volcker'),
                     ('2009-07-01', -1.5, '2009\ndeflation scare'),
                     ('2022-06-01', 8.9, '2021-22\nsurge')]:
    ax.annotate(txt, (pd.Timestamp(date), y), ha='center', fontsize=9,
                color='C3')
ax.set_xlabel('year')
ax.set_ylabel('inflation (percent, annualized)')
ax.set_title('Inflation, CPI all items, 13-month centered moving average, '
             f'1948-{inflation_ma_full.last_valid_index().year}')
ax.legend(loc='upper right')
plt.show()
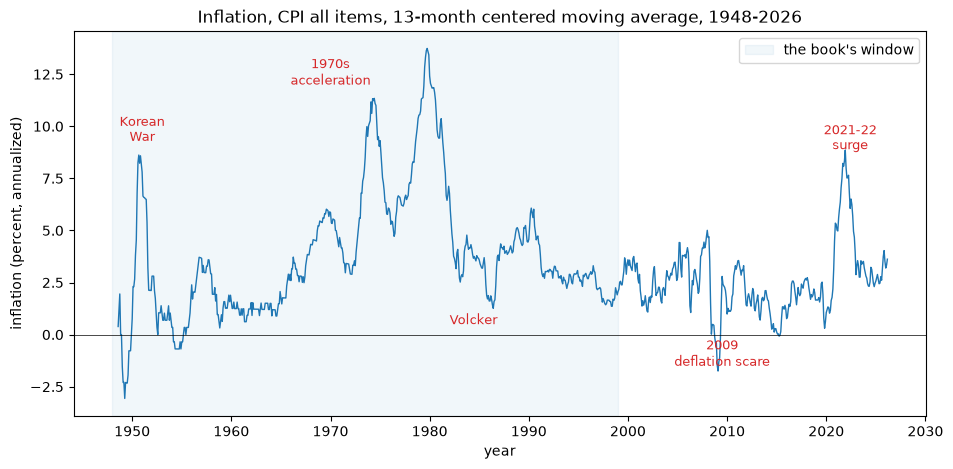
Fig. 97.5 Inflation extended to the present, with the book’s window shaded#
The hump that the book set out to explain is now one of two.
The second compressed a fast acceleration and an almost-as-fast disinflation into about three years.
Its closest precedent is not the 1970s but the Korean War spike of 1950-1951, inside the book’s own window: inflation jumped by about eight percentage points within a year and was back near 2 percent within another, with no drawn-out acceleration of the kind that preceded Volcker.
97.7.2. Unemployment and inflation to the present#
Figure 1.2 plotted the two series together for the post-war period.
Extending it shows the two most dramatic macroeconomic events of the new data: the COVID unemployment spike of 2020 — for white men 20 and over, the highest rate since the series began in 1954 — and the inflation surge that followed.
recent = slice('1990', None)

fig, ax = plt.subplots(figsize=(11, 5))
ax.plot(inflation_yoy[recent], 'C0', lw=1, label='inflation (CPI, year-over-year)')
ax.plot(u_full[recent], 'C1:', lw=1.2, label='unemployment (white men 20+)')
ax.axhline(0, color='k', lw=0.5)
ax.set_xlabel('year')
ax.set_ylabel('percent')
ax.legend()
plt.show()
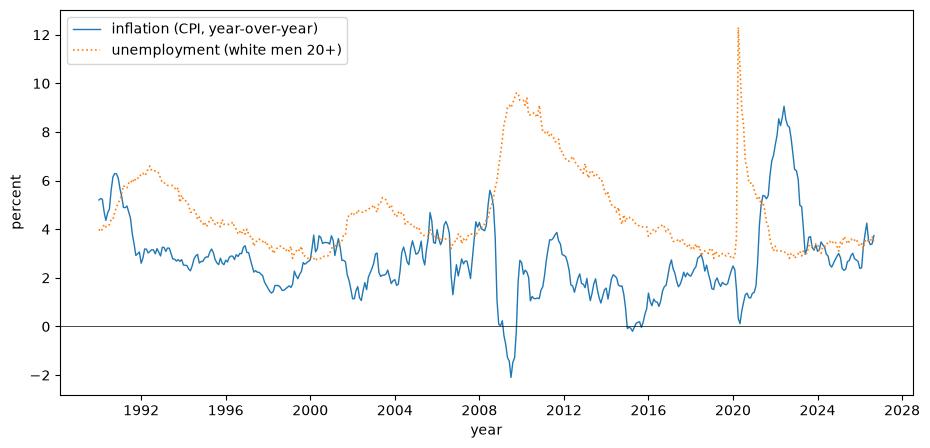
Fig. 97.6 Unemployment and inflation since 1990#
Two features stand out.
From the mid-1990s to 2020, inflation stayed remarkably quiet even as unemployment swung widely: it fell in 2000 and again in 2019 to levels last seen in the early 1970s, and roughly tripled in the 2008 recession.
Then, after the COVID spike, unemployment fell back quickly while inflation surged.
Falling unemployment with rising inflation is a move along a downward-sloping Phillips curve, the signature of a demand disturbance.
But by itself the pattern cannot separate a demand-driven move along a steep Phillips curve from supply disturbances, and the mix of the two is still debated.
How far has inflation come back down?
since_peak = inflation_yoy['2022-07':]
at_or_below_2 = inflation_yoy[inflation_yoy <= 2]
print(f"peak year-over-year inflation: {inflation_yoy['2021':'2023'].max():.1f}% "
      f"({inflation_yoy['2021':'2023'].idxmax():%Y-%m})")
print(f"lowest reading since then:     {since_peak.min():.1f}% "
      f"({since_peak.idxmin():%Y-%m})")
print(f"latest reading:                {inflation_yoy.iloc[-1]:.1f}% "
      f"({inflation_yoy.index[-1]:%Y-%m})")
print(f"last month at or below 2%:     {at_or_below_2.index[-1]:%Y-%m}")
peak year-over-year inflation: 9.1% (2022-06)
lowest reading since then:     2.3% (2025-04)
latest reading:                3.7% (2026-09)
last month at or below 2%:     2021-02
Year-over-year CPI inflation came down quickly from its 2022 peak, but as of this writing it has not been back to 2 percent since early 2021.
97.7.3. The Phillips curve across three eras#
The book coaxed a Phillips curve from 1960-1982 data.
The most striking post-1999 pattern is how unstable the inflation-unemployment scatter has been across eras.
We split the sample into the book’s acceleration era, the Great Moderation, and the post-2008 period, and plot inflation against unemployment in each.
scatter_data = pd.concat([inflation_yoy.rename('inflation'),
                          u_full.rename('unemployment')], axis=1).dropna()

last_year = scatter_data.index[-1].year
eras = [('1960', '1983', '1960-1983 (acceleration)'),
        ('1984', '2007', '1984-2007 (Great Moderation)'),
        ('2008', None, f'2008-{last_year} (crisis, COVID, surge)')]

fig, axes = plt.subplots(1, 3, figsize=(14, 4.5), sharex=True, sharey=True)
for ax, (lo, hi, title) in zip(axes, eras):
    era_data = scatter_data.loc[lo:hi]
    ax.scatter(era_data['unemployment'], era_data['inflation'], s=8, alpha=0.5)
    ax.axhline(0, color='k', lw=0.5)
    ax.set_xlabel('unemployment')
    ax.set_title(title, fontsize=10)
axes[0].set_ylabel('inflation (year-over-year)')
plt.tight_layout()
plt.show()
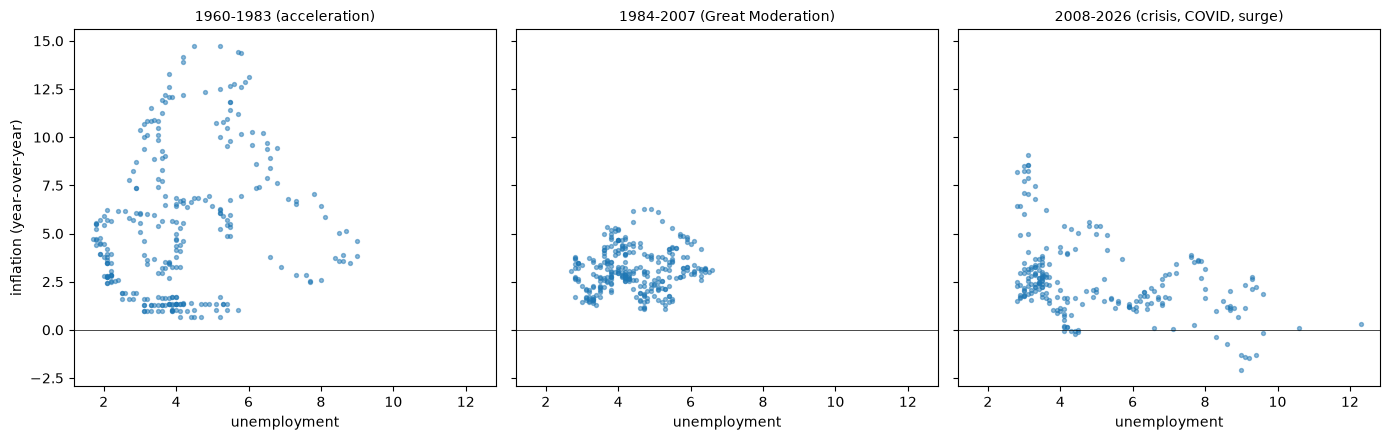
Fig. 97.7 The inflation-unemployment scatter across three eras#
Here are the correlation and the least squares slope of inflation on unemployment in each era.
for lo, hi, title in eras:
    era_data = scatter_data.loc[lo:hi]
    corr = era_data.corr().iloc[0, 1]
    slope = np.polyfit(era_data['unemployment'], era_data['inflation'], 1)[0]
    print(f"{title:38s} correlation {corr:+.2f}   slope {slope:+.2f}")
1960-1983 (acceleration)               correlation +0.19   slope +0.43
1984-2007 (Great Moderation)           correlation +0.11   slope +0.13
2008-2026 (crisis, COVID, surge)       correlation -0.42   slope -0.40
In 1960-1983 the points sprawl across a wide range of inflation rates — the era of shifting expectations and Phillips loops; in levels the correlation is weakly positive, because the adverse shifts swamp the tradeoff.
In 1984-2007 they collapse into a tight, low, nearly flat cloud — the Great Moderation, in which inflation barely responded to unemployment at all.
Since 2008 the scatter is L-shaped: flat at moderate and high unemployment, through the slow recovery from the financial crisis and the COVID recession, and nearly vertical at low unemployment, where the 2021-2022 surge sits.
Paradoxically, it is the only era whose correlation in levels is clearly negative.
An L shape is consistent with a convex Phillips curve, steep only when labor markets are tight, or with supply shocks that happened to arrive when unemployment was low.
Whatever the Phillips curve is, it is not a stable reduced-form relationship.
That is exactly what a natural-rate economy with drifting government beliefs predicts: the structural curve, which links unemployment to surprise inflation, can stay put while the empirical curve, which links it to inflation itself, drifts with expectations and policy.
Exercise 97.3 repeats the comparison at business-cycle frequencies, where the answer is different.
97.7.4. What the new data mean for the two stories#
The additional quarter-century neither refutes nor confirms either story cleanly, but it sharpens both.
For the triumph of natural-rate theory. The Great Moderation reads as the triumph completed: with the natural-rate consensus entrenched and central-bank independence established, inflation stayed low and expectations stayed anchored for a generation.
In the book’s language, policy makers had learned a correct rational expectations version of the natural-rate hypothesis and found devices to commit themselves to low inflation — the outcome the book hoped for.
Even the 2021-2022 surge, on this reading, supports the triumph: once the Federal Reserve moved decisively, inflation came down quickly from its peak and long-run expectations never came unmoored, although inflation has not yet returned to its pre-2021 level.
For the vindication of econometric policy evaluation. The surge is also a reminder that the monetary authority’s model can still mislead it: the widely held 2021 view that inflation would be “transitory” was a model that the data falsified, and policy adjusted only after beliefs did.
The decade of low, below-target inflation before 2020 — the apparently flat Phillips curve, with neither the “missing disinflation” of 2009-2013 nor the “missing inflation” of 2015-2019 fitting a stable curve — is precisely the kind of drifting empirical relationship whose changing slope and intercept the book’s adaptive government tracks in real time.
Exercise 97.2 asks you to track them as such a government would.
Note
A caveat the book itself insists on, for its own sample as much as for ours: its mechanisms assume that the fundamentals — the true data-generating process — are stable, so that all the action comes from the government’s evolving beliefs.
As we saw above, the book declines to “examine unusual supply shocks”, and that leaves out the oil shocks of 1973 and 1979 just as it leaves out the pandemic disruptions and energy prices of 2021-2022.
Disentangling shifting beliefs from shifting fundamentals is exactly the identification problem that makes this history so hard, and so interesting; Drifts and Volatilities takes it on directly.
The tools built in the rest of this suite — self-confirming equilibria, drifting coefficients, and escape dynamics — remain a natural language for asking the question the new data pose: will low inflation keep re-anchoring after each shock, or can a sequence of surprises still set beliefs drifting, as they did after 1965?
Put in the terms of the book’s title: has the conquest of American inflation been lost?
Drifts and Volatilities and Drifts and Volatilities after 2000 ask the data directly whether the coefficients of post-war U.S. macroeconomic dynamics really drifted, before and after 2000.
The closing lecture, The Lost Conquest: Fed Policy in the 2020s, turns the suite’s tools on the 2021-2022 surge and asks why the Federal Reserve was so slow to respond.
We begin building the models in The Credibility Problem.
97.8. A note on notation#
The lectures follow the notation of the source each one is based on, and those sources do not agree with one another.
Rather than impose a single scheme and diverge from the papers a reader may want to consult, we keep each lecture faithful to its source and record the translations here.
Readers arriving from the Bounded Rationality suite should note that there \(\gamma\) is the learning gain and the government’s beliefs are \(\alpha\) (Notation across the series, and the dictionary in A government learning the Phillips curve); from Adaptive Expectations and the Phelps Problem to Priors, Escapes, and Learning Cycles, \(\gamma\) is the government’s beliefs.
Econometric Policy Evaluation estimates the model of chapter 9 of the book in the book’s notation, that of Adaptive Learning and Escape Dynamics: inflation \(y\), beliefs \(\gamma\) and \(\beta\), forgetting factor \(\lambda\), and discount factor \(\delta\).
Several letters change jobs, and a reader carrying symbols forward will otherwise be caught by them.
The letter \(x\) changes sides: up to Adaptive Learning and Escape Dynamics it is what the public expects, while in Escaping Nash Inflation and Priors, Escapes, and Learning Cycles it is what the government sets. The two coincide in equilibrium, which is exactly what makes the switch easy to miss. In The Lost Conquest: Fed Policy in the 2020s, \(x\) is the output gap.
The letter \(\theta\) is the slope of the Phillips curve in the early lectures, the government’s whole belief vector in The Lost Conquest: Fed Policy in the 2020s, and an econometrician’s coefficients, not a government’s beliefs, in Drifts and Volatilities and Drifts and Volatilities after 2000.
The letter \(\gamma\) is the government’s beliefs from Adaptive Expectations and the Phelps Problem to Priors, Escapes, and Learning Cycles, but the learning gain in The Lost Conquest: Fed Policy in the 2020s, as in the Bounded Rationality suite.
The letter \(\beta\) is the government’s Keynesian Phillips-curve coefficients in Adaptive Expectations and the Phelps Problem, Self-Confirming Equilibria, and Adaptive Learning and Escape Dynamics, the Federal Reserve’s discount factor in The Lost Conquest: Fed Policy in the 2020s (where \(\beta_n\) is the discount factor of its New Keynesian model of the economy), and a block of covariance parameters in Drifts and Volatilities.
The letter \(\lambda\) works several shifts: the Cagan–Friedman adaptation parameter in Adaptive Expectations and the Phelps Problem, a forgetting factor in Adaptive Learning and Escape Dynamics, a prior-tightening parameter in Priors, Escapes, and Learning Cycles, a block of parameters in Drifts and Volatilities, and a measured persistence root in The Lost Conquest: Fed Policy in the 2020s, where \(\lambda_x\) is also the weight on the output gap in the Federal Reserve’s loss function.
The static model of Escaping Nash Inflation and Priors, Escapes, and Learning Cycles comes in two orderings, because each lecture follows its source paper.
Escaping Nash Inflation follows Cho et al. [2002] and lists the slope of the government’s regression first, while Priors, Escapes, and Learning Cycles and A government learning the Phillips curve follow Sargent and Williams [2005] and list the intercept first.
The constant gains differ across lectures too, again following the sources.
gain |
where |
source |
|---|---|---|
0.025 |
the book’s forgetting factor \(\lambda = .975\) (chapter 8) |
|
0.02 |
the condensed model of the Bounded Rationality suite |
|
a range |
escape times as the gain varies |
|
0.05 and 0.02 |
0.05, the largest gain in the tables of Sargent and Williams [2005], for the analysis; 0.02 for the constant-gain comparison with A government learning the Phillips curve |
|
0.015 |
chapter 9 of the book and Econometric Policy Evaluation, quarterly data |
the book fixes \(\lambda = .985\) and \(\delta = .999\) and estimates the rest |
0.03 |
Sargent and Williams [2025], quarterly data |
Because the length of a period differs across these settings, the numbers are not directly comparable: a gain \(g\) gives the data an effective memory of about \(1/g\) periods.
Smaller gains make escapes from the self-confirming equilibrium rarer, but at gains like those of Adaptive Learning and Escape Dynamics and A government learning the Phillips curve escapes are frequent; Escaping Nash Inflation measures how escape times grow as the gain shrinks.
97.9. Exercises#
Exercise 97.1
The claim that “focusing on the business-cycle components sharpens the apparent Phillips curve” can be made quantitative, and the loops in Figure 1.5 can be explained.
Work with the monthly series in data over 1961-1982, the part of the book’s window that the filtered series cover.
Compute the correlation between inflation and unemployment for the raw monthly series and for the 13-month moving average of inflation plotted in Figure 1.4.
Split each raw series into three frequency bands — periods longer than 84 months, periods between 24 and 84 months (the Baxter-King components of Figure 1.5), and periods shorter than 24 months — and compute the correlation within each band. Hint:
bkfilter(data, low=2, high=84, K=84)keeps all periods shorter than 84 months; subtracting it from the data leaves the low-frequency band, and subtracting the business-cycle band from it leaves the high-frequency band.Which band carries the Phillips curve, and which carries the adverse shifts? Why is the raw correlation close to zero?
For the business-cycle components, compute \(\operatorname{corr}(\pi_t, U_{t-k})\) for \(k = 0, 1, \ldots, 24\) months, where \(\pi_t\) is inflation and \(U_t\) unemployment. At what lag is the correlation most negative, and how does that lag explain the direction of the loops in Figure 1.5?
Solution
We split the data into the three bands and compute the correlations.
window = slice('1961', '1982')

below_84 = bkfilter(data, low=2, high=84, K=84)   # periods under 84 months
below_84.columns = data.columns
cycle = bk.set_axis(data.columns, axis=1)          # periods of 24-84 months
bands = {'over 84 months': data.loc[below_84.index] - below_84,
         '24 to 84 months': cycle,
         'under 24 months': below_84 - cycle}

smoothed = pd.concat([inflation_ma, u], axis=1).dropna()
raw_var = data.loc[window, 'inflation'].var()

print(f"{'raw monthly series':28s} correlation "
      f"{data.loc[window].corr().iloc[0, 1]:+.2f}")
print(f"{'13-month moving average':28s} correlation "
      f"{smoothed.loc[window].corr().iloc[0, 1]:+.2f}")
for name, band in bands.items():
    b = band.loc[window]
    share = b['inflation'].var() / raw_var
    print(f"{'periods ' + name:28s} correlation {b.corr().iloc[0, 1]:+.2f}"
          f"   share of inflation variance {share:.2f}")
raw monthly series           correlation +0.04
13-month moving average      correlation +0.11
periods over 84 months       correlation +0.46   share of inflation variance 0.45
periods 24 to 84 months      correlation -0.64   share of inflation variance 0.14
periods under 24 months      correlation -0.15   share of inflation variance 0.40
The raw correlation is close to zero because it mixes three bands with correlations of opposite sign.
At periods longer than seven years the correlation is positive: these are the adverse shifts of the Phillips curve, the slowly moving component that the natural-rate theory attributes to expected inflation, and the vindication story to the government’s drifting beliefs.
At business-cycle periods the correlation is strongly negative: this band carries the Phillips curve.
At periods shorter than two years, which hold a large share of the variance of raw monthly inflation, much of it rounding and seasonal noise in the unadjusted index, the correlation is weak.
Smoothing alone does not help: the 13-month moving average removes most of the high-frequency band but leaves the positive low-frequency shifts in place, so its correlation is, if anything, slightly more positive than the raw one.
The bandpass filter works because it removes both.
Now the lead-lag pattern.
lags = np.arange(25)
cross = np.array([cycle['inflation'].corr(cycle['unemployment'].shift(k).loc[window])
                  for k in lags])
k_star = lags[np.argmin(cross)]
print(f"corr(π_t, U_t)       = {cross[0]:+.2f}")
print(f"most negative at k = {k_star} months: corr(π_t, U_t-k) = {cross.min():+.2f}")
corr(π_t, U_t)       = -0.64
most negative at k = 6 months: corr(π_t, U_t-k) = -0.81
The correlation is most negative when inflation is paired with unemployment about six months earlier, so inflation lags unemployment.
That lag is what makes the loops in Figure 1.5, with unemployment on the horizontal axis, run clockwise.
Start at a peak of unemployment, on the right of a loop.
As unemployment falls, inflation has not yet responded, so the path moves left along the bottom; after unemployment bottoms out, inflation reaches its peak about half a year later, so the path climbs the left side; as unemployment rises, inflation is still high, so the path moves right along the top; and so on around.
Exercise 97.2
Lucas observed that forecasters kept adjusting the constant terms of their equations.
Let’s watch an econometrician do this to the empirical Phillips curve, regressing unemployment on inflation as the governments of A government learning the Phillips curve, Escaping Nash Inflation, and Priors, Escapes, and Learning Cycles do.
Let \(\pi_t\) be year-over-year CPI inflation (inflation_yoy), which uses only past data, and \(U_t\) unemployment (u_full).
Estimate
by recursive least squares.
Start from ordinary least squares estimates on 1954-1959 and update monthly from January 1960 to the latest month, using
where \(z_t = (1, \pi_t)^\top\).
Use the constant gain \(g_t = 0.02\) of A government learning the Phillips curve, which with monthly data gives an effective memory of about four years, and plot \(a_t\) and \(b_t\).
Repeat with the decreasing gain \(g_t = 1/t\) of ordinary least squares, counting \(t\) from the start of the 1954-1959 pre-sample, and compare.
How did the estimated slope \(b_t\) behave in the late 1960s, in the 1970s, and after 2008? What happened to the intercept \(a_t\)?
The static government of A government learning the Phillips curve would set target inflation \(-a_t b_t / (1 + b_t^2)\). Compare that target with actual inflation.
Solution
Here is a recursive least squares routine that handles both gains.
def rls_phillips(π, U, coef0, R0, gain=None, t0=0):
    """
    Recursive least squares for U_t = a + b π_t, starting from estimates
    coef0 = (a, b) and moment matrix R0 based on t0 observations.  Uses a
    constant gain if `gain` is given and the gain 1/t of ordinary least
    squares otherwise.
    """
    coef, R = coef0.copy(), R0.copy()
    path = np.empty((len(π), 2))
    for t in range(len(π)):
        g = gain if gain is not None else 1 / (t0 + t + 1)
        z = np.array([1.0, π[t]])
        R = R + g * (np.outer(z, z) - R)
        coef = coef + g * np.linalg.solve(R, z * (U[t] - z @ coef))
        path[t] = coef
    return path

rls_data = pd.concat([inflation_yoy.rename('π'), u_full.rename('U')],
                     axis=1).dropna()
pre, est = rls_data.loc[:'1959'], rls_data.loc['1960':]

Z = np.column_stack([np.ones(len(pre)), pre['π']])
coef0 = np.linalg.lstsq(Z, pre['U'], rcond=None)[0]   # OLS on the pre-sample
R0 = Z.T @ Z / len(pre)

paths = {}
for label, gain in [('constant gain 0.02', 0.02), ('least squares, gain 1/t', None)]:
    path = rls_phillips(est['π'].values, est['U'].values, coef0, R0,
                        gain=gain, t0=len(pre))
    paths[label] = pd.DataFrame(path, index=est.index, columns=['a', 'b'])
    paths[label]['target'] = (-paths[label]['a'] * paths[label]['b']
                              / (1 + paths[label]['b']**2))
We plot the drifting coefficients and the static rule’s target.
fig, axes = plt.subplots(3, 1, figsize=(10, 9), sharex=True)
for label, p in paths.items():
    axes[0].plot(p['a'], lw=1.2, label=label)
    axes[1].plot(p['b'], lw=1.2, label=label)
    axes[2].plot(p['target'], lw=1.2, label=f'static target, {label}')
axes[2].plot(est['π'], 'k', lw=0.6, alpha=0.6, label='actual inflation')
axes[1].axhline(0, color='k', lw=0.5)
axes[0].set_ylabel('intercept $a_t$')
axes[1].set_ylabel('slope $b_t$')
axes[2].set_ylabel('percent')
axes[2].set_xlabel('year')
for ax in axes:
    ax.legend(fontsize=8, loc='upper left')
plt.tight_layout()
plt.show()
A few numbers make the comparison precise.
cg, ls = paths['constant gain 0.02'], paths['least squares, gain 1/t']
for lo, hi in [('1960', '1971'), ('1972', '2007'), ('2008', '2015'), ('2016', None)]:
    b = cg.loc[lo:hi, 'b']
    print(f"steepest constant-gain slope, {lo}-{b.index[-1].year}: "
          f"{b.min():+.2f} ({b.idxmin():%Y-%m})")
print(f"constant-gain slope, 1974-1981: {cg.loc['1974':'1981', 'b'].min():+.2f} "
      f"to {cg.loc['1974':'1981', 'b'].max():+.2f}")
print(f"constant-gain intercept, range: {cg['a'].min():.1f} to {cg['a'].max():.1f}")
print(f"least squares, after 1975:  intercept {ls.loc['1975':, 'a'].min():.1f} "
      f"to {ls.loc['1975':, 'a'].max():.1f},  slope {ls.loc['1975':, 'b'].min():+.2f} "
      f"to {ls.loc['1975':, 'b'].max():+.2f}")
print(f"constant-gain static target, 1960-1985: "
      f"{cg.loc[:'1985', 'target'].min():.1f} to {cg.loc[:'1985', 'target'].max():.1f};"
      f"  actual inflation peak {est.loc[:'1985', 'π'].max():.1f}")
steepest constant-gain slope, 1960-1971: -0.62 (1967-12)
steepest constant-gain slope, 1972-2007: -0.24 (1983-11)
steepest constant-gain slope, 2008-2015: -0.92 (2011-02)
steepest constant-gain slope, 2016-2026: -0.98 (2021-02)
constant-gain slope, 1974-1981: -0.11 to +0.17
constant-gain intercept, range: 2.7 to 8.1
least squares, after 1975:  intercept 3.4 to 4.6,  slope -0.09 to +0.10
constant-gain static target, 1960-1985: -0.5 to 1.9;  actual inflation peak 14.8
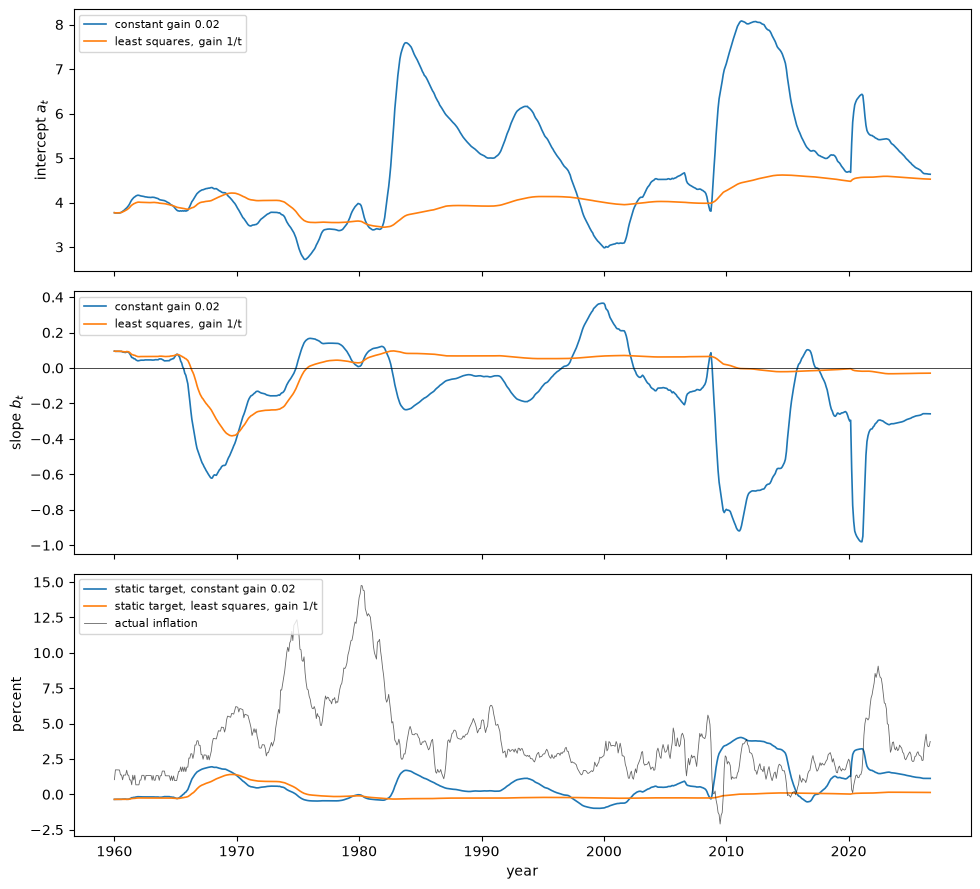
With the constant gain, the estimated slope is close to zero in the early 1960s and then turns strongly negative in the late 1960s: as the data then showed it, the tradeoff of Samuelson and Solow looked real and exploitable.
During the 1970s it flattens back to zero and at times turns positive, as inflation rose without bringing unemployment down.
That is the adverse shift, and in the static model of Escaping Nash Inflation a slope near zero is exactly the belief that leads the government to aim for zero inflation.
After 2008 the slope turns sharply negative twice, when the unemployment spikes of 2009 and 2020 arrived with falling inflation; these are the steepest slopes of the whole sample.
The intercept drifts too, jumping in the early 1980s, when the Volcker disinflation coincided with high unemployment, and again after 2008 and in 2020: these are Lucas’s adjusted constants.
With the decreasing gain the estimates move only slowly after the mid-1970s, because least squares weights an observation from 1955 as heavily as one from last month and so stops tracking drift.
Before 1985 the static government’s target never rises much above 2 percent, nowhere near the inflation of the 1970s.
A static, classical government fit to these data would never have recommended the Great Inflation; chapter 9 of the book finds that its own classical model “fails even to match the acceleration in inflation leading up to 1970” and prefers a distributed-lag Keynesian specification (Econometric Policy Evaluation).
Constant-gain least squares approximates a Kalman filter for coefficients that drift as random walks, under a particular prior about the drift (Priors, Escapes, and Learning Cycles); Adaptive Learning and Escape Dynamics puts such a learner inside the model, and Drifts and Volatilities lets an econometrician’s VAR coefficients drift in the same way.
Exercise 97.3
The three-eras figure compares the eras in levels.
Repeat the comparison at business-cycle frequencies.
Apply the Baxter-King filter of Figure 1.3 to raw monthly inflation (
inflation_full) and unemployment (u_full) over the whole sample. Where do the filtered series end, and why?To reach the end of the sample, use the Christiano-Fitzgerald bandpass filter with the same band,
cffilterinstatsmodels.tsa.filters.cf_filter, which uses asymmetric weights near the ends of the sample instead of dropping them. Check that the two filters agree where both are available.For 1960-1983, 1984-2007, and 2008 to the end of the sample, compute the correlation between the business-cycle components and the least squares slope of the inflation component on the unemployment component. Was the Great Moderation’s Phillips curve flat at business-cycle frequencies? What happened after 2008?
Solution
We filter the full sample both ways.
from statsmodels.tsa.filters.cf_filter import cffilter

full = pd.concat([inflation_full.rename('inflation'),
                  u_full.rename('unemployment')], axis=1).dropna()

bk_full = bkfilter(full, low=24, high=84, K=84).set_axis(full.columns, axis=1)
cf_full = cffilter(full, low=24, high=84, drift=True)[0].set_axis(full.columns, axis=1)

print(f"data end in {full.index[-1]:%Y-%m}; "
      f"Baxter-King components end in {bk_full.index[-1]:%Y-%m}")
overlap = bk_full.index
for col in full.columns:
    print(f"{col}: correlation of the two filters' components "
          f"{bk_full[col].corr(cf_full.loc[overlap, col]):.2f}")
data end in 2026-09; Baxter-King components end in 2019-09
inflation: correlation of the two filters' components 0.98
unemployment: correlation of the two filters' components 0.97
The Baxter-King filter is a two-sided moving average with 84 months on each side, so it loses the last seven years of data, including the whole 2021-2022 surge.
The Christiano-Fitzgerald components track the Baxter-King ones closely where both exist; near the end of the sample they rest on one-sided information and will be revised as new data arrive.
For comparison with Exercise 97.1, we also compute the correlation in the band of periods longer than 84 months, using the same filter.
below_84_cf = cffilter(full, low=2, high=84, drift=True)[0].set_axis(full.columns, axis=1)
low_cf = full - below_84_cf                       # periods over 84 months

eras_bc = [('1960', '1983'), ('1984', '2007'), ('2008', None)]
for lo, hi in eras_bc:
    e = cf_full.loc[lo:hi]
    corr = e.corr().iloc[0, 1]
    slope = np.polyfit(e['unemployment'], e['inflation'], 1)[0]
    corr_low = low_cf.loc[lo:hi].corr().iloc[0, 1]
    print(f"{lo}-{e.index[-1].year}: business cycle: correlation {corr:+.2f}, "
          f"slope {slope:+.2f}, sd of inflation {e['inflation'].std():.2f};"
          f"  over 84 months: correlation {corr_low:+.2f}")
b = bk_full.loc['2008':'2019']
print(f"2008-{b.index[-1].year}, Baxter-King business cycle: correlation "
      f"{b.corr().iloc[0, 1]:+.2f}")
1960-1983: business cycle: correlation -0.67, slope -1.62, sd of inflation 1.72;  over 84 months: correlation +0.31
1984-2007: business cycle: correlation -0.68, slope -1.10, sd of inflation 0.81;  over 84 months: correlation +0.00
2008-2026: business cycle: correlation -0.25, slope -0.39, sd of inflation 1.45;  over 84 months: correlation -0.38
2008-2019, Baxter-King business cycle: correlation -0.07
At business-cycle frequencies the Great Moderation’s Phillips curve was about as tight as that of 1960-1983, with a similar negative correlation, but flatter, and its swings were smaller.
What disappeared after 1984 was the low-frequency drift that swamps the tradeoff in levels, whose correlation falls from positive to about zero, not the business-cycle tradeoff itself.
After 2008 the business-cycle correlation weakens sharply, and with the Baxter-King filter over 2008-2019, before the pandemic and the surge, it nearly vanishes.
So the “flat Phillips curve” of the 2010s, unlike the flatness of the Great Moderation, shows up at business-cycle frequencies too.
The ranking is the reverse of the one in levels, where the post-2008 era was the only one with a clearly negative correlation; that correlation comes mainly from movements slower than the business cycle.
Near the end of the sample these low-frequency components rest on one-sided information, so the last of these numbers is the least reliable.