96. 1993 Prospects for Bounded Rationality in Macroeconomics#
96.1. Overview#
This is the closing lecture of the series, and it is different in kind from the others.
It carries no new model.
Instead it gathers the judgments that Sargent [1993] recorded in 1993 — the opinions, reservations, and hopes with which he ended Bounded Rationality in Macroeconomics — and loops them back to the quest that opened the book, and that opened A Peculiar Definition of Bounded Rationality, the first lecture here.
That quest had a destination: a theory of transition dynamics, the out-of-equilibrium adjustment that the Eastern European reformers of 1989 had to manage with no map.
The route was to expel the rational agents from our models and replace them with “artificially intelligent” agents who behave like econometricians, who gather data, form theories, estimate, and adapt.
We can now ask how far that route carried us, by 1993, toward the destination.
Sargent’s own answer is a ledger, with entries on both sides.
On the credit side: adaptive dynamics as a device for selecting among equilibria, as a tool — evolutionary programming — for computing them, and as a source of new tools for econometricians.
On the debit side: the original prize, a theory of transition dynamics, is largely unclaimed; the agents must be heavily prompted; and a striking asymmetry has emerged.
The program set out to make the agents in our models behave more like econometricians.
The econometricians, Sargent observes, have not returned the compliment.
This lecture explains that asymmetry, gives it a concrete numerical face, and asks when it fails.
It then settles, one by one, the four payoffs that A Peculiar Definition of Bounded Rationality promised, including one, new sources of dynamics, that the series delivers but Sargent’s closing ledger leaves out.
The lecture closes with a postscript on what became of the program after 1993.
Let’s start with some imports.
import numpy as np
import matplotlib.pyplot as plt
96.2. The quest, restated#
The knowledge that rational expectations imputes set out the argument against which everything below is measured.
Rational expectations imposes two requirements, individual rationality and mutual consistency of perceptions, and when a rational expectations model is taken to data it imputes to the agents inside it far more knowledge than the econometrician studying them has.
The bounded rationality program proposes to close that gap from the other side, by making the agents learn the distributions from data, as the econometrician must.
The hope was a description of the system while it is still adjusting, before beliefs and outcomes have settled into mutual consistency: a theory of transition dynamics.
What the program is good for listed four payoffs the program might deliver: equilibrium selection, computation, transition dynamics and the analysis of regime changes, and new sources of dynamics.
We take stock following Sargent [1993]’s own accounting: first the debits, then the central asymmetry, then the credits; and then we settle each of the four payoffs.
96.3. The debit side: how much we must hard-wire#
The first reservation is about arbitrariness.
Bounded rationality is most easily defined by what it is not — rational expectations — and that very malleability is a liability.
Once we stop insisting that agents know the equilibrium, we must decide, case by case, exactly what they do know and how they learn it.
Do they know their own utility and profit functions, or must they learn those too?
Do they know calculus and dynamic programming, or only trial and error?
Do they learn from their own experience alone, or from others’?
To what class of approximating functions do we confine what they learn about?
Every model in this series answered these questions by hard-wiring, by prompting the agents heavily, with an eye on the outcome we hoped they would reach.
The series descended a gradient of prompting, telling its agents a little less at each step.
Bray’s least squares learners (From relaxation to learning: Bray’s market; see also Least Squares Learning in Self-Referential Models), who reappear below, know the correct supply curve and need only estimate one conditional expectation to plug into it.
The Marcet–Sargent agents of the book’s investment example (see Least Squares Learning in Self-Referential Models) know dynamic programming, know their return function, and know the parametric form of the law of motion — they lack only its coefficients, which they update by vector autoregression.
The Robbins–Monro agents of Adaptive Agents in an Overlapping Generations Monetary Economy know their utility function but not the distributions they face; the agents of Learning, Approximation, and Equilibrium Computation must in addition choose a functional form; the Newton–Raphson learners of Exchange Rate Indeterminacy, Learning, and Experiments know the gradient of their own payoff.
Even the least prompted agents — the genetic-algorithm strings of Exchange Rate Indeterminacy, Learning, and Experiments and the classifier systems of Networks, Genetic Algorithms, and Classifier Systems and Money as a Medium of Exchange among Artificially Intelligent Agents, which see only a payoff signal and recognize utility only when they experience it — are still told when to choose and what information to condition on, and the entire apparatus of their accounting system and genetic operators is designed by hand, with the Kiyotaki–Wright equilibrium in view.
Sargent named the consequence: “a concomitant sensitivity of outcomes to details of adaptive algorithms.”
Economy A2 of Money as a Medium of Exchange among Artificially Intelligent Agents is the sharpest case in the series (Economy A2.1: when theory predicts speculation).
For patient agents, the speculative equilibrium is the unique stationary equilibrium of that economy, yet the classifier agents settle on the fundamental pattern of trade.
That is not learning selecting among equilibria, since there is nothing to select among.
It is convergence to an outcome that is not an equilibrium of the economy the agents live in.
Marimon et al. [1990] suspected early myopia of “diverting the economy towards a low discount-factor stationary equilibrium, such as the fundamental equilibrium”, and The bucket brigade’s discount factor shows why: the bucket brigade makes the agents effectively very impatient.
The outcome is a property of how the agents were built, and the paper itself reports (its footnote 15) that a genetic algorithm studied by Marimon and Miller reached the speculative equilibrium in 25 of 30 runs.
The second reservation is about simplicity.
The learning tasks we set our agents are trivial next to those in a first econometrics course, let alone those that real firms and households are implicitly solving.
We ask an agent to learn a single time-invariant decision rule, or a fixed collection of conditional expectations.
We do not ask it to learn the parameters of a simultaneous-equations system, or to infer a mapping from policy regimes to distributions, the tasks that make econometrics hard.
Even the choice of what to learn is a prompt.
Agents in Learning, Approximation, and Equilibrium Computation who are confined to a low-order polynomial converge to an approximate equilibrium, a fixed point of the restricted problem rather than the rational expectations equilibrium, and the modeller’s choice of family decides how close they come.
Put together, these reservations bear directly on the original prize.
The environments into which we have cast our adaptive agents are far more stable and hospitable than the transitions we actually care about.
Convergence-rate results are scarce, and tractability forces us to restrict the distribution of agents’ beliefs severely.
So the literature on adaptive processes, Sargent judged in 1993, falls well short of a secure foundation for a theory of real-time transition dynamics, the very thing the quest set out to find.
He declines to end on that failure, though, and the baseball metaphor he reaches for is deliberately modest:
It would not be wise or fair to end this essay by dwelling on the failure of adaptive methods so far to have ‘hit a home run’ by giving us a good theory of transition dynamics. The problem of transition dynamics is difficult and long-standing. So maybe it should count as a single, or at least a sacrifice fly, that these methods have sharpened our appreciation of the problem.
96.4. Why the econometricians have not returned the compliment#
Here is the asymmetry that gives this lecture its theme.
The bounded rationality program is, at bottom, a movement to make the agents in our models behave more like the econometricians who build and estimate those models.
Imitation is the sincerest form of flattery.
We might therefore have expected macroeconometricians to rush to fit these models to data.
There was no rush.
Chung [1990] estimated the Sims policy-maker model (A government learning the Phillips curve), in which a government runs a Kalman filter (A First Look at the Kalman Filter) on a Phillips curve whose coefficients it believes drift as random walks.
Along with the structural parameters, Chung estimated the variances of the drift and the prior mean that started the government’s filter.
Sargent called this “the only econometrically serious macroeconomic implementation of bounded rationality of which I know.”
Why the reluctance?
The reasons are worth spelling out, because they are not about taste.
The governing dictum among applied econometricians is Lucas’s: beware of theorists bearing free parameters.
Replacing a rational agent with a boundedly rational one adds parameters: parameters describing beliefs and how beliefs move.
Take the simplest case, Bray’s model.
Relative to its rational expectations version, the adaptive version adds at least the initial belief and a parameter setting the gain sequence, and one might want more parameters to describe the gain’s shape.
That would already give Lucas’s warning something to bite on.
But there is a deeper problem, and it is the reason the added parameters are not just unwelcome but genuinely hard to estimate.
Because Bray’s adaptive system converges to the rational expectations equilibrium, which in her model is unique, the extra parameters influence only the transient.
The asymptotic distribution of the data contains no information about them.
Let us see this directly.
96.4.1. The nuisance parameter, made concrete#
Bray’s cobweb economy [Bray, 1982] sets the market price by
where \(\beta_t\) is the price agents expect, formed by averaging past prices,
and \(u_t\) is an IID standard normal shock.
The constant \(t_0\) is the weight the agents attach to the belief they start with, measured in observations: with \(t_0 = 50\) they treat \(\beta_0\) as though it summarized fifty prior prices, so that after \(t\) periods \(\beta_0\) still carries weight \(t_0/(t + t_0)\).
Some such weight is needed for the exercise to have any content.
With \(t_0 = 0\) the first gain is \(\gamma_1 = 1\), so \(\beta_1 = p_0\) exactly and the initial belief is erased after a single period — there would be no transient left for the econometrician to try to estimate.
When \(b < 1\) the belief converges to the rational expectations value \(\beta^\star = a/(1-b)\), whatever value it started from.
That is Bray’s result, and it is the E-stability condition of One recursion, many learners: the associated differential equation \(d\beta/d\tau = T(\beta) - \beta = a + (b - 1)\beta\) is stable exactly when \(b < 1\).
a, b = 5.0, 0.7
t0 = 50                                       # weight on the initial belief
β_star = a / (1 - b)                          # rational expectations belief

def simulate(β0, u):
    "Bray's cobweb under least squares learning, given a shock path u."
    T = len(u)
    β = np.empty(T)
    p = np.empty(T)
    β[0] = β0
    for t in range(T):
        p[t] = a + b * β[t] + u[t]
        if t + 1 < T:
            β[t + 1] = β[t] + (1 / (t + 1 + t0)) * (p[t] - β[t])
    return p, β

print(f"rational expectations belief β* = {β_star:.3f}")
rational expectations belief β* = 16.667
The initial belief \(\beta_0\) is the extra “bounded rationality” parameter.
Watch three economies with very different initial beliefs head toward \(\beta^\star\).
rng = np.random.default_rng(0)
u = rng.standard_normal(400)

fig, ax = plt.subplots(figsize=(7.5, 4))
for β0, colour in [(2.0, 'C0'), (16.667, 'C1'), (40.0, 'C2')]:
    _, β = simulate(β0, u)
    ax.plot(β, color=colour, lw=1.3, label=fr"$\beta_0 = {β0}$")
ax.axhline(β_star, color='k', ls='--', lw=0.8, label=r"$\beta^\star$")
ax.set_xlabel("$t$")
ax.set_ylabel(r"belief $\beta_t$")
ax.legend(frameon=False)
plt.show()
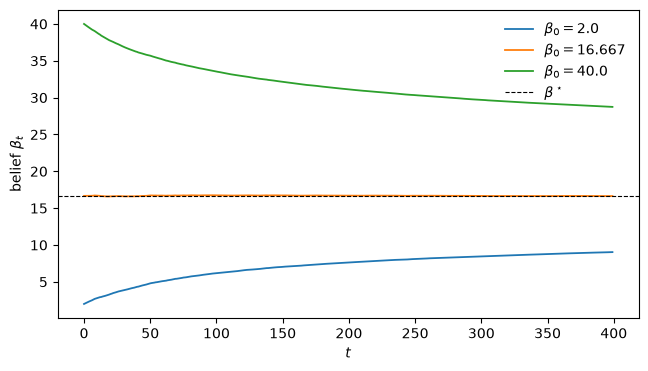
Fig. 96.1 Beliefs drift toward the rational expectations value, slowly#
All three head toward \(\beta^\star\), but slowly.
Each period the learning recursion closes the gap \(\beta_t - \beta^\star\) by the factor \(1 - (1 - b)/(t + t_0)\) on average, so after \(t\) periods roughly \((t_0/(t + t_0))^{1-b}\) of it remains.
for β0 in (2.0, 40.0):
    _, β = simulate(β0, u)
    share = (β[-1] - β_star) / (β0 - β_star)
    print(f"β0 = {β0:4.1f}: share of the initial gap left after {len(u)} periods = {share:.2f}")
print(f"approximation (t0 / (t + t0))^(1 - b) = {(t0 / (len(u) - 1 + t0)) ** (1 - b):.2f}")
β0 =  2.0: share of the initial gap left after 400 periods = 0.52
β0 = 40.0: share of the initial gap left after 400 periods = 0.52
approximation (t0 / (t + t0))^(1 - b) = 0.52
About half the initial gap is still there after 400 periods.
That is slower than the \(1/\sqrt{t}\) rate at which an ordinary estimator settles down, as the book’s chapter 5 warns: least squares learning converges at the \(\sqrt{T}\) rate only when the slope of the associated differential equation, here \(b - 1\), is below \(-1/2\).
Slow forgetting by the economy, however, is not the same thing as information for the econometrician.
Now put on the econometrician’s hat.
Given a sample of prices and the structural parameters \((a, b)\), the model implies a shock \(\hat u_t = p_t - a - b\,\beta_t(\beta_0)\) for any candidate initial belief \(\beta_0\), because the belief path is pinned down by \(\beta_0\) and the observed prices.
The sum of squared implied shocks measures how well a given \(\beta_0\) fits the data.
def belief_path(β0, p):
    "Belief sequence implied by an initial belief and an observed price path."
    T = len(p)
    β = np.empty(T)
    β[0] = β0
    for t in range(1, T):
        β[t] = β[t - 1] + (1 / (t + t0)) * (p[t - 1] - β[t - 1])
    return β

def ssr(β0, p):
    "Sum of squared implied shocks, as a function of the belief parameter β0."
    β = belief_path(β0, p)
    return np.sum((p - a - b * β) ** 2)
Whether the data can pin \(\beta_0\) down is a question of how fast information about it accumulates as the sample grows.
The natural way to read that off is the excess sum of squares — how much worse a wrong \(\beta_0\) fits than the best one.
For an ordinary, well-identified parameter every new observation adds to the penalty for being wrong, so the excess grows in proportion to \(T\) and the confidence interval shrinks like \(1/\sqrt{T}\).
Because the shocks have unit variance, the excess is also a likelihood-ratio statistic, so a penalty above 3.84 rejects the wrong value at the 5 percent level.
Watch what happens here.
grid = np.linspace(2, 40, 80)

def excess_curve(T, seed=1):
    "SSR(β₀) − min SSR across the β₀ grid, for a sample of length T."
    u = np.random.default_rng(seed).standard_normal(T)
    p, _ = simulate(β_star, u)
    curve = np.array([ssr(b0, p) for b0 in grid])
    return curve - curve.min()

fig, ax = plt.subplots(figsize=(7.5, 4))
for T, colour in zip((50, 500, 5000), ('C0', 'C1', 'C2')):
    ax.plot(grid, excess_curve(T), color=colour, lw=1.5, label=f"$T = {T}$")
ax.axvline(β_star, color='k', ls='--', lw=0.8)
ax.set_xlabel(r"belief parameter $\beta_0$")
ax.set_ylabel("excess sum of squares")
ax.legend(frameon=False)
plt.show()
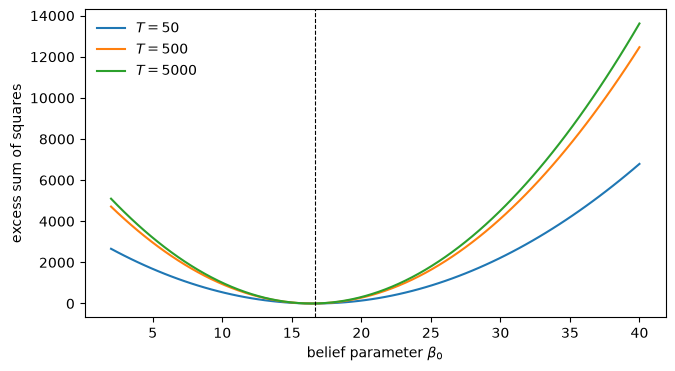
Fig. 96.2 Information about the belief parameter stops accumulating#
The curve for \(T = 50\) is lower, but beyond a few hundred observations the curves lie nearly on top of one another instead of getting steeper.
To see that this is not an artifact of the range plotted, compare the penalty for a wrong \(\beta_0\) with the penalty for a wrong slope \(b\), estimated from the same data.
We compute the slope penalty twice: once holding the intercept \(a\) at its true value, and once re-estimating \(a\) along with \(b\), and we average each penalty over 20 samples.
def ssr_a_free(r):
    "Sum of squared residuals after re-estimating the intercept (removing the mean)."
    return np.sum((r - r.mean()) ** 2)

print(f"{'':>6}   {'β₀ = 2':>8}   {'b = 0.75':>10}   {'b = 0.75':>14}   {'b = 0.75, a re-est.':>19}")
print(f"{'T':>6}   {'':>8}   {'a known':>10}   {'a re-estimated':>14}   {'largest of 20':>19}")
for T in (50, 500, 5_000, 50_000):
    pen_β0, pen_b_known, pen_b_free = [], [], []
    for seed in range(20):
        u = np.random.default_rng(seed).standard_normal(T)
        p, _ = simulate(β_star, u)
        β = belief_path(β_star, p)              # belief path at the true β0
        pen_β0.append(ssr(2.0, p) - ssr(β_star, p))
        pen_b_known.append(np.sum((p - a - 0.75 * β) ** 2)
                           - np.sum((p - a - b * β) ** 2))
        pen_b_free.append(ssr_a_free(p - 0.75 * β) - ssr_a_free(p - b * β))
    print(f"{T:>6}   {np.mean(pen_β0):8.1f}   {np.mean(pen_b_known):10.1f}   "
          f"{np.mean(pen_b_free):14.3f}   {np.max(pen_b_free):19.3f}")
           β₀ = 2     b = 0.75         b = 0.75   b = 0.75, a re-est.
     T                 a known   a re-estimated         largest of 20
    50     2655.4         37.0            0.032                 0.061
   500     4807.9        354.8            0.130                 0.301
  5000     5229.7       3447.5            0.204                 0.290
 50000     5278.7      34702.3            0.274                 0.671
The columns behave completely differently.
The penalty for getting the initial belief wrong stops growing.
Past a few thousand observations it is pinned near a constant, and every further observation is uninformative about \(\beta_0\).
The confidence interval for \(\beta_0\) never shrinks; the parameter is not consistently estimable at all.
The reason is visible in the belief recursion.
Given the observed prices, the econometrician’s reconstructed belief at \(t\) depends on \(\beta_0\) only through the weight \(t_0/(t + t_0)\), and the squares of those weights have a finite sum.
The rest of \(\beta_0\)’s long shadow on the economy is carried by the observed prices themselves.
The penalty for a wrong slope with \(a\) held at its true value grows in proportion to the sample: a hundredfold more data makes a hundredfold stronger case against the wrong value, which is what identification looks like.
But this identification is borrowed.
With \(a\) held fixed, a wrong \(b\) shifts the predicted mean price, and the mean price \(a/(1-b)\) is something the rational expectations version of the model identifies too.
What a learning model adds is the possibility of separating \(a\) from \(b\), and for that the data have to see beliefs move.
The third column shows how little they see.
With \(a\) re-estimated, the penalty is a fraction of one and creeps up by a tenth or less with each tenfold increase in the sample; in none of the 20 samples does it come near 3.84, even with 50,000 observations.
Under a \(1/t\) gain belief motion dies out, so the learning transient is the only thing that separates \(a\) from \(b\): the weakness that makes \(\beta_0\) unidentifiable afflicts the slope too, in milder form.
This is the technical heart of the matter.
The parameters that bounded rationality adds live in the transient, and under a decreasing gain so does the information that would separate the old parameters from one another.
A transient contributes only a limited amount of information no matter how long we watch the economy afterwards, so those parameters become a nuisance to estimate — they enter the likelihood, and the data have little to say about them.
Sargent adds one more reason for the econometricians’ cool response, with a characteristic “maybe”.
Many applied macroeconometricians are in the market for methods that reduce the number of parameters needed to explain the data.
A reduction is precisely what bounded rationality does not offer.
It offers more parameters, most of them weakly identified.
So the flattery ran one way.
The theorists remade their agents in the econometrician’s image; the econometricians, offered models full of extra, poorly-identified parameters, and warned by Lucas against exactly that, declined the gift.
96.4.2. When the equilibrium is not unique#
The argument assumed that learning converges to a unique, E-stable equilibrium, as it does in Bray’s model with \(b < 1\).
Then initial beliefs, and the shape of the gain, can only affect the transient.
Under multiplicity that premise can fail.
In Adaptive Agents in an Overlapping Generations Monetary Economy the initial belief decides whether the economy settles at the low-inflation steady state or collapses (The stability reversal).
In Exchange Rate Indeterminacy, Learning, and Experiments, at the calibration where the Newton–Raphson learner converges, the initial saving rates and portfolio shares fix the limiting exchange rate forever (The dead hand of history).
Where initial beliefs select among a continuum of limits, as in the exchange-rate economy, their effect is permanent, and a permanent effect is one that every new observation helps to measure.
In a deterministic economy like that one, observed with error, the data measure the effect of the initial beliefs at the usual rate, as they would a structural parameter.
Exercise 96.2 shows this, and also shows that permanence is not always enough.
When beliefs are driven by observed prices, as in Bray’s model, the econometrician can reconstruct them from the data, and the initial belief’s weight in that reconstruction dies away whatever the equilibrium structure.
Shocks blur the picture in the exchange-rate economy too: once they enter, even identical starting points converge to different exchange rates (Exercise 93.5), so the limit no longer reflects the initial beliefs alone.
96.5. The credit side: selection, computation, and a returned gift#
The ledger is not one-sided.
Set against those debits, Sargent lists three successes, and the last of them quietly undoes some of the asymmetry just described.
In his opening chapter he also counts as a credit the models’ “success in inspiring useful tests of equilibrium selection”, meaning laboratory experiments.
Equilibrium selection.
Where a rational expectations model has many equilibria, a system of adaptive agents often converges to a particular one, turning learning into a device for selecting among them.
The clearest case in the series is the economy of Adaptive Agents in an Overlapping Generations Monetary Economy, where least squares learners select the low-inflation steady state that the rational expectations dynamics reject (The stability reversal), and where the laboratory subjects of Marimon and Sunder [1993] went the same way.
With no deficit, the same learners kill the bubbles of A Peculiar Definition of Bounded Rationality and select its bubbleless equilibrium (Exercise 91.5).
In Money as a Medium of Exchange among Artificially Intelligent Agents, Economy B has both a fundamental and a speculative equilibrium, and the classifier systems select the fundamental one; in Economy A1, where the fundamental equilibrium is the only one, they find it.
The exchange rate of Exchange Rate Indeterminacy, Learning, and Experiments earns credit only in a weaker sense: learning determines the exchange rate only by remembering where it started, and the limit also moves with the tuning of the algorithm, its stabilizer \(\kappa\) and its gain (The dead hand of history).
Even that much holds only where the Newton–Raphson learner converges; at Arifovic’s calibration, with the same tuning, it does not converge at all.
The book granted that this “may seem a weak reed on which to base exchange rate determination”.
Economy A2 belongs on the debit side, as we saw above.
Nor is selection a welfare theorem.
In the book’s example in the spirit of Brock, which Adaptive Agents in an Overlapping Generations Monetary Economy recalls as a warning, least squares selects a stationary equilibrium that every nonstationary equilibrium Pareto-dominates.
Sargent is candid that his affection for this use sits in some tension with his doubts about the dynamics that perform the selection:
I know that it is inconsistent to doubt the real-time dynamics but keep the equilibria selected by them. I confess that my affection for the selection performed in the monetary models described in Chapter 6 is partly driven by my prior conviction that the selected equilibria seem sensible to me.
Chapter 6 of the book is its chapter on laboratory experiments: Marimon and Sunder’s with the one-currency economy of Adaptive Agents in an Overlapping Generations Monetary Economy, and Arifovic’s with the two-currency economy of Exchange Rate Indeterminacy, Learning, and Experiments.
The selection Sargent has in mind is the low-inflation one, on which least squares learning and Marimon and Sunder’s subjects agreed.
Evolutionary programming.
If a population of adaptive agents reliably converges to an equilibrium, we can run the population as a method of computing the equilibrium, especially in models too complicated to solve by hand (Evolutionary programming).
The procedure is guess-and-verify: the adaptive system supplies the guess, and the economist checks that it satisfies the equilibrium conditions.
That is what Marimon et al. [1990] proposed for a five-good Kiyotaki–Wright economy, for which no analytical characterization was in hand (Money as a Medium of Exchange among Artificially Intelligent Agents): their classifier economy settled down to trading strategies and holding probabilities that suggested an equilibrium (“we could then presumably verify whether it is an equilibrium”), although the paper itself reports only that the patterns “nearly seem to describe” a fundamental equilibrium.
The cleanest instance in the series is Learning, Approximation, and Equilibrium Computation.
There Marcet’s method of parameterized expectations, a tool for computing equilibria, has a learning counterpart in which agents update their forecasting rule as data arrive, and the two share their fixed points and, through the associated differential equation, their stability condition (Parameterized expectations).
The book had already remarked that Marcet’s method “has many aspects of a learning or adaptation algorithm”.
Used this way, the dynamics need not be credible as dynamics.
The book’s chapter 7 describes how Randall Wright, computing a Kiyotaki–Wright equilibrium with endogenous shares of types, told his evolving population the theoretical payoffs it could have learned only from very long histories: hopeless as a model of real time, harmless as a computation.
That division of labor is how one can doubt the dynamics and still compute with them.
Sargent expected this use to be applied often.
New tools for the econometrician.
Here the asymmetry bends back on itself.
The literatures on parallel and genetic algorithms have handed econometricians new computational gadgets — genetic algorithms and stochastic Gauss–Newton procedures among them — for solving their own estimation and optimization problems.
Ellen McGrattan, for instance, applied genetic algorithms to estimate nonlinear rational expectations models, using them to search for the vicinity of a maximum before switching to a Newton method, a use noted in Networks, Genetic Algorithms, and Classifier Systems.
So the econometricians took up the adaptive algorithms after all, not as models of the agents they study, but as tools in their own hands.
The compliment was returned, but through a side door: the algorithms crossed over, the models did not.
New sources of dynamics.
The book’s second chapter listed one more payoff: adaptive agents might generate behavior that rational expectations models find hard to produce, such as the trading volume that the no-trade theorem rules out.
Sargent’s closing ledger does not post it, but the series delivers two instances.
Arifovic’s genetic-algorithm economy in Exchange Rate Indeterminacy, Learning, and Experiments produces an exchange rate that never settles down, even though saving settles near its equilibrium value (A genetic algorithm economy), and even though every equilibrium of that economy in which both currencies are valued has a constant exchange rate.
And the constant-gain government of Adaptive Agents in an Overlapping Generations Monetary Economy produces a recurrent sawtooth of escapes from the self-confirming inflation rate toward zero inflation (A government learning the Phillips curve), dynamics that the model’s unique self-confirming equilibrium does not have.
96.6. Reading the ledger against the quest#
Line the two columns up against the destination we set out for, and against the four payoffs of What the program is good for.
The debit column holds the prize itself.
Sargent had argued in his second chapter that comparing rational expectations equilibria across policy regimes is itself inconsistent with rational expectations, and a theory of how adaptive agents move from one regime to another was supposed to repair that.
A theory of real-time transition dynamics — the map the Eastern European reformers lacked — remained, in 1993, largely unclaimed, blocked by arbitrariness, prompting, over-simple learning tasks, and a shortage of empirical traction.
The credit column holds what the journey delivered along the way: a way to select among multiple equilibria where the selection does not hinge on the details of the algorithm, a practical way to compute equilibria that resist analysis, new sources of dynamics, and a transfer of computational technique into econometrics itself.
The organizing image of the whole book is the gap between the econometrician and the agents inside the model.
Rational expectations closes that gap by lifting the agents up to a knowledge the econometrician lacks.
Bounded rationality proposed to close it from the other side, by bringing the agents down to the econometrician’s level and making them learn.
By 1993 the program had not, on Sargent’s own accounting, delivered the transition dynamics that motivated it, and the econometricians it sought to imitate had kept the models at arm’s length — for the sound reason that those models add parameters the data identify only weakly, and not consistently, when what the econometrician wants is fewer.
But it had sharpened the questions, selected equilibria, computed them, and lent its tools to the very econometricians who declined its models.
That was the state of the prospects for bounded rationality in macroeconomics, as they stood in 1993.
96.7. Postscript: what became of the program#
Three decades is long enough to see which of the 1993 worries were permanent and which were about a field that had not yet found its footing.
96.7.1. The arbitrariness was disciplined#
The first reservation was that once we stop insisting agents know the equilibrium, nothing tells us what to put in its place.
The discipline that matured is expectational stability.
Its core was already in the 1993 book.
A footnote to the book’s chapter 5 writes the limiting dynamics of Bray’s belief as the differential equation \(d\beta/d\tau = T(\beta) - \beta = a + (b - 1)\beta\), where \(T\) maps the perceived forecast into the optimal one.
The same footnote credits DeCanio [1979] and Evans [1985], Evans [1989] with using \(T\) to define expectational stability, and credits Marcet and Sargent [1989] with showing, by the differential-equation methods of Ljung [1977], that \(T(\beta) - \beta\) governs the convergence of least squares learning in a class of models.
Woodford [1990] used the same methods to study learning of sunspot equilibria, and the book’s chapter 5 closes with a section on the associated differential equation.
One recursion, many learners sets out this thread for the whole series.
What came after 1993 was systematization.
Evans and Honkapohja [2001] generalized these results and organized them into a theory of learnability that is now the standard test of whether a rational expectations equilibrium is a plausible outcome of adaptive behavior.
For least squares and related decreasing-gain estimators near a rational expectations equilibrium, E-stability is the right condition, and one can check which equilibria satisfy it without simulating anything.
That narrows the arbitrariness: the selection that least squares performs is not an artifact of the particular recursion the modeller happened to write down.
The condition has limits, and those were mapped too.
It is not a theorem about every algorithm.
Stochastic-gradient learners can fail to learn equilibria that are E-stable [Giannitsarou, 2005].
Population algorithms lie outside the theory altogether: drawing on Arifovic’s 1991 dissertation, the book reports that a genetic-algorithm population can sometimes learn its way to the equilibrium of Bray’s model even when \(b > 1\), where least squares cannot (Sargent [1993], chapter 5), and the classifier agents of Economy A2 converge to something that is not an equilibrium at all.
Within those limits the condition does its job, and the stability reversal of Adaptive Agents in an Overlapping Generations Monetary Economy is a case in point.
Marcet and Sargent’s differential equation already accounted for it in 1993.
In the language of E-stability, it says that \(T'(2) = 1/2 < 1\) at the low-inflation steady state and \(T'(3) = 2 > 1\) at the high one (The stability reversal), and the ranking is a theorem about the model rather than about these parameters (Exercise 91.6).
That is why Bruno and Fischer [1990], using adaptive expectations instead of least squares, found the same reversal: rules that move beliefs toward realized inflation inherit the same stability condition.
The verdict does not even need small gains: with the timing of Adaptive Agents in an Overlapping Generations Monetary Economy, the low steady state is locally stable for every constant gain below 2 and the high one for none (The stability reversal, Exercise 96.1).
Bullard and Duffy [1993] supplied the warning against generalizing too far: in economies whose agents live four or more periods, least squares learning can fail to converge locally to a rational expectations equilibrium.
96.7.2. The transition dynamics arrived, in a narrower form than hoped#
The prize was a theory of out-of-equilibrium adjustment.
What the program delivered instead was a theory of departures from equilibrium: escape dynamics.
In 1993, the escapes of Sims’s government were known only from simulation, which the book presented as formalizations of a story and a counter-story about postwar inflation.
The recurrent sawtooth simulated in A government learning the Phillips curve comes from the constant-gain version of the model that Sargent [1999] studied after 1993.
Cho et al. [2002] characterized its escapes analytically with large-deviations theory, computing the most likely escape path and the rate at which escapes occur, and Williams [2019] extended the characterization considerably.
Sargent and Williams [2005] then explained why the simulated economies of Sims and Chung escape and stay near the Ramsey outcome while Sargent’s are pulled back again and again: the difference lies in how much variance the government attributes to its regression error.
The QuantEcon lectures Escaping Nash Inflation and Priors, Escapes, and Learning Cycles work through both.
This is less than the original quest asked for.
It describes recurrent excursions away from a self-confirming equilibrium, not the arrival of a market economy in a country that never had one.
But it is a genuine theory of a system that does not settle down, derived rather than simulated, and in 1993 there was none.
96.7.3. The econometricians did return the compliment#
Here the 1993 assessment was largely overtaken.
The obstacle, we saw above, was that the added parameters live in a vanishing transient.
But that argument applies to a learning scheme whose gain goes to zero, so that beliefs converge and then stop moving.
With a gain that does not vanish, beliefs never settle.
Their motion is part of the stationary distribution of the data, and the parameters that govern it are identified the way ordinary structural parameters are, from the whole sample.
The 1993 book already had the exception in view.
It noted that its transients came from algorithms that eventually settle down, adding that “the exceptions are the constant-gain algorithms”.
And Chung’s government, the one serious empirical case, ran a Kalman filter on coefficients it believed drift: for given drift variances its gain does not go to zero, which is why those variances could be estimated from the whole sample.
Let us check the claim on Bray’s market, giving the econometrician the harder problem of re-estimating \(a\) and \(b\) along with the gain.
We hold the initial belief at its true value; under a constant gain its influence dies out geometrically.
def simulate_constant_gain(β0, gain, u):
    "Bray's cobweb when agents discount old prices at a fixed rate."
    T = len(u)
    β, p = np.empty(T), np.empty(T)
    β[0] = β0
    for t in range(T):
        p[t] = a + b * β[t] + u[t]
        if t + 1 < T:
            β[t + 1] = β[t] + gain * (p[t] - β[t])
    return p, β

def belief_path_cg(β0, gain, p):
    "Belief sequence implied by a candidate gain and an observed price path."
    T = len(p)
    β = np.empty(T)
    β[0] = β0
    for t in range(1, T):
        β[t] = β[t - 1] + gain * (p[t - 1] - β[t - 1])
    return β

def ssr_ab_free(p, β):
    "Sum of squared residuals after re-estimating a and b by least squares."
    X = np.column_stack([np.ones_like(β), β])
    coef, *_ = np.linalg.lstsq(X, p, rcond=None)
    resid = p - X @ coef
    return resid @ resid

gain_true, gain_wrong = 0.05, 0.08
print(f"{'T':>6}   {'gain 0.08 penalty':>17}   {'share > 3.84':>12}   "
      f"{'b = 0.75 penalty':>16}")
for T in (500, 5_000, 50_000, 200_000):
    pen_gain, pen_b = [], []
    for seed in range(20):                    # average over 20 samples
        u = np.random.default_rng(seed).standard_normal(T)
        p, β = simulate_constant_gain(β_star, gain_true, u)
        pen_gain.append(ssr_ab_free(p, belief_path_cg(β_star, gain_wrong, p))
                        - ssr_ab_free(p, belief_path_cg(β_star, gain_true, p)))
        pen_b.append(ssr_a_free(p - 0.75 * β) - ssr_a_free(p - b * β))
    pen_gain = np.array(pen_gain)
    print(f"{T:>6}   {pen_gain.mean():17.2f}   {np.mean(pen_gain > 3.84):12.0%}   "
          f"{np.mean(pen_b):16.2f}")
     T   gain 0.08 penalty   share > 3.84   b = 0.75 penalty
   500               -0.09             0%               0.33
  5000                4.78            60%               1.47
 50000               83.60           100%              10.26
200000              349.95           100%              41.00
Both penalties now keep growing with the sample, and in the largest samples they grow in proportion to it: each roughly quadruples between 50,000 and 200,000 observations.
Contrast the slope penalty with \(a\) re-estimated under the \(1/t\) gain, which never got past a fraction of one.
Persistent belief motion supplies the identifying variation that a vanishing gain withholds.
The information per observation is small, though.
With 500 observations a gain of 0.08 cannot be told from 0.05: the average penalty is about zero and no sample rejects the wrong gain at the 5 percent level.
With 5,000 observations a majority of samples reject it, and with 50,000 all do.
The gain is identified at the usual rate, but weakly per observation; Exercise 96.4 shows how the information shrinks with the size of the gain, and Exercise 91.7 poses the same question for the Phillips-curve government of Adaptive Agents in an Overlapping Generations Monetary Economy.
Later work built on Chung’s foundation.
Sargent [1999] made a constant-gain government the center of an account of postwar U.S. inflation, and Sargent and Williams [2005] showed how the government’s prior about drifting coefficients, encoded in a drift covariance \(V\), shapes its learning dynamics (Priors, Escapes, and Learning Cycles).
Sargent et al. [2006] estimated a model in which the government runs a Kalman filter on drifting coefficients, the Sims–Chung specification, using postwar U.S. data to estimate the drift covariance \(V\) that sets its non-vanishing gain.
Primiceri [2006] estimated a model in which policy makers learn about the natural rate of unemployment and the persistence of inflation.
The estimates revived a version of the 1993 worry.
To fit the data, SWZ needed a large \(V\), and critics, including Sargent [2008] himself, objected that the implied beliefs were implausibly volatile (Priors, Escapes, and Learning Cycles).
The response was to bring in direct evidence on beliefs.
Survey data. Carboni and Ellison [2009] required the model’s beliefs to reproduce the forecasts in the Federal Reserve’s Greenbook, which shrank the estimated drift variance of the constant by a factor of about fifty while keeping the account of the rise and fall of inflation.
Cohorts. Malmendier and Nagel [2016] found that people’s inflation expectations in survey data weight the inflation they have lived through, with gains that decline with age.
In an economy of overlapping cohorts someone is always young, so the aggregate never finishes its transient, and parameters that would be transient for a single agent become parameters of the stationary distribution (Exercise 96.3).
Experiments. Laboratory experiments, which the book counted as a credit, offer a third route: there the experimenter knows the environment and observes choices, and sometimes forecasts, directly, as in Marimon and Sunder [1993] and Arifovic [1996].
The econometricians also adopted the agents’ apparatus outright.
Cogley and Sargent [2005], whom Drifts and Volatilities follows, fit a vector autoregression whose coefficients drift as random walks, the very specification Sims and Chung had handed their government, and asked whether the Great Inflation was bad policy or bad luck.
So the flattery did run both ways in the end.
The learning technology that made the models estimable was already present in Chung’s 1990 model.
What changed after 1993 was that a gain that never vanishes moved from exception to standard specification.
It was adopted largely for reasons of economics, since an agent who suspects that its world is changing should keep discounting old data, and it turned out to pay an econometric dividend.
96.7.4. A second retreat, made differently#
The program in this book keeps individual rationality and gives up mutual consistency: agents optimize, but against beliefs they are still estimating.
A parallel literature retreats along a different axis.
In the robustness work of Hansen and Sargent [Hansen and Sargent, 2008], agents share an approximating model with the econometrician, a model that can be estimated, but they distrust it.
They optimize against the worst case among nearby models that the data could not easily distinguish from it, and the size of that set can be calibrated with detection-error probabilities (Robust Permanent Income and Pricing).
Where bounded rationality changes the agents’ beliefs, robustness keeps a model common to agents and econometrician and changes the agents’ preferences, toward caution.
The two are complements rather than rivals, and both are answers to the question that opens A Peculiar Definition of Bounded Rationality: what do we do about the knowledge that rational expectations imputes?
One answer is that agents should learn what the econometrician is learning.
The other is that they should act well while doubting what they have learned.
A third answer, which the book set aside for lack of space, keeps rationality whole: Bayesian agents learning inside a rational expectations equilibrium, as in Rational Learning and Rational Expectations.
96.7.5. The algorithms kept crossing over#
The 1993 ledger noted that econometricians had adopted the adaptive algorithms as computational tools even while declining the models.
That traffic increased, and reversed direction again.
Holland’s bucket brigade (The bucket brigade) — pay part of your reward backward to whatever set you up — is a precursor of temporal-difference learning, which became an organizing idea of modern reinforcement learning [Sutton and Barto, 2018]; Job Search X: Search with Q-Learning applies temporal-difference learning to a McCall worker.
The resemblance runs deep enough to be useful: The bucket brigade’s discount factor reads the strengths of the bucket brigade in Money as a Medium of Exchange among Artificially Intelligent Agents as values computed with a very low discount factor, which helps explain Economy A2.
The classifier systems of Money as a Medium of Exchange among Artificially Intelligent Agents are recognizable, in retrospect, as reinforcement learners with a hand-built function approximator; and the perceptrons of Networks, Genetic Algorithms, and Classifier Systems are ancestors of the deep networks of Introduction to Artificial Neural Networks, which now serve as the function approximators.
Sargent said in 1993 that he would select the “brains” of his agents from the store of methods built up in statistics, econometrics, and artificial intelligence.
Those methods turned out to be early versions of what that last field went on to build.
96.7.6. Reading the ledger again#
The 1993 debits have not all been paid.
The choices remain many, the learning tasks we set our agents remain simple next to the ones real firms solve, and no one has produced the theory of transition dynamics that the Eastern European reforms called for.
But the entries have moved.
Selection’s theory, sketched in 1993, was systematized and its limits mapped; non-convergence acquired an analytical characterization instead of a simulation; and the econometricians, offered models whose gains never vanish, together with survey, cohort, and laboratory evidence on beliefs themselves, took them up.
The gap between the econometrician and the agents inside the model is still there.
It is narrower, and we now know a good deal about its width.
The next lecture, The Rise and Fall of U.S. Inflation, opens a suite built on The Conquest of American Inflation [Sargent, 1999], in which a government that keeps re-estimating its Phillips curve — the policy maker of Sims and Chung, grown up — is asked to explain the rise and fall of U.S. inflation.
96.8. Exercises#
Exercise 96.1
This exercise checks the E-stability account of the stability reversal in Adaptive Agents in an Overlapping Generations Monetary Economy numerically, and extends that lecture’s linearization (The stability reversal), which covers gains between 0 and 1, to find exactly how large the gain can be.
In the constant-deficit economy, a young agent who expects gross inflation \(\beta\) saves \(s(\beta) = (w_1 - w_2 \beta)/2\), and the government finances a real deficit \(G\) per young person by printing money.
If everyone expects the same constant \(\beta\), realized inflation is constant at
Use Marimon and Sunder’s Economy 7C, \(w_1 = 6\), \(w_2 = 1\), \(G = 1\).
Find the fixed points of \(T\) and compute \(T'\) at each, analytically and numerically. Which steady states are E-stable? Compare with the slopes of the perfect-foresight map \(g(\pi) = A_1 - A_2/\pi\), with \(A_1 = (w_1 + w_2 - 2G)/w_2\) and \(A_2 = w_1/w_2\), at the same points.
Replace least squares with Cagan’s adaptive expectations, \(\beta_{t+1} = \beta_t + \lambda(\pi_t - \beta_t)\), where realized inflation is \(\pi_t = s(\beta_{t-1})/(s(\beta_t) - G)\) and \(\beta_{-1} = \beta_0\). Simulate for \(\lambda \in \{0.1, 0.5, 1, 1.5\}\) from initial beliefs \(1.5, 2.5, 2.9, 2.99\) and \(3.01\), stopping if \(s(\beta_t) \le G\) (no positive price level). Where do the paths go?
Linearize the system in part 2 around each steady state and find, analytically, all the values of \(\lambda > 0\) for which it is locally stable. Compare with the condition \(|1 + \lambda(T' - 1)| < 1\) that a version of the recursion without the lag in realized inflation would give.
Solution
Here \(s(\beta) = (6 - \beta)/2\), so \(T(\beta) = (6 - \beta)/(4 - \beta)\).
Its fixed points solve \(\beta^2 - 5\beta + 6 = 0\), so they are \(\beta = 2\) and \(\beta = 3\), the two steady states, and \(T'(\beta) = 2/(4 - \beta)^2\) gives \(T'(2) = 1/2\) and \(T'(3) = 2\).
w1, w2, G = 6.0, 1.0, 1.0

def s(β):
    return (w1 - w2 * β) / 2

def T_map(β):
    return s(β) / (s(β) - G)

A1, A2 = (w1 + w2 - 2 * G) / w2, w1 / w2
steady_states = np.sort(np.roots([1, -A1, A2]).real)

h = 1e-6
for β in steady_states:
    T_prime = (T_map(β + h) - T_map(β - h)) / (2 * h)
    g_prime = A2 / β**2
    print(f"β = {β:.0f}:  T(β) = {T_map(β):.4f}   T'(β) = {T_prime:.4f}   "
          f"g'(β) = {g_prime:.4f}   E-stable: {T_prime < 1}")
β = 2:  T(β) = 2.0000   T'(β) = 0.5000   g'(β) = 1.5000   E-stable: True
β = 3:  T(β) = 3.0000   T'(β) = 2.0000   g'(β) = 0.6667   E-stable: False
Only the low-inflation steady state is E-stable.
Under perfect foresight the ranking is reversed: \(g'(2) = 3/2 > 1\) and \(g'(3) = 2/3 < 1\).
At both steady states \(T' - 1\) and \(g' - 1\) have opposite signs, which is the reversal; Exercise 91.6 proves that this holds for all parameters.
Now the adaptive-expectations version.
def adaptive_path(β0, lam, n=2000):
    "Cagan adaptive expectations with the timing of olg_adaptive_money."
    β_prev, β = β0, β0
    for t in range(n):
        if s(β) <= G:
            return β, False                          # no positive price level
        π = s(β_prev) / (s(β) - G)                   # realized inflation
        β_prev, β = β, β + lam * (π - β)
    return β, True

starts = (1.5, 2.5, 2.9, 2.99, 3.01)
print("λ      " + "".join(f"β0 = {β0:<9}" for β0 in starts))
for lam in (0.1, 0.5, 1.0, 1.5):
    cells = []
    for β0 in starts:
        β_end, alive = adaptive_path(β0, lam)
        cells.append(f"{β_end:.4f}" if alive else "collapse")
    print(f"{lam:<6} " + "".join(f"{c:<14}" for c in cells))
λ      β0 = 1.5      β0 = 2.5      β0 = 2.9      β0 = 2.99     β0 = 3.01
0.1    2.0000        2.0000        2.0000        2.0000        collapse
0.5    2.0000        2.0000        2.0000        2.0000        collapse
1.0    2.0000        2.0000        2.0000        2.0000        collapse
1.5    2.0000        2.0000        2.0000        2.0000        collapse
Every path that starts below 3 converges to the low-inflation steady state, and the path that starts just above 3 collapses: the reversal survives Cagan’s adaptive expectations, as Bruno and Fischer [1990] found.
For the linearization, write \(\delta_t = \beta_t - \beta^\star\).
Realized inflation responds to the current and lagged belief with coefficients \(c_0 = -s^\star s'/(s^\star - G)^2\) and \(c_1 = s'/(s^\star - G)\), where \(s' = -w_2/2\) and \(s^\star = s(\beta^\star)\), and \(c_0 + c_1 = T'(\beta^\star)\).
So \(\delta_{t+1} = (1 + \lambda(c_0 - 1))\,\delta_t + \lambda c_1\, \delta_{t-1}\).
def spectral_radius(β_ss, lam):
    "Largest root modulus of the linearized adaptive-expectations system."
    s_ss, s_prime = s(β_ss), -w2 / 2
    c0 = -s_ss * s_prime / (s_ss - G)**2
    c1 = s_prime / (s_ss - G)
    A = np.array([[1 + lam * (c0 - 1), lam * c1],
                  [1.0, 0.0]])
    return np.max(np.abs(np.linalg.eigvals(A)))

for β_ss in steady_states:
    radii = [spectral_radius(β_ss, lam) for lam in (0.5, 1.0, 1.9, 2.0, 2.1)]
    print(f"β* = {β_ss:.0f}: spectral radius at λ = 0.5, 1, 1.9, 2, 2.1:",
          np.round(radii, 3))
β* = 2: spectral radius at λ = 0.5, 1, 1.9, 2, 2.1: [0.5   0.707 0.975 1.    1.025]
β* = 3: spectral radius at λ = 0.5, 1, 1.9, 2, 2.1: [1.707 2.618 4.365 4.562 4.759]
At \(\beta^\star = 2\), \(c_0 = 1\) and \(c_1 = -1/2\), so the characteristic polynomial is \(z^2 - z + \lambda/2\); the product of its roots is \(\lambda/2\), and the system is stable exactly when \(0 < \lambda < 2\).
At \(\beta^\star = 3\), \(c_0 = 3\) and \(c_1 = -1\), so the polynomial is \(z^2 - (1 + 2\lambda) z + \lambda\), which is negative at \(z = 1\); there is always a root above one, and the high steady state is unstable for every \(\lambda > 0\).
Without the lag the multiplier would be \(1 + \lambda(T' - 1)\): \(1 - \lambda/2\) at the low steady state, stable for \(\lambda < 4\), and \(1 + \lambda\) at the high one, never stable.
The lag in realized inflation halves the admissible range of \(\lambda\) but does not touch the ranking, which is fixed by the sign of \(T' - 1\).
The admissible range includes every gain in \((0, 1]\), and so the effective gain of about 0.75 at which least squares operates near the low steady state (The stability reversal).
For small \(\lambda\) any rule that moves beliefs gradually toward realized inflation inherits the E-stability condition \(T' < 1\), which is the logic of One recursion, many learners; here the condition survives gains far from small.
Exercise 96.2
This exercise asks when initial beliefs can be identified under multiplicity.
Set \(a = 0\) and \(b = 1\) in Bray’s market.
Then every constant belief is self-fulfilling: \(T(\beta) = \beta\), so \(T' = 1\), the unit eigenvalue of the indeterminate direction in Exchange Rate Indeterminacy, Learning, and Experiments.
Keep the gain \(1/(t + t_0)\) with \(t_0 = 50\).
Simulate the learning economy for 20,000 periods from \(\beta_0 \in \{5, 10, 15\}\), with five shock sequences each, and report the final beliefs. Do the same for \(a = 5\), \(b = 0.7\).
Make the economy deterministic, like the economies of Adaptive Agents in an Overlapping Generations Monetary Economy and Exchange Rate Indeterminacy, Learning, and Experiments: agents see \(p_t = a + b\beta_t\), and the econometrician, who knows \(a\), \(b\) and \(t_0\), observes \(y_t = p_t + e_t\) with \(e_t\) IID standard normal. Compute the expected penalty for \(\beta_0 = 12\) when the truth is \(\beta_0 = 10\), for \(T = 10^2, 10^3, 10^4, 10^5\), and for \(b = 0.3\) and \(b = 0.7\) (with \(a = 5\)) and \(b = 1\) (with \(a = 0\)). Hint: the expected penalty is \(\sum_t d_t^2\), where \(d_t\) is the difference between the two implied price paths. Explain the three growth rates.
Return to Bray’s setting, where the shock \(u_t\) enters the market and moves beliefs, and the econometrician observes \(p_t\). Compute the average penalty for \(\beta_0 = 12\) against the truth \(\beta_0 = 10\) for \(b = 0.7\) (with \(a = 5\)) and \(b = 1\) (with \(a = 0\)), for \(T = 10^2, 10^3, 10^4\). Why is it bounded even when \(b = 1\), where \(\beta_0\) shifts the limit permanently?
Solution
We need a version of the economy and of the belief reconstruction that takes \((a, b)\) as arguments.
t0_ex = 50

def bray(a_, b_, β0, u):
    "Bray's market with gain 1/(t + t0) and shocks u that move beliefs."
    T = len(u)
    β, p = np.empty(T), np.empty(T)
    β[0] = β0
    for t in range(T):
        p[t] = a_ + b_ * β[t] + u[t]
        if t + 1 < T:
            β[t + 1] = β[t] + (p[t] - β[t]) / (t + 1 + t0_ex)
    return p, β

print("final beliefs after 20,000 periods, five shock sequences each")
for a_, b_ in ((0.0, 1.0), (5.0, 0.7)):
    for β0 in (5.0, 10.0, 15.0):
        finals = [bray(a_, b_, β0, np.random.default_rng(seed).standard_normal(20_000))[1][-1]
                  for seed in range(5)]
        print(f"a = {a_}, b = {b_}, β0 = {β0:4.1f}:", np.round(finals, 2))
final beliefs after 20,000 periods, five shock sequences each
a = 0.0, b = 1.0, β0 =  5.0: [4.97 4.82 4.93 5.08 5.05]
a = 0.0, b = 1.0, β0 = 10.0: [ 9.97  9.82  9.93 10.08 10.05]
a = 0.0, b = 1.0, β0 = 15.0: [14.97 14.82 14.93 15.08 15.05]
a = 5.0, b = 0.7, β0 =  5.0: [14.72 14.67 14.72 14.76 14.76]
a = 5.0, b = 0.7, β0 = 10.0: [15.55 15.5  15.55 15.59 15.59]
a = 5.0, b = 0.7, β0 = 15.0: [16.38 16.33 16.38 16.42 16.42]
With \(b = 1\) the limit stays close to where the economy started, and it also differs across shock sequences: the outcome is path dependent, in the sense of the book’s footnote on the exchange-rate model, which Exercise 93.5 demonstrates in that economy.
With \(b = 0.7\) every economy heads toward \(\beta^\star = 16.67\), slowly, whatever \(\beta_0\).
For part 2 the economy is deterministic, so the expected penalty can be computed without simulating the measurement errors.
def deterministic_prices(a_, b_, β0, T):
    "Prices in Bray's market with no shocks in the market itself."
    β, p = β0, np.empty(T)
    for t in range(T):
        p[t] = a_ + b_ * β
        β = β + (p[t] - β) / (t + 1 + t0_ex)
    return p

Ts = (100, 1_000, 10_000, 100_000)
for a_, b_ in ((5.0, 0.3), (5.0, 0.7), (0.0, 1.0)):
    d = deterministic_prices(a_, b_, 12.0, Ts[-1]) - deterministic_prices(a_, b_, 10.0, Ts[-1])
    expected = [np.sum(d[:T] ** 2) for T in Ts]
    print(f"b = {b_}: expected penalty at T = 1e2, 1e3, 1e4, 1e5:", np.round(expected, 1))
b = 0.3: expected penalty at T = 1e2, 1e3, 1e4, 1e5: [16.2 31.9 39.9 43.2]
b = 0.7: expected penalty at T = 1e2, 1e3, 1e4, 1e5: [ 135.9  585.7 1806.7 4900.5]
b = 1.0: expected penalty at T = 1e2, 1e3, 1e4, 1e5: [   400.   4000.  40000. 400000.]
In the deterministic economy, the effect of \(\beta_0\) on the price at \(t\) decays like \((t_0/(t + t_0))^{1-b}\), so the expected penalty is roughly a sum of terms of order \(t^{-2(1-b)}\).
With \(b = 0.3\) that sum converges, and the penalty levels off: the effect dies too fast to be measured well.
With \(b = 0.7\) the effect dies slowly, and the penalty keeps growing, but far more slowly than \(T\) (eventually like \(T^{2b-1} = T^{0.4}\)).
With \(b = 1\) the effect never dies: the price stays at \(\beta_0\) forever, and the penalty is exactly \((12 - 10)^2 T = 4T\).
Here the multiplicity makes the initial belief permanent, and the data identify it at the usual rate, as they would a structural parameter.
Now part 3, with shocks that move beliefs.
def reconstructed_beliefs(β0, p):
    "Beliefs the econometrician reconstructs from observed prices and a candidate β0."
    T = len(p)
    β = np.empty(T)
    β[0] = β0
    for t in range(1, T):
        β[t] = β[t - 1] + (p[t - 1] - β[t - 1]) / (t + t0_ex)
    return β

for a_, b_ in ((5.0, 0.7), (0.0, 1.0)):
    rows = []
    for T in (100, 1_000, 10_000):
        pens = []
        for seed in range(20):
            p, _ = bray(a_, b_, 10.0, np.random.default_rng(seed).standard_normal(T))
            resid_wrong = p - a_ - b_ * reconstructed_beliefs(12.0, p)
            resid_true = p - a_ - b_ * reconstructed_beliefs(10.0, p)
            pens.append(np.sum(resid_wrong**2) - np.sum(resid_true**2))
        rows.append(np.mean(pens))
    print(f"b = {b_}: average penalty at T = 1e2, 1e3, 1e4:", np.round(rows, 1))
b = 0.7: average penalty at T = 1e2, 1e3, 1e4: [ 70.2 101.1 103.8]
b = 1.0: average penalty at T = 1e2, 1e3, 1e4: [140.8 202.1 208.6]
The penalty is bounded in both cases.
With gain \(1/(t + t_0)\) the reconstructed belief is \(\beta_t = (t_0 \beta_0 + \sum_{s<t} p_s)/(t + t_0)\), so a wrong \(\beta_0\) shifts it by \((\beta_0' - \beta_0)\, t_0/(t + t_0)\), whatever \(b\) is.
The expected penalty is therefore about \(b^2 (\beta_0' - \beta_0)^2 t_0\), which is close to \(0.49 \times 4 \times 50 = 98\) for \(b = 0.7\) and \(4 \times 50 = 200\) for \(b = 1\).
When \(b = 1\), \(\beta_0\) does shift the limit permanently, but so do the early shocks, and the observed prices tell the econometrician where the economy is without telling him how much of its position is due to the initial belief.
Permanence is necessary for identification at the usual rate, but not sufficient: the initial belief must leave a mark that the econometrician cannot attribute to anything he observes.
Exercise 96.3
Malmendier and Nagel [2016] find that people form inflation expectations from the inflation they have lived through, with gains that decline with age.
Put such cohorts into Bray’s market with \(a = 5\) and \(b = 0.7\).
At each date \(L = 40\) cohorts are alive; a cohort of age \(k = 0, 1, \ldots, L - 1\) updates its belief with gain \(1/(k + 1 + t_0)\) with \(t_0 = 5\); each newborn cohort starts from the prior \(\beta_0 = 10\); and the market expectation is the average belief across living cohorts.
Simulate 50,000 periods and compare the average price after the first 1,000 periods with \(\beta^\star = a/(1 - b)\). Why does the economy never reach the rational expectations equilibrium?
An econometrician knows \(b\), \(\beta_0\) and the cohort structure, and re-estimates \(a\). Compute the penalty for \(t_0 = 10\) when the truth is \(t_0 = 5\), for \(T = 500, 5000, 50000\), averaged over 8 samples. Do the same for a single, infinitely lived learner with gain \(1/(t + 1 + t_0)\), the same \(\beta_0\) and the same \(t_0\).
Explain the difference, and relate it to the postscript.
Solution
We carry the cohorts’ beliefs in an array ordered by age; each period the oldest cohort dies and a newborn enters at the prior.
L = 40

def cohort_beliefs(β0, t0_c, p):
    "Average belief of the living cohorts implied by an observed price path."
    gains = 1 / (np.arange(L) + 1 + t0_c)
    B = np.full(L, β0)
    β_bar = np.empty(len(p))
    for t in range(len(p)):
        β_bar[t] = B.mean()
        B = B + gains * (p[t] - B)
        B[1:] = B[:-1].copy()                   # everyone ages; the oldest dies
        B[0] = β0                               # a newborn enters at the prior
    return β_bar

def cohort_economy(β0, t0_c, u):
    "Bray's market when the expectation is the average over overlapping cohorts."
    gains = 1 / (np.arange(L) + 1 + t0_c)
    B = np.full(L, β0)
    p = np.empty(len(u))
    for t in range(len(u)):
        p[t] = a + b * B.mean() + u[t]
        B = B + gains * (p[t] - B)
        B[1:] = B[:-1].copy()
        B[0] = β0
    return p

def single_beliefs(β0, t0_c, p):
    "A single infinitely lived learner with gain 1/(t + 1 + t0)."
    β = np.empty(len(p))
    β[0] = β0
    for t in range(1, len(p)):
        β[t] = β[t - 1] + (p[t - 1] - β[t - 1]) / (t + t0_c)
    return β

def single_economy(β0, t0_c, u):
    p = np.empty(len(u))
    β = β0
    for t in range(len(u)):
        p[t] = a + b * β + u[t]
        β = β + (p[t] - β) / (t + 1 + t0_c)
    return p

def penalty_a_free(p, β_wrong, β_true, Ts):
    "Excess SSR (intercept re-estimated) on the first T observations, for each T."
    r_w, r_t = p - b * β_wrong, p - b * β_true
    return np.array([ssr_a_free(r_w[:T]) - ssr_a_free(r_t[:T]) for T in Ts])

Ts = (500, 5_000, 20_000, 50_000)
pen_cohort, pen_single, mean_price = [], [], []
for seed in range(8):
    u = np.random.default_rng(seed).standard_normal(Ts[-1])
    p = cohort_economy(10.0, 5.0, u)
    mean_price.append(p[1_000:].mean())
    pen_cohort.append(penalty_a_free(p, cohort_beliefs(10.0, 10.0, p),
                                     cohort_beliefs(10.0, 5.0, p), Ts))
    p = single_economy(10.0, 5.0, u)
    pen_single.append(penalty_a_free(p, single_beliefs(10.0, 10.0, p),
                                     single_beliefs(10.0, 5.0, p), Ts))

print(f"cohort economy: average price {np.mean(mean_price):.2f}, β* = {β_star:.2f}")
print("penalty for t0 = 10, at T = 500, 5000, 20000, 50000")
print("   cohorts:      ", np.round(np.mean(pen_cohort, axis=0), 2))
print("   single agent: ", np.round(np.mean(pen_single, axis=0), 2))
cohort economy: average price 14.00, β* = 16.67
penalty for t0 = 10, at T = 500, 5000, 20000, 50000
   cohorts:       [ 1.99  6.11 19.42 41.23]
   single agent:  [1.22 1.57 2.76 3.52]
The cohort economy’s average price stays well below \(\beta^\star\).
Every period a newborn cohort arrives believing \(\beta_0 = 10\), and the young weight their own short experience heavily, so the average belief is permanently pulled toward the prior: the transient never ends in the aggregate.
The penalty for a wrong \(t_0\) stays bounded for the single learner, whose \(t_0\) matters only while its belief is young: the reconstructed belief is \((t_0 \beta_0 + \sum_{s<t} p_s)/(t + t_0)\), so \(t_0\)’s influence on it dies out like \(1/t\).
In the cohort economy the penalty keeps growing, roughly in proportion to \(T\) beyond a few thousand observations, even though re-estimating \(a\) absorbs the permanent shift in the mean.
The information comes from the dynamics: \(t_0\) governs how strongly the young respond to recent prices, and there are always young cohorts responding.
This is the identification route that Malmendier and Nagel [2016] took with survey data on the expectations of different cohorts: in an economy of overlapping generations, parameters that would be transient for one agent become parameters of the stationary distribution.
Exercise 96.4
The constant-gain demonstration in the postscript showed that a gain is identified at the usual rate, but weakly per observation.
This exercise asks how the information depends on the size of the gain.
Use Bray’s market with \(a = 5\), \(b = 0.7\), initial belief \(\beta^\star\), and constant gain \(g\).
For \(g \in \{0.005, 0.01, 0.02, 0.05, 0.1, 0.2\}\), with \(a\) and \(b\) re-estimated, compute the penalty for the wrong gain \(1.6 g\) at \(T = 20{,}000\), averaged over 20 samples, and divide it by \(T\). How does the information per observation depend on \(g\)?
At \(T = 200\), roughly the length of the postwar record in quarterly data, in what share of the samples does the penalty exceed 3.84?
What do the answers imply for the \(1/t\) learner, and for the debate over the large drift covariance estimated by Sargent et al. [2006]?
Solution
We reuse simulate_constant_gain, belief_path_cg and ssr_ab_free from the postscript.
print(f"{'g':>6}   {'penalty / T, T = 20000':>22}   {'share > 3.84, T = 20000':>23}   "
      f"{'share > 3.84, T = 200':>21}")
for g in (0.005, 0.01, 0.02, 0.05, 0.1, 0.2):
    results = {}
    for T in (200, 20_000):
        pens = []
        for seed in range(20):
            u = np.random.default_rng(seed).standard_normal(T)
            p, β = simulate_constant_gain(β_star, g, u)
            pens.append(ssr_ab_free(p, belief_path_cg(β_star, 1.6 * g, p))
                        - ssr_ab_free(p, β))
        results[T] = np.array(pens)
    big = results[20_000]
    print(f"{g:>6}   {big.mean() / 20_000:22.5f}   {np.mean(big > 3.84):23.0%}   "
          f"{np.mean(results[200] > 3.84):21.0%}")
     g   penalty / T, T = 20000   share > 3.84, T = 20000   share > 3.84, T = 200
 0.005                  0.00010                       25%                      0%
  0.01                  0.00025                       55%                      0%
  0.02                  0.00052                       70%                      0%
  0.05                  0.00152                       95%                      0%
   0.1                  0.00357                      100%                      0%
   0.2                  0.00839                      100%                     10%
The information per observation rises with the gain, roughly in proportion to it or a little faster.
The identifying variation is the motion of beliefs, and for small gains the stationary variance of beliefs around \(\beta^\star\) is roughly proportional to the gain.
With 20,000 observations the wrong value of the largest gains is rejected in every sample, while that of the smallest is rejected in only a quarter of them; with 200 observations the data say almost nothing about any of the gains.
As \(g \to 0\) the constant-gain learner approaches the \(1/t\) learner, whose belief motion dies out and whose learning parameters are not consistently estimable: the two cases are the ends of a continuum.
In a sample as short as the postwar record, the data are informative about learning only when beliefs move a lot.
That is one way to read the large drift covariance that Sargent et al. [2006] estimated, and the objection that the implied beliefs were implausibly volatile.
Direct evidence on beliefs, such as the Greenbook forecasts that Carboni and Ellison [2009] used, supplies information that outcome data of that length cannot.