102. Self-Confirming Equilibria#
In addition to what’s in Anaconda, this lecture will use the following library:
!pip install quantecon
102.1. Overview#
This lecture completes the equilibrium half of the study begun in The Credibility Problem.
It follows chapter 7 of Sargent [1999], after which the suite turns from fixed beliefs to beliefs that are learned in real time.
We seek models that depart minimally from the basic Kydland and Prescott [1977] model of The Credibility Problem but that also let a government’s beliefs be shaped by the data its own policies generate.
The key equilibrium concept is a self-confirming equilibrium: the government has a possibly wrong model of the Phillips curve, but it fits that model to the data by least squares, and the data it observes confirm its beliefs.
Fudenberg and Levine [1993] use the term self-confirming equilibrium for a related idea in game theory.
We combine ideas from two literatures:
King and Watson [1994] document how inferences about the Phillips curve depend on the direction of fit — whether one regresses unemployment on inflation (a classical identification) or inflation on unemployment (a Keynesian identification).
A literature going back to Muth, Lucas, and Prescott [Lucas and Prescott, 1971, Muth, 1961], and exploited by Marcet and Sargent [1989] and Evans and Honkapohja [2001], formulates rational expectations equilibria as fixed points of mappings from beliefs to the population moments of statistical models; Rational Expectations Equilibrium describes the fixed-point view.
We build two self-confirming equilibria that are identical except for the direction of fit, and we find that the direction of minimization affects outcomes.
Both equilibria are unique and E-stable.
We then study an equilibrium with misspecified beliefs, combining the Phelps problem of Adaptive Expectations and the Phelps Problem with the optimal-misspecification machinery of Optimal Misspecified Beliefs.
It delivers outcomes better than Nash, approaching Ramsey as the government becomes patient, provided that the public’s perceived model keeps the root \(\rho\) of Optimal Misspecified Beliefs strictly below one.
In the self-confirming equilibria only the government’s model is wrong; in the equilibrium with misspecified beliefs only the public’s is.
Let’s import what we need:
import matplotlib.pyplot as plt
import numpy as np
import quantecon as qe
from scipy.optimize import minimize_scalar
102.2. Objects in the Phelps problem#
Recall from Adaptive Expectations and the Phelps Problem the ingredients of the general Phelps problem.
The government believes in a reduced-form Phillips curve that it can fit in either direction:
where \(X_{t-1}\) collects lagged \(U\)’s, lagged \(y\)’s, and a constant.
We partition \(\gamma = \begin{bmatrix} \gamma_1 & \gamma_{-1}^\top \end{bmatrix}^\top\), where \(\gamma_1\) is the coefficient on \(y_t\) and \(\gamma_{-1}\) collects the coefficients on \(X_{t-1}\), and partition \(\beta\) the same way.
Solving the Phelps problem takes the government’s beliefs \(\gamma\) as given and delivers a decision rule \(h(\gamma)\) for inflation, \(\hat y_t = h(\gamma) X_{t-1}\).
The two parameterizations are related by the inversion formulas
102.3. The actual Phillips curve#
The actual Phillips curve extends the one used in earlier lectures to allow for serially correlated shocks:
with \(|\rho_1| < 1\) and \(|\rho_2| < 1\).
Here \(v_t = (v_{1t}, v_{2t})^\top\) is a vector white noise with a diagonal covariance matrix: the Phillips curve shock \(v_{1t}\), with variance \(\sigma_1^2\), is uncorrelated with the surprise in inflation \(v_{2t} \equiv y_t - x_t\), with variance \(\sigma_2^2\).
For much of this lecture we set \(\rho_1 = \rho_2 = 0\) to make theoretical points, which reduces (102.2) to
102.4. Self-confirming equilibria#
A self-confirming equilibrium reconciles the government’s beliefs with the environment those beliefs generate.
Definition 102.1 (Self-confirming equilibrium)
A self-confirming equilibrium is a fixed belief vector \(\gamma\), a government decision rule \(h = h(\gamma)\), and a stationary process for \((y_t, U_t, x_t)\) such that
(a) inflation solves the Phelps problem, \(y_t = h X_{t-1} + v_{2t}\);
(b) the public optimally forecasts inflation, \(x_t = h X_{t-1}\);
© unemployment is generated by the actual Phillips curve (102.2); and
(d) the government’s beliefs satisfy the least squares orthogonality conditions \(\mathbb{E}\left[\left(U_t - \gamma^\top X_{C,t}\right) X_{C,t}^\top\right] = 0\) (the classical direction of fit).
Condition (d) makes the government’s beliefs depend on moment matrices that, through (a)–©, themselves depend on the government’s beliefs.
The government’s beliefs imply behavior that produces data whose moments confirm those beliefs.
A distinct self-confirming equilibrium results from replacing (d) with the Keynesian direction of fit:
(d′) the government fits the Keynesian Phillips curve, \(\mathbb{E}\left[\left(y_t - \beta^\top X_{K,t}\right) X_{K,t}^\top\right] = 0\), then recovers \(\gamma\) from the inversion formulas (102.1).
Because the government’s beliefs affect the whole probability distribution of the data, the direction of minimization affects outcomes.
Note
Computing a self-confirming equilibrium in general means finding a fixed point of a map \(\gamma = T(h(\gamma))\) (classical) or \(\beta = S(h(\gamma(\beta)))\) (Keynesian).
The moments in the orthogonality conditions are obtained from the state-space representation of the system by solving a discrete Lyapunov equation.
In practice one iterates a relaxation algorithm \(\beta_{j+1} = \kappa\beta_j + (1-\kappa) S(\beta_j)\), the damped iteration of A Peculiar Definition of Bounded Rationality, which resembles the least squares learning recursion of The Credibility Problem; Uniqueness and E-stability uses it.
102.5. The special case solved by hand#
When \(\rho_1 = \rho_2 = 0\), the government’s problem collapses to a sequence of static problems, and each self-confirming equilibrium can be computed by hand.
We take \(X_{t-1} = 1\), so the government believes \(U_t = \gamma_{-1} + \gamma_1 y_t + \varepsilon_{C,t}\); Uniqueness and E-stability shows that adding lags of \(U\) and \(y\) to \(X_{t-1}\) changes nothing.
Minimizing \(\mathbb{E}\left[U_t^2 + y_t^2\right]\) under this belief gives the static Phelps rule
The actual Phillips curve and the diagonal covariance matrix of \(v_t\) imply the second moments
Classical direction of fit (\(U\) on \(y\)): the slope is
Mean unemployment is \(U^*\) and mean inflation is \(\bar x = h(\gamma)\), and the requirement that the means lie on the regression line, \(U^* = \gamma_{-1} + \gamma_1 \bar x\), gives the intercept \(\gamma_{-1} = (\gamma_1^2 + 1) U^*\).
Keynesian direction of fit (\(y\) on \(U\)): the slope is
with intercept \(\beta_{-1} = -\frac{\beta_1^2 + 1}{\beta_1} U^*\), from which the implied classical coefficients follow by inversion, \(\gamma_1 = \beta_1^{-1}\) and \(\gamma_{-1} = \frac{\beta_1^2 + 1}{\beta_1^2} U^*\).
class SelfConfirmingStatic:
    """
    The two static self-confirming equilibria (ρ1 = ρ2 = 0), one for
    each direction of fit.  γ1 is the slope; γ_int is the intercept γ_{-1}.
    """

    def __init__(self, θ=1.0, U_star=5.0, σ1=0.3, σ2=0.3):
        self.θ, self.U_star, self.σ1, self.σ2 = θ, U_star, σ1, σ2

    def classical(self):
        "Perceived Phillips curve U = γ_{-1} + γ_1 y under classical fit."
        θ, U_star = self.θ, self.U_star
        γ1 = -θ
        γ_int = (γ1**2 + 1) * U_star
        y_bar = -γ_int * γ1 / (γ1**2 + 1)      # mean (= Nash) inflation
        return γ1, γ_int, y_bar

    def keynesian(self):
        "Perceived Phillips curve under Keynesian fit, inverted to γ."
        θ, U_star, σ1, σ2 = self.θ, self.U_star, self.σ1, self.σ2
        β1 = -θ * σ2**2 / (σ1**2 + θ**2 * σ2**2)
        β_int = -(β1**2 + 1) / β1 * U_star
        γ1 = 1 / β1
        γ_int = (β1**2 + 1) / β1**2 * U_star
        y_bar = β_int / (β1**2 + 1)             # mean inflation
        return γ1, γ_int, y_bar
We compute both equilibria for the parameters of chapter 7 of Sargent [1999].
sce = SelfConfirmingStatic(θ=1.0, U_star=5.0, σ1=0.3, σ2=0.3)

γ1_C, γ0_C, y_C = sce.classical()
γ1_K, γ0_K, y_K = sce.keynesian()

print("Classical direction of fit")
print(f"  γ_1 = {γ1_C:.1f},  γ_(-1) = {γ0_C:.1f},  mean inflation = {y_C:.1f}")
print("Keynesian direction of fit")
print(f"  γ_1 = {γ1_K:.1f},  γ_(-1) = {γ0_K:.1f},  mean inflation = {y_K:.1f}")
Classical direction of fit
  γ_1 = -1.0,  γ_(-1) = 10.0,  mean inflation = 5.0
Keynesian direction of fit
  γ_1 = -2.0,  γ_(-1) = 25.0,  mean inflation = 10.0
These reproduce the numerical example of chapter 7 of Sargent [1999].
Under the classical direction of fit, mean inflation is the Nash value \(\theta U^* = 5\).
Under the Keynesian direction of fit, the government estimates a flatter Phillips curve and believes the tradeoff is more favorable than it is.
Its mean inflation is
which exceeds the Nash rate whenever \(\sigma_1 > 0\).
With \(\sigma_1 = \theta \sigma_2\), as here, it is twice the Nash rate, \(10\).
Let’s draw the two self-confirming Phillips curves, reproducing Figure 7.1.
fig, ax = plt.subplots(figsize=(7, 6))

U_grid = np.linspace(0, 12, 100)

# perceived Phillips curves U = γ_{-1} + γ_1 y  =>  y = (U - γ_{-1}) / γ_1
ax.plot(U_grid, (U_grid - γ0_C) / γ1_C, 'C0', label='P: classical fit', lw=2)
ax.plot(U_grid, (U_grid - γ0_K) / γ1_K, 'C1', label='Q: Keynesian fit', lw=2)

ax.plot(sce.U_star, y_C, 'C0o')
ax.annotate('Nash', (sce.U_star, y_C), (sce.U_star + 0.4, y_C - 0.6))
ax.plot(sce.U_star, y_K, 'C1o')
ax.annotate('Keynesian mean', (sce.U_star, y_K),
            (sce.U_star + 0.4, y_K + 0.2))

ax.set_xlim(0, 12)
ax.set_ylim(0, 12)
ax.set_xlabel('unemployment $U$')
ax.set_ylabel('inflation $y$')
ax.legend()
plt.show()
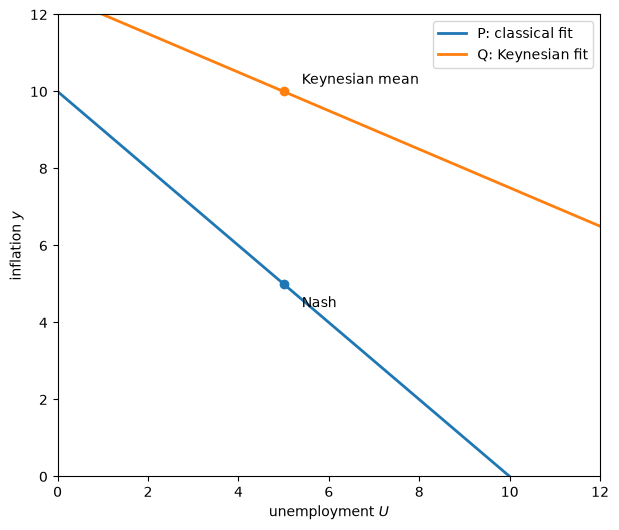
Fig. 102.1 The two self-confirming Phillips curves, one for each direction of fit#
Curve P is the self-confirming Phillips curve estimated with the classical direction of fit; curve Q with the Keynesian direction.
Because the Keynesian fit makes the government believe the tradeoff is more exploitable, average inflation is higher.
102.5.1. Why the classical equilibrium is Nash#
The classical self-confirming equilibrium reproduces the Nash outcome of The Credibility Problem for a simple reason.
Its perceived intercept is \(\gamma_{-1} = (1 + \theta^2) U^* = U^* + \theta \bar x\), with \(\bar x = \theta U^*\).
So the perceived curve \(U_t = U^* + \theta \bar x - \theta y_t\) is the true Phillips curve evaluated at \(x_t = \bar x\).
The government’s model is right about everything it sees in equilibrium.
Its only mistake is to treat \(\bar x\) as invariant to its own rule, which is exactly the assumption that defines the Nash government, which takes the public’s expectations as given.
That is why the time-consistent, or “consistent”, equilibrium of Kydland and Prescott [1977] is a self-confirming equilibrium (A government learning the Phillips curve).
Readers of Kalai and Lehrer [1993] might have foreseen this.
Learning converges to the truth when decision makers’ probability models encompass the Nash equilibrium, and the classical identification scheme satisfies that encompassing condition.
The Keynesian scheme does not: it gives the government a mistaken interpretation of the contemporaneous covariance between innovations to inflation and unemployment, and that worsens outcomes relative to Nash.
Both conclusions rest on the orthogonality conditions in the actual Phillips curve: \(v_{1t}\) is uncorrelated with \(v_{2t}\), and \(v_{2t}\) is orthogonal to \(\hat y_t\).
Different orthogonality conditions would change the quality of the outcomes in both equilibria, which is how, though our model of the government differs from theirs, we join King and Watson’s inquiry.
102.5.2. Why not Ramsey?#
Both self-confirming equilibria give a mean outcome worse than the Ramsey outcome.
This signifies a breakdown of the hypotheses of the proposition in Adaptive Expectations and the Phelps Problem that solving the Phelps problem eventually sustains nearly the Ramsey outcome.
What fails is the induction hypothesis.
Because \(\rho_1 = \rho_2 = 0\), the self-confirming equilibria are serially uncorrelated, so lagged inflation drops out of the empirical Phillips curves.
Deactivating the induction hypothesis makes the government in effect solve a one-period problem and shuts down the intertemporal channel that promotes better outcomes.
The two equilibria illustrate the assertion of Lucas [1972] and Sargent [1971], discussed in Testing the natural-rate hypothesis, that rational expectations and the natural-rate hypothesis do not imply the induction hypothesis: both hold here, and the induction hypothesis fails.
102.6. Uniqueness and E-stability#
Two properties of these equilibria matter for the lectures that follow: each is unique, and each is E-stable, so that least squares learning can converge to it.
Both are easy to establish in the static case.
Uniqueness. In the classical fit, the slope \(T_1 = \operatorname{cov}(U_t, y_t)/\mathbb{V}[y_t] = -\theta\) comes from moments (102.4) that do not depend on policy: the government’s beliefs move the mean of inflation, but not its variance or its covariance with unemployment.
Given the slope, the intercept must satisfy
a linear equation with slope \(\theta^2/(1 + \theta^2) < 1\), and so with a unique solution.
The Keynesian case is the same, with slope \(1/(1 + \beta_1^2)\) in the equation for the intercept.
E-stability. Write the classical equilibrium as a fixed point \(\gamma = T(\gamma)\) of the map from beliefs to the population regression coefficients they generate.
The associated differential equation \(d\gamma/d\tau = T(\gamma) - \gamma\) is the E-stability condition of One recursion, many learners, and Least Squares Learning in Self-Referential Models shows that its stability governs whether least squares learning converges.
Because \(T_1\) does not depend on beliefs, the Jacobian of \(T - I\) at the equilibrium is triangular, with eigenvalues \(-1\) (slope) and \(\theta^2/(1 + \theta^2) - 1 = -1/(1 + \theta^2)\) (intercept).
For the Keynesian fit \(\beta = S(\beta)\), the eigenvalues are \(-1\) and \(1/(1 + \beta_1^2) - 1 = -\beta_1^2/(1 + \beta_1^2)\).
Let’s confirm these by differentiating the two maps numerically.
def T_classical(γ, θ=1.0, U_star=5.0):
    "Static classical T-map: beliefs (γ_1, γ_{-1}) ↦ regression of U on (y, 1)."
    γ1, γ_int = γ
    y_hat = -γ1 * γ_int / (1 + γ1**2)
    return np.array([-θ, U_star + θ * y_hat])

def S_keynesian(β, θ=1.0, U_star=5.0, σ1=0.3, σ2=0.3):
    "Static Keynesian S-map: beliefs (β_1, β_{-1}) ↦ regression of y on (U, 1)."
    β1, β_int = β
    y_hat = β_int / (1 + β1**2)
    slope = -θ * σ2**2 / (σ1**2 + θ**2 * σ2**2)
    return np.array([slope, y_hat - slope * U_star])

def jacobian(f, x, ε=1e-6):
    "Central-difference Jacobian of f at x."
    J = np.empty((len(x), len(x)))
    for j in range(len(x)):
        dx = np.zeros(len(x))
        dx[j] = ε
        J[:, j] = (f(x + dx) - f(x - dx)) / (2 * ε)
    return J

for θ in [0.5, 1.0, 2.0]:
    γ_sce = np.array([-θ, (1 + θ**2) * 5.0])
    eig = np.linalg.eigvals(jacobian(lambda g: T_classical(g, θ), γ_sce) - np.eye(2))
    print(f"classical, θ = {θ}:  eigenvalues {np.sort(eig).round(4)},"
          f"  -1/(1+θ²) = {-1 / (1 + θ**2):.4f}")

β1 = -0.3**2 / (0.3**2 + 0.3**2)
β_sce = np.array([β1, -(β1**2 + 1) / β1 * 5.0])
eig = np.linalg.eigvals(jacobian(S_keynesian, β_sce) - np.eye(2))
print(f"Keynesian, θ = 1:  eigenvalues {np.sort(eig).round(4)},"
      f"  -β1²/(1+β1²) = {-β1**2 / (1 + β1**2):.4f}")
classical, θ = 0.5:  eigenvalues [-1.  -0.8],  -1/(1+θ²) = -0.8000
classical, θ = 1.0:  eigenvalues [-1.  -0.5],  -1/(1+θ²) = -0.5000
classical, θ = 2.0:  eigenvalues [-1.  -0.2],  -1/(1+θ²) = -0.2000
Keynesian, θ = 1:  eigenvalues [-1.  -0.2],  -β1²/(1+β1²) = -0.2000
Both equilibria are E-stable.
The classical eigenvalue \(-1/(1 + \theta^2)\) is the slope \(\mathcal{M}\) of the mean dynamics in Least squares learning converges to Nash, where the public learned expected inflation by least squares.
At the suite’s \(\theta = 1\) it equals \(-1/2\), exactly the boundary below which decreasing-gain least squares converges at the \(\sqrt{t}\) rate.
The Keynesian eigenvalue, \(-0.2\) here, lies above that boundary, so least squares converges more slowly, like \(t^{-0.2}\).
These rates describe convergence near the equilibrium.
They do not govern how often a learning government escapes from it, which depends instead on the large-deviation analysis of A primer on recursive algorithms; Exercise 102.2 shows the difference.
Lags. Do these results depend on \(X_{t-1} = 1\)?
Let the government’s regression include one lag of each variable, so that \(X_{t-1} = \begin{bmatrix} U_{t-1} & y_{t-1} & 1 \end{bmatrix}^\top\) and \(\gamma = \begin{bmatrix} \gamma_1 & \gamma_{-1}^\top \end{bmatrix}^\top\) has four elements.
Now the government’s rule \(h(\gamma)\) comes from a genuinely dynamic Phelps problem.
With \(\rho_1 = \rho_2 = 0\) the population regression is still exact.
Because \(x_t = h X_{t-1}\) and \(v_{1t}\) is orthogonal to every regressor,
so \(T_1(\gamma) = -\theta\) and \(T_{-1}(\gamma) = \theta h(\gamma)^\top + \begin{bmatrix} 0 & 0 & U^* \end{bmatrix}^\top\).
We compute \(h(\gamma)\) with the general Phelps solver of Adaptive Expectations and the Phelps Problem, repeated here so that this lecture runs on its own.
We check that the Nash beliefs \(\gamma_N = \begin{bmatrix} -\theta & 0 & 0 & (1 + \theta^2) U^* \end{bmatrix}^\top\) are a fixed point, compute the eigenvalues of the Jacobian of \(T - I\), and run the relaxation algorithm from random starting beliefs.
def phelps_general(γ, δ):
    """
    The general Phelps problem of phillips_adaptive for the believed curve
    U_t = γ[0] y_t + γ[1] U_{t-1} + γ[2] y_{t-1} + γ[3].
    Returns h, with ŷ_t = h @ [U_{t-1}, y_{t-1}, 1].
    """
    γ_y = γ[0]
    c = np.asarray(γ[1:], dtype=float).reshape(-1, 1)
    R = 0.5 * (c @ c.T)
    Q = np.array([[0.5 * (γ_y**2 + 1)]])
    N = 0.5 * γ_y * c.T
    A = np.vstack([c.T, [0.0, 0.0, 0.0], [0.0, 0.0, 1.0]])
    B = np.array([[γ_y], [1.0], [0.0]])
    lq = qe.LQ(Q, R, A, B, N=N, beta=min(δ, 1 - 1e-7))
    P, F, d = lq.stationary_values()
    return -F[0]

def T_one_lag(γ, δ, θ=1.0, U_star=5.0):
    "Regression of U_t on (y_t, U_{t-1}, y_{t-1}, 1) when ŷ_t = h(γ) X_{t-1}."
    h = phelps_general(γ, δ)
    return np.concatenate([[-θ], θ * h + np.array([0.0, 0.0, U_star])])

for θ in [0.5, 1.0, 2.0]:
    γ_N = np.array([-θ, 0.0, 0.0, (1 + θ**2) * 5.0])
    for δ in [0.9, 0.98]:
        J = jacobian(lambda g: T_one_lag(g, δ, θ), γ_N)
        eig = np.sort(np.linalg.eigvals(J - np.eye(4)).real)
        gap = np.max(np.abs(T_one_lag(γ_N, δ, θ) - γ_N))
        print(f"θ = {θ}, δ = {δ}:  |T(γ_N) - γ_N| = {gap:.1e},  "
              f"eigenvalues {eig.round(4)}")

rng = np.random.default_rng(0)
κ, δ = 0.5, 0.96
γ_N = np.array([-1.0, 0.0, 0.0, 10.0])
limits = []
for trial in range(10):
    γ = γ_N + np.array([0.0, rng.uniform(-0.9, 0.9),
                        rng.uniform(-1.5, 1.5), rng.uniform(-5, 5)])
    for _ in range(2_000):
        γ_new = κ * γ + (1 - κ) * T_one_lag(γ, δ)
        if np.max(np.abs(γ_new - γ)) < 1e-10:
            break
        γ = γ_new
    limits.append(γ_new)
dist = max(np.max(np.abs(g - γ_N)) for g in limits)
print(f"\nrelaxation from 10 random starts: largest distance of the limit from γ_N = {dist:.1e}")
θ = 0.5, δ = 0.9:  |T(γ_N) - γ_N| = 0.0e+00,  eigenvalues [-1.  -0.8 -0.8 -0.8]
θ = 0.5, δ = 0.98:  |T(γ_N) - γ_N| = 0.0e+00,  eigenvalues [-1.  -0.8 -0.8 -0.8]
θ = 1.0, δ = 0.9:  |T(γ_N) - γ_N| = 0.0e+00,  eigenvalues [-1.  -0.5 -0.5 -0.5]
θ = 1.0, δ = 0.98:  |T(γ_N) - γ_N| = 0.0e+00,  eigenvalues [-1.  -0.5 -0.5 -0.5]
θ = 2.0, δ = 0.9:  |T(γ_N) - γ_N| = 0.0e+00,  eigenvalues [-1.  -0.2 -0.2 -0.2]
θ = 2.0, δ = 0.98:  |T(γ_N) - γ_N| = 0.0e+00,  eigenvalues [-1.  -0.2 -0.2 -0.2]

relaxation from 10 random starts: largest distance of the limit from γ_N = 3.0e-10
The Nash beliefs are a fixed point for every \(\theta\) and \(\delta\), and the eigenvalues are \(-1\) and \(-1/(1 + \theta^2)\), the latter repeated three times, whatever the discount factor.
Relaxation from every starting point converges to the Nash beliefs, with zero weights on the lags.
Adding lags gives the government room to discover the induction hypothesis, but in a self-confirming equilibrium the lag weights are zero and the hypothesis stays deactivated.
Adaptive Learning and Escape Dynamics finds the same pair of eigenvalues with two lags of each variable (Mean dynamics near the self-confirming equilibrium).
102.7. Equilibrium with misspecified beliefs#
To explore how imputing a different wrong model might improve on the Nash outcome, we now let the public, not the government, make a subtle specification error.
This links adaptive expectations, the induction hypothesis, and the Phelps problem.
The government knows the correct model,
where the public has constant-gain adaptive expectations with a parameter \(C\) that it tunes to fit the data.
Taking \(x_t\) as a state variable, the government solves the Phelps problem: it maximizes \(-\mathbb{E}_0 \sum_{t=0}^\infty \delta^t\left[(U^* - \theta(y_t - x_t))^2 + y_t^2\right]\) by choice of a feedback rule \(y_t = f_1 + f_2 x_t + v_{2t}\).
This is exactly the LQ Phelps problem of Adaptive Expectations and the Phelps Problem with adaptation parameter \(\lambda = 1 - C\); the code below repeats it so that this lecture runs on its own.
def phelps_policy(C, δ, θ=1.0, U_star=5.0):
    "Government feedback rule y_t = f1 + f2 x_t, with public gain C."
    λ = 1 - C
    a = np.array([[U_star], [θ]])
    R = 0.5 * (a @ a.T)
    Q = np.array([[0.5 * (θ**2 + 1)]])
    N = -0.5 * θ * a.T
    A = np.array([[1.0, 0.0], [0.0, λ]])
    B = np.array([[0.0], [1 - λ]])
    lq = qe.LQ(Q, R, A, B, N=N, beta=min(δ, 1 - 1e-7))
    P, F, d = lq.stationary_values()
    return -F[0, 0], -F[0, 1]
The government’s behavior makes the actual inflation rate
with mean \(\nu = f_1 / (1 - f_2)\) and spectrum \(F(\omega; C) = |f(e^{i\omega})|^2 \sigma_2^2\).
The mean \(\nu\) is the steady state of the Phelps rule, so the closed form \(y_\infty = \theta U^*(1 - \delta)/(1 - \delta\lambda)\) derived in Adaptive Expectations and the Phelps Problem, with \(\lambda = 1 - C\), gives it:
Mean inflation is below the Nash rate \(\theta U^*\) whenever \(C > 0\); it falls toward zero as \(\delta \to 1\) with \(C\) fixed, and it rises to \(\theta U^*\) as \(C \to 0\).
Everything therefore depends on the equilibrium value of \(C\).
Given \(C\), the public seeks the best-fitting misspecified model of the same form as in Optimal Misspecified Beliefs, the stationary ARMA(1,1) model
whose root \(\rho\) slightly below one (not to be confused with the roots \(\rho_1, \rho_2\) of (102.2)) lets it fit the mean \(\nu\) with near-unit-root persistence.
The induced best-estimate map \(c = B(C)\) defines an equilibrium under forecast misspecification as a fixed point \(C = B(C)\).
This makes both the true and the approximating models equilibrium outcomes, and turns the adaptation parameter \(C\) into an outcome rather than a free parameter.
The best-estimate code is the same as in Optimal Misspecified Beliefs.
def forecast_mse(F, ν, c, ρ, z):
    """
    Mean square one-step forecast error of the perceived model
    g(L) = (1 - (1-c)L)/(1 - ρL) when the true process has mean ν and
    spectral density F on the grid z = exp(iω).  ρ = 1 is allowed.
    """
    W = np.abs((1 - ρ * z) / (1 - (1 - c) * z))**2
    return np.mean(F * W) + ν**2 * W[0]

class MisspecifiedPhillips:
    """
    Equilibrium with misspecified public beliefs: a fixed point of the
    best-estimate map, with the government solving the Phelps problem.
    """

    def __init__(self, θ=1.0, U_star=5.0, σ2=1.0, δ=0.97, ρ=0.995, N=1024):
        self.θ, self.U_star, self.σ2 = θ, U_star, σ2
        self.δ, self.ρ, self.N = δ, ρ, N
        ω = 2 * np.pi * np.arange(N) / N
        self.z = np.exp(1j * ω)
        self.ω = ω

    def true_process(self, C):
        "Return the mean ν, spectrum F, and policy (f1, f2) given belief C."
        f1, f2 = phelps_policy(C, self.δ, self.θ, self.U_star)
        ν = f1 / (1 - f2)
        ψ = 1 - C * (1 - f2)
        f = (1 - (1 - C) * self.z) / (1 - ψ * self.z)
        F = np.abs(f)**2 * self.σ2**2
        return ν, F, (f1, f2)

    def best_estimate(self, C):
        "The best-estimate map c = B(C)."
        ν, F, _ = self.true_process(C)
        return minimize_scalar(lambda c: forecast_mse(F, ν, c, self.ρ, self.z),
                               bounds=(1e-4, 0.99), method='bounded',
                               options={'xatol': 1e-10}).x

    def solve(self, C0=0.1, tol=1e-10, maxit=500):
        "Iterate the best-estimate map to a fixed point."
        C = C0
        for _ in range(maxit):
            C_new = self.best_estimate(C)
            if abs(C_new - C) < tol:
                break
            C = C_new
        ν, _, (f1, f2) = self.true_process(C_new)
        return C_new, ν, (f1, f2)
The size of the inflation surprise.
Chapter 7 of Sargent [1999] states \(\sigma_1 = \sigma_2 = 0.3\) for this example.
Its reported numbers are reproduced with \(\sigma_2 = 1\), which is also consistent with its statement that the true model’s one-step prediction error has standard deviation 1.
We use \(\sigma_2 = 1\).
The choice matters because the fitting criterion is not scale-invariant.
The criterion of Optimal Misspecified Beliefs equals \(\sigma_2^2\) times a function of \(c\) that depends on \(\sigma_2\) only through the ratio \(\nu/\sigma_2\) of the mean that the perceived model must fit to the size of the surprises.
A smaller \(\sigma_2\) makes the mean relatively larger, which pushes the public toward a larger gain and so, by (102.8), lowers mean inflation.
mp = MisspecifiedPhillips(δ=0.97)
C_star, ν_star, (f1, f2) = mp.solve()

print(f"equilibrium gain     C = {C_star:.4f}")
print(f"policy rule          y = {f1:.4f} + {f2:.4f} x")
print(f"mean inflation       ν = {ν_star:.3f}   (formula: "
      f"{mp.θ * mp.U_star * (1 - mp.δ) / (1 - mp.δ + mp.δ * C_star):.3f})")
print(f"Nash inflation   θ U*  = {mp.θ * mp.U_star:.3f}")

C_03, ν_03, _ = MisspecifiedPhillips(δ=0.97, σ2=0.3).solve()
print(f"\nwith σ2 = 0.3:  C = {C_03:.4f},  mean inflation = {ν_03:.3f}")
equilibrium gain     C = 0.0673
policy rule          y = 1.0242 + 0.3495 x
mean inflation       ν = 1.574   (formula: 1.574)
Nash inflation   θ U*  = 5.000

with σ2 = 0.3:  C = 0.1138,  mean inflation = 1.069
With \(\sigma_2 = 1\), these are the values that chapter 7 of Sargent [1999] reports.
The most important outcome is that the implied mean inflation rate is substantially below the Nash value of \(5\).
The induction hypothesis embedded in the adaptive expectations scheme, together with a high discount factor, delivers this improvement.
Because \(C\) is now an equilibrium outcome, the mechanism is sharper than in Adaptive Expectations and the Phelps Problem, where \(\lambda = 1 - C\) could be manipulated independently of \(\delta\).
As in Optimal Misspecified Beliefs, the equilibrium is E-stable.
h = 1e-4
B_prime = (mp.best_estimate(C_star + h) - mp.best_estimate(C_star - h)) / (2 * h)
print(f"B'(C*) = {B_prime:.3f}")
B'(C*) = -0.305
Here \(B'(C^*)\) is negative but greater than \(-1\), so the iteration of \(B\) converges, oscillating around \(C^*\).
One reason for the negative slope is that a higher gain makes the government disinflate further, which lowers the mean that the public’s model must fit and so lowers the gain the public wants.
102.7.1. Approaching Ramsey#
As the government becomes more patient, the equilibrium mean inflation rate falls toward the Ramsey value of zero.
δ_grid = np.array([0.95, 0.96, 0.97, 0.98, 0.99, 0.995])
C_vals, ν_vals = [], []
for δ in δ_grid:
    C, ν, _ = MisspecifiedPhillips(δ=δ).solve()
    C_vals.append(C)
    ν_vals.append(ν)

fig, axes = plt.subplots(1, 2, figsize=(11, 4.5))
axes[0].plot(δ_grid, ν_vals, 'o-')
axes[0].axhline(mp.θ * mp.U_star, color='k', ls='--', lw=1, label='Nash')
axes[0].set_xlabel(r'discount factor $\delta$')
axes[0].set_ylabel('mean inflation')
axes[0].legend()

axes[1].plot(δ_grid, C_vals, 'o-', color='C1', lw=2)
axes[1].set_xlabel(r'discount factor $\delta$')
axes[1].set_ylabel('equilibrium gain $C$')

plt.tight_layout()
plt.show()

print(f"{'δ':>6} {'C':>8} {'ν':>7}")
for δ, C, ν in zip(δ_grid, C_vals, ν_vals):
    print(f"{δ:>6} {C:>8.4f} {ν:>7.2f}")
ν_book = mp.θ * mp.U_star * 0.01 / (0.01 + 0.99 * 0.019)
print(f"\nformula (sc_nu) at the book's δ = 0.99 entry, C = 0.019:  ν = {ν_book:.2f}")
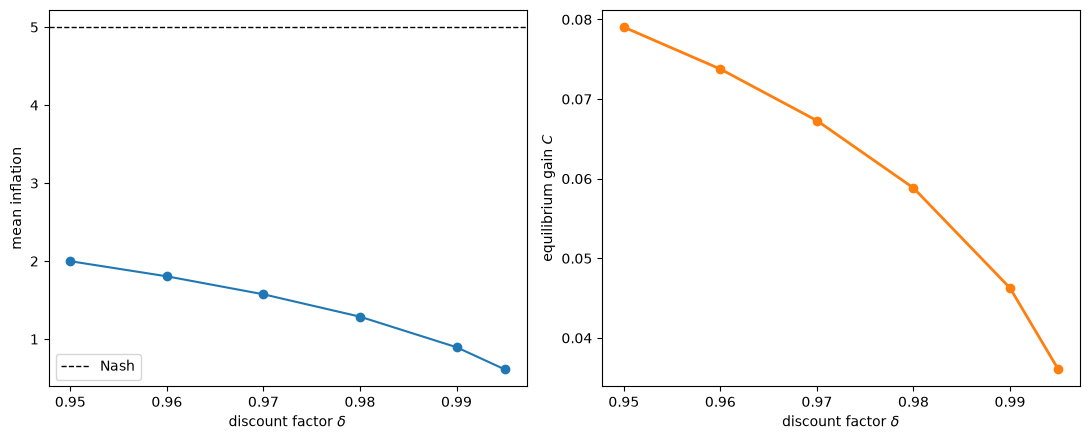
Fig. 102.2 Mean inflation and the equilibrium gain as the government becomes more patient#
     δ        C       ν
  0.95   0.0790    2.00
  0.96   0.0738    1.80
  0.97   0.0673    1.57
  0.98   0.0588    1.29
  0.99   0.0463    0.90
 0.995   0.0361    0.61

formula (sc_nu) at the book's δ = 0.99 entry, C = 0.019:  ν = 1.74
Mean inflation lies far below the Nash value at every discount factor and declines toward the Ramsey value of zero as \(\delta \to 1\).
The values of \(C\) and \(\nu\) match footnote 14 of chapter 7 of Sargent [1999] for \(\delta = 0.95\), \(0.96\), and \(0.98\).
The book’s entry for \(\delta = 0.99\) (\(C = 0.019\), mean inflation \(0.25\)) is inconsistent with (102.8), which, as printed above, gives a much higher mean inflation at \(C = 0.019\).
102.7.2. The role of \(\rho\)#
Every number above was computed with the public’s perceived root \(\rho = 0.995\).
How the equilibrium depends on \rho showed that in Bray’s model the equilibrium gain vanishes as \(\rho \to 1\).
The next cell asks what happens here, for both values of \(\sigma_2\), again using a finer frequency grid.
print(f"{'ρ':>7} {'C (σ2=1)':>10} {'ν (σ2=1)':>10} {'C (σ2=.3)':>11} {'ν (σ2=.3)':>11}")
for ρ in [0.99, 0.995, 0.999, 0.9995]:
    row = []
    for σ2 in [1.0, 0.3]:
        C, ν, _ = MisspecifiedPhillips(δ=0.97, σ2=σ2, ρ=ρ, N=2**14).solve()
        row += [C, ν]
    print(f"{ρ:>7} {row[0]:>10.4f} {row[1]:>10.3f} {row[2]:>11.4f} {row[3]:>11.3f}")

m1 = MisspecifiedPhillips(δ=0.97, ρ=1.0, N=2**14)
ratio = max(m1.best_estimate(C) / C for C in np.linspace(0.005, 0.3, 30))
print(f"\nρ = 1: largest value of B(C)/C on the grid = {ratio:.3f}")
      ρ   C (σ2=1)   ν (σ2=1)   C (σ2=.3)   ν (σ2=.3)
   0.99     0.0918      1.260      0.1527       0.842
  0.995     0.0673      1.574      0.1138       1.069
  0.999     0.0316      2.474      0.0558       1.783
 0.9995     0.0223      2.905      0.0404       2.169

ρ = 1: largest value of B(C)/C on the grid = 0.311
Mean inflation rises toward the Nash value as \(\rho \to 1\), for both values of \(\sigma_2\).
With the exact unit root, \(B(C) < C\) for every \(C\), so the equilibrium gain is zero, the public’s expectations stop moving, and by (102.8) mean inflation is the Nash rate \(\theta U^*\).
So the better-than-Nash outcomes hold for each fixed \(\rho < 1\), and vanish as \(\rho \to 1\).
For each fixed \(\rho < 1\) they approach Ramsey as \(\delta \to 1\), but for each fixed \(\delta < 1\) they disappear as \(\rho \to 1\) (Exercise 102.3 studies the two limits).
The reason is the one given in How the equilibrium depends on \rho: the pull toward a large gain comes from the mean bias that a perceived model with \(\rho < 1\) would leave, and it disappears with the unit root that the public’s forecasting rule actually embodies.
102.7.3. Spectra and impulse responses#
Let’s compare the true and approximating inflation processes at the equilibrium, as in Figures 7.2 and 7.3 of Sargent [1999].
ν_star, F, _ = mp.true_process(C_star)
c_star = mp.best_estimate(C_star)
σ_ε2 = forecast_mse(F, ν_star, c_star, mp.ρ, mp.z)
H = np.abs((1 - (1 - c_star) * mp.z) / (1 - mp.ρ * mp.z))**2
G = H * σ_ε2

half = mp.N // 2
fig, ax = plt.subplots(figsize=(8, 5))
ax.plot(mp.ω[:half], np.log(F[:half]), 'C0', label='true model', lw=2)
ax.plot(mp.ω[:half], np.log(G[:half]), 'C1--', label='approximating model', lw=2)
ax.set_xlabel(r'angular frequency $\omega$')
ax.set_ylabel('log spectral density')
ax.legend()
plt.show()
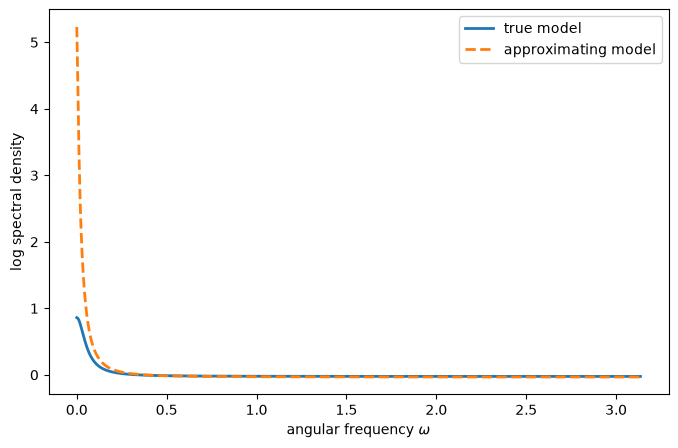
Fig. 102.3 Spectral densities of the true and approximating inflation processes at the equilibrium#
The true and approximating spectral densities match well at all but the lowest frequencies.
The true inflation rate is only moderately serially correlated, and — as in the Bray model of Optimal Misspecified Beliefs — the approximating model uses a near unit root to simulate a mean, capturing first moments with second moments.
def ima_impulse(num, den, T=25):
    "IRF of (1 - num L)/(1 - den L)."
    h = np.empty(T)
    h[0] = 1.0
    for k in range(1, T):
        h[k] = den * h[k - 1]
    h[1:] -= num * h[:-1]
    return h

ψ = 1 - C_star * (1 - f2)
irf_true = ima_impulse(1 - C_star, ψ)
irf_approx = ima_impulse(1 - c_star, mp.ρ)

lags = np.arange(len(irf_true))
fig, axes = plt.subplots(1, 2, figsize=(11, 4.5))
for ax, start in zip(axes, [0, 1]):
    ax.plot(lags[start:], irf_true[start:], 'C0o-', ms=4, label='true model', lw=2)
    ax.plot(lags[start:], irf_approx[start:], 'C1s--', ms=4,
            label='approximating model', lw=2)
    ax.set_xlabel('lag')
    ax.set_ylabel('response')
axes[0].set_title('all lags')
axes[1].set_title('lags 1 and beyond')
axes[0].legend()
plt.tight_layout()
plt.show()
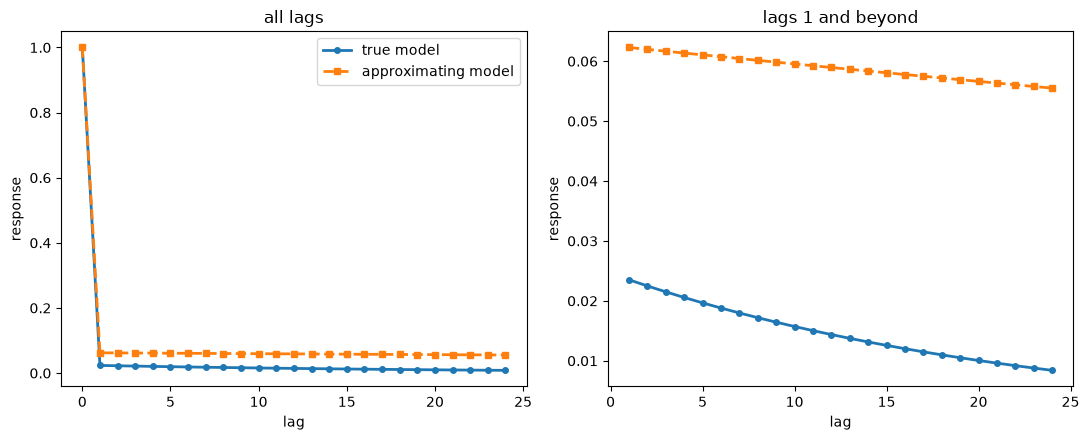
Fig. 102.4 Impulse responses of the true and approximating inflation processes#
Here both models respond to a unit one-step-ahead forecast error, since \(f(0) = g(0) = 1\).
The near unit root of the approximating model shows up as a response that dies out only at rate \(\rho\), which over the horizon plotted looks like a nonzero asymptote.
102.7.4. Grounds for optimism#
After the disappointments of the self-confirming equilibria, the equilibrium with forecast misspecification is heartening: it supports better-than-Nash outcomes.
The equilibrium concept is not self-confirming, but it has that spirit — it embodies a type of self-confirmation with a wrong model.
The approximation error is small.
print(f"one-step RMSE of the approximating model / true innovation s.d. = "
      f"{np.sqrt(σ_ε2) / mp.σ2:.4f}")
one-step RMSE of the approximating model / true innovation s.d. = 1.0155
The approximating model’s one-step forecast errors are only slightly larger than the true innovations, so there is a nearly self-confirming model with much better than Nash outcomes.
But the optimism is conditional.
The good outcomes rest on the public’s perceived model having a root \(\rho\) strictly below one; with the exact unit root that its forecasting rule embodies, the equilibrium gain is zero and the outcome is Nash.
What the example shows is that a small, hard-to-detect misspecification in the public’s model can matter a great deal for outcomes.
The next lectures in this suite — Adaptive Learning and Escape Dynamics, Escaping Nash Inflation, and Priors, Escapes, and Learning Cycles — build adaptive, real-time versions of these models in which the government estimates its Phillips curve recursively from the most recent data.
There the classical (Nash) self-confirming equilibrium becomes the attractor of the learning dynamics.
With a constant gain, the government escapes from it recurrently toward Ramsey and is pulled back, and better-than-Nash outcomes reappear during the escapes.
Those escapes run through the government’s beliefs, not through a misspecification of the public’s.
102.8. Exercises#
Exercise 102.1
The gap between the two static self-confirming equilibria is driven by the variances \(\sigma_1^2\) (of the Phillips curve shock) and \(\sigma_2^2\) (of the inflation surprise).
The classical equilibrium always delivers mean inflation equal to the Nash value \(\theta U^*\), but the Keynesian mean inflation depends on the ratio \(\sigma_1 / \sigma_2\).
Fixing \(\sigma_2 = 0.3\), \(\theta = 1\), \(U^* = 5\), plot Keynesian mean inflation as a function of \(\sigma_1 \in [0.05, 1.0]\), and compare it with formula (102.5).
What happens as \(\sigma_1 \to 0\), and why?
Solution
σ1_grid = np.linspace(0.05, 1.0, 50)
y_keynes = [SelfConfirmingStatic(σ1=σ1, σ2=0.3).keynesian()[2]
            for σ1 in σ1_grid]
y_formula = 5.0 * (1 + σ1_grid**2 / 0.3**2)

fig, ax = plt.subplots(figsize=(8, 4.5))
ax.plot(σ1_grid, y_keynes, lw=2, label='Keynesian mean inflation')
ax.plot(σ1_grid, y_formula, 'k:', lw=2, label='formula')
ax.axhline(5.0, color='k', ls='--', lw=1, label='Nash')
ax.set_xlabel(r'$\sigma_1$')
ax.set_ylabel('mean inflation')
ax.legend()
plt.show()
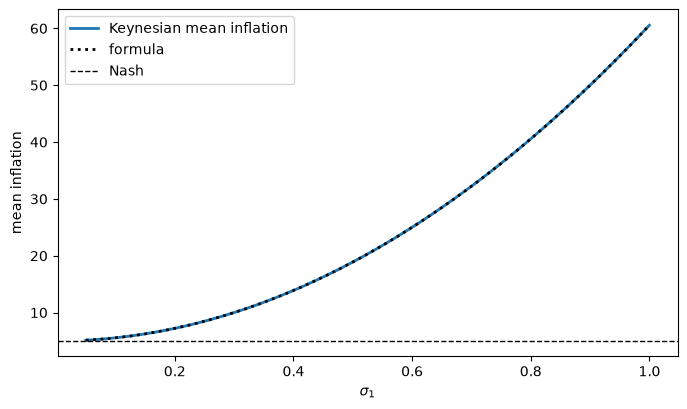
The computed values lie on the formula \(\theta U^*(1 + \sigma_1^2/(\theta^2 \sigma_2^2))\).
As \(\sigma_1 \to 0\) the Phillips curve becomes nearly deterministic, the Keynesian slope \(\beta_1 \to -1/\theta\), and the two directions of fit agree, so Keynesian mean inflation approaches the Nash value.
As \(\sigma_1\) grows, unemployment becomes noisier, the Keynesian regression of \(y\) on \(U\) flattens, and the government perceives a more exploitable tradeoff, raising mean inflation quadratically in \(\sigma_1\).
Exercise 102.2
Self-confirming equilibria are rest points of least squares learning.
Here is what decreasing-gain learning does in the static model, in which the government re-estimates its Phillips curve every period.
Each period the government sets \(\hat y_t\) by (102.3) at its current beliefs, the public expects \(x_t = \hat y_t\), \((U_t, y_t)\) are generated by the actual Phillips curve with \(\rho_1 = \rho_2 = 0\), and the government updates its regression by recursive least squares with gain \(1/(t + t_0)\).
The value \(t_0 = 100\) represents a prior sample of 100 observations, and the regression’s moment matrix starts at its population value in the self-confirming equilibrium.
For each direction of fit, simulate 500 paths of 20,000 periods, starting at the respective self-confirming equilibrium.
For the Keynesian fit, show that the root mean square deviation of \(\hat y_t\) from its equilibrium value \(10\) shrinks roughly like \(t^{-0.2}\), as its E-stability eigenvalue predicts.
For the classical fit, compute the fraction of paths whose target ends more than one point away from the Nash value \(5\).
Explain the difference, using the moments of \((U_t, y_t)\) when the target \(\hat y_t\) moves over time.
Solution
def rls_static(direction, n_paths=500, T=20_000, t0=100,
               θ=1.0, U_star=5.0, σ1=0.3, σ2=0.3, seed=0):
    """
    Decreasing-gain recursive least squares in the static model.
    Beliefs are (intercept, slope).  Returns the targets ŷ_t, shape
    (n_paths, T), and the target in the self-confirming equilibrium.
    """
    rng = np.random.default_rng(seed)
    if direction == 'classical':                    # regress U on (1, y)
        y_sce = θ * U_star
        b0 = np.array([(1 + θ**2) * U_star, -θ])
        R0 = np.array([[1.0, y_sce], [y_sce, y_sce**2 + σ2**2]])
    else:                                           # regress y on (1, U)
        β1 = -θ * σ2**2 / (σ1**2 + θ**2 * σ2**2)
        y_sce = -U_star / β1
        b0 = np.array([(1 + β1**2) * y_sce, β1])
        R0 = np.array([[1.0, U_star],
                       [U_star, U_star**2 + θ**2 * σ2**2 + σ1**2]])
    b = np.tile(b0, (n_paths, 1))
    R = np.tile(R0, (n_paths, 1, 1))
    targets = np.empty((n_paths, T))
    ones = np.ones(n_paths)

    for t in range(T):
        intercept, slope = b[:, 0], b[:, 1]
        if direction == 'classical':
            y_hat = -slope * intercept / (1 + slope**2)
        else:
            y_hat = intercept / (1 + slope**2)
        targets[:, t] = y_hat

        v1 = σ1 * rng.standard_normal(n_paths)
        v2 = σ2 * rng.standard_normal(n_paths)
        y = y_hat + v2
        U = U_star - θ * v2 + v1
        if direction == 'classical':
            X, lhs = np.column_stack([ones, y]), U
        else:
            X, lhs = np.column_stack([ones, U]), y

        g = 1 / (t + 1 + t0)
        R = R + g * (X[:, :, None] * X[:, None, :] - R)
        err = lhs - np.sum(X * b, axis=1)
        b = b + g * np.linalg.solve(R, (X * err[:, None])[:, :, None])[:, :, 0]

    return targets, y_sce

results = {d: rls_static(d) for d in ['classical', 'keynesian']}
t_axis = np.arange(1, 20_001)

fig, axes = plt.subplots(1, 2, figsize=(11, 4.5))
for d, color in [('classical', 'C0'), ('keynesian', 'C1')]:
    targets, y_sce = results[d]
    axes[0].plot(t_axis, targets[:15].T, color=color, lw=0.6, alpha=0.7)
    axes[0].axhline(y_sce, color=color, ls='--', lw=1.5, label=f'{d.capitalize()} SCE')
    far = np.mean(np.abs(targets - y_sce) > 1.0, axis=0)
    axes[1].plot(t_axis, far, color=color, lw=2, label=d.capitalize())
axes[0].set_xlabel('$t$')
axes[0].set_ylabel(r'target inflation $\hat y_t$')
axes[0].legend()
axes[1].set_xlabel('$t$')
axes[1].set_ylabel('fraction of paths more than 1 from the SCE')
axes[1].legend()
plt.tight_layout()
plt.show()

targets, y_sce = results['keynesian']
rms = np.sqrt(np.mean((targets - y_sce)**2, axis=0))
keep = slice(200, None)
slope = np.polyfit(np.log(t_axis[keep] + 100), np.log(rms[keep]), 1)[0]
print(f"Keynesian: slope of log RMS deviation on log t = {slope:.2f}  (eigenvalue -0.2)")
for d in ['classical', 'keynesian']:
    targets, y_sce = results[d]
    print(f"{d}: fraction of paths more than 1 from the SCE at the end = "
          f"{np.mean(np.abs(targets[:, -1] - y_sce) > 1.0):.2f}")
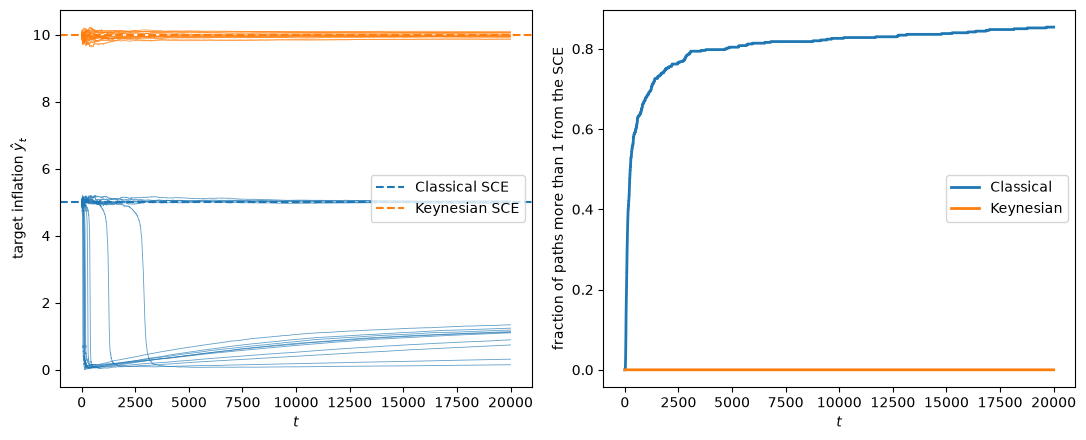
Keynesian: slope of log RMS deviation on log t = -0.17  (eigenvalue -0.2)
classical: fraction of paths more than 1 from the SCE at the end = 0.85
keynesian: fraction of paths more than 1 from the SCE at the end = 0.00
The Keynesian learner converges slowly, at roughly the rate its eigenvalue predicts.
The classical learner, whose eigenvalue \(-1/2\) promises faster convergence, does much worse: a large fraction of its paths escape toward Ramsey and are still far from Nash after 20,000 periods.
The reason lies in what the data show when the target moves.
Since only surprises move unemployment, a change in \(\hat y_t\) moves \(y_t\) but not \(U_t\).
In a regression of \(U\) on \(y\), that variation adds to the variance of the regressor but not to its covariance with \(U\), so it flattens the estimated slope toward zero.
A flatter perceived curve makes the Phelps rule (102.3) recommend lower inflation, which moves the target further and flattens the slope again: a self-reinforcing escape toward Ramsey.
In a regression of \(y\) on \(U\), the same variation adds only to the variance of the dependent variable, and leaves the slope alone.
E-stability is a statement about small deviations from the equilibrium; escapes are large deviations, studied in Adaptive Learning and Escape Dynamics and Escaping Nash Inflation.
With a decreasing gain, least squares still converges to the equilibrium asymptotically, but an escape that starts early can last a long time, because the falling gain also slows the return (Least squares learning: a decreasing gain).
Exercise 102.3
Formula (102.8) shows that mean inflation in the equilibrium with misspecified beliefs depends on \(\delta\) and on the equilibrium gain \(C\), which depends on \(\delta\) and on the public’s perceived root \(\rho\).
Compute the equilibrium \(C\) and mean inflation \(\nu\) for \(\delta \in \{0.97, 0.99, 0.999\}\) and \(\rho \in \{0.995, 0.9995, 1\}\), with \(\sigma_2 = 1\).
What happens as \(\delta \to 1\) with \(\rho\) fixed, and as \(\rho \to 1\) with \(\delta\) fixed?
What does this imply for the claim that the equilibrium approaches Ramsey as the government becomes patient?
Solution
def ν_closed(C, δ, θ=1.0, U_star=5.0):
    "Mean inflation (sc_nu) given the public's gain C."
    return θ * U_star * (1 - δ) / (1 - δ + δ * C)

print(f"{'δ':>6} {'ρ':>7} {'C':>8} {'ν':>7}")
for δ in [0.97, 0.99, 0.999]:
    for ρ in [0.995, 0.9995]:
        C, ν, _ = MisspecifiedPhillips(δ=δ, ρ=ρ, N=2**14).solve()
        print(f"{δ:>6} {ρ:>7} {C:>8.4f} {ν:>7.3f}")
    m1 = MisspecifiedPhillips(δ=δ, ρ=1.0, N=2**14)
    ratio = max(m1.best_estimate(C) / C for C in np.linspace(0.005, 0.3, 20))
    print(f"{δ:>6} {1:>7} {0:>8.4f} {ν_closed(0.0, δ):>7.3f}"
          f"   (largest B(C)/C = {ratio:.2f})")
     δ       ρ        C       ν
  0.97   0.995   0.0673   1.574
  0.97  0.9995   0.0223   2.905
  0.97       1   0.0000   5.000   (largest B(C)/C = 0.31)
  0.99   0.995   0.0463   0.896
  0.99  0.9995   0.0166   1.894
  0.99       1   0.0000   5.000   (largest B(C)/C = 0.23)
 0.999   0.995   0.0199   0.239
 0.999  0.9995   0.0075   0.587
 0.999       1   0.0000   5.000   (largest B(C)/C = 0.04)
For fixed \(\rho < 1\), mean inflation falls toward zero as \(\delta\) rises, because the equilibrium gain falls much more slowly than \(1 - \delta\) in (102.8).
For fixed \(\delta\), mean inflation rises toward the Nash value as \(\rho \to 1\), because the equilibrium gain falls to zero, and at \(\rho = 1\) it is exactly \(\theta U^*\) for every \(\delta < 1\).
The two limits do not commute.
The claim that the equilibrium approaches Ramsey as the government becomes patient holds for each fixed \(\rho < 1\), but it is not uniform in \(\rho\): the closer the public’s perceived root is to the unit root that its rule embodies, the more patient the government must be to get close to Ramsey.