27. A Bayesian Formulation of Friedman and Wald’s Problem#
27.1. Overview#
This lecture revisits the statistical decision problem presented to Milton Friedman and W. Allen Wallis during World War II when they were analysts at the U.S. Government’s Statistical Research Group at Columbia University.
In an earlier lecture, we described how Abraham Wald [Wald, 1947] solved the problem by extending frequentist hypothesis testing techniques and formulating the problem sequentially.
Note
Wald’s idea of formulating the problem sequentially created links to the dynamic programming that Richard Bellman developed in the 1950s.
Arrow et al. [1949] computed Bayes solutions of sequential decision problems by backward induction, anticipating Bellman’s methods.
Wald and Wolfowitz [1948] used Bayes solutions to prove that Wald’s sequential probability ratio test is optimal.
A section below shows that the Bayesian decision rule studied in this lecture is a sequential probability ratio test.
As we learned in Elementary Probability with Matrices and Two Meanings of Probability, a frequentist statistician views a probability distribution as measuring relative frequencies of a statistic that he anticipates constructing from a very long sequence of i.i.d. draws from a known probability distribution.
That known probability distribution is his ‘hypothesis’.
A frequentist statistician studies the distribution of that statistic under that known probability distribution
when the distribution is a member of a set of parameterized probability distributions, his hypothesis takes the form of a particular parameter vector.
this is what we mean when we say that the frequentist statistician ‘conditions on the parameters’
he regards the parameters as fixed numbers that are known to nature, but not to him.
the statistician copes with his ignorance of those parameters by constructing type I and type II errors associated with frequentist hypothesis testing.
In this lecture, we reformulate Friedman and Wald’s problem by transforming our point of view from the ‘objective’ frequentist perspective of the lecture on Wald’s sequential analysis to an explicitly ‘subjective’ perspective taken by a Bayesian decision maker who regards parameters not as fixed numbers but as (hidden) random variables that are jointly distributed with the random variables that he can observe by sampling from that joint distribution.
To form that joint distribution, the Bayesian statistician supplements the conditional distributions used by the frequentist statistician with a prior probability distribution over the parameters that represents his personal, subjective opinion about them.
That lets the Bayesian statistician calculate the joint distribution that he requires to calculate the conditional distributions that he wants.
To proceed in this way, we endow our decision maker with
an initial prior subjective probability \(\pi_{-1} \in (0,1)\) that nature uses to generate \(\{z_k\}\) as a sequence of i.i.d. draws from \(f_1\) rather than \(f_0\).
faith in Bayes’ law as a way to revise his subjective beliefs as observations on \(\{z_k\}\) sequence arrive.
a loss function that tells how the decision maker values type I and type II errors.
In our previous frequentist version, key ideas in play were:
Type I and type II statistical errors
a type I error occurs when you reject a null hypothesis that is true
a type II error occurs when you accept a null hypothesis that is false
Abraham Wald’s sequential probability ratio test
The power of a statistical test
The critical region of a statistical test
A most powerful test
In this lecture about a Bayesian reformulation of the problem, additional ideas at work are
an initial prior probability \(\pi_{-1}\) that model \(f_1\) generates the data
Bayes’ Law
a sequence of posterior probabilities that model \(f_1\) is generating the data
dynamic programming
This lecture uses ideas studied in the lectures on likelihood ratio processes, their roles in Bayesian learning, and this lecture on exchangeability.
Blackwell’s Theorem on Comparing Experiments studies a complementary question: how to rank experiments by their informativeness.
Here the experiment is fixed, and the decision maker chooses when to stop sampling from it.
We’ll begin with some imports:
import numpy as np
import matplotlib.pyplot as plt
from numba import jit, prange, float64, int64
from numba.experimental import jitclass
from math import gamma
27.2. A Dynamic Programming Approach#
The following presentation of the problem closely follows Dimitri Bertsekas’s treatment in Dynamic Programming and Stochastic Control [Bertsekas, 1976].
A decision-maker can observe a sequence of draws of a random variable \(z\).
He (or she) wants to know which of two probability distributions \(f_0\) or \(f_1\) governs \(z\).
Conditional on knowing that successive observations are drawn from distribution \(f_0\), the sequence of random variables is independently and identically distributed (IID).
Conditional on knowing that successive observations are drawn from distribution \(f_1\), the sequence of random variables is also independently and identically distributed (IID).
But the observer does not know which of the two distributions generated the sequence.
For reasons explained in Exchangeability and Bayesian Updating, this means that the sequence is not IID.
The observer has something to learn, namely, whether the observations are drawn from \(f_0\) or from \(f_1\).
The decision maker wants to decide which of the two distributions is generating outcomes.
We adopt a Bayesian formulation.
The decision maker begins with a prior probability
Note
In Bertsekas [1976], the belief is associated with the distribution \(f_0\), but here we associate the belief with the distribution \(f_1\) to match the discussions in the lecture on Wald’s sequential analysis.
After observing \(k+1\) observations \(z_k, z_{k-1}, \ldots, z_0\), he updates his personal probability that the observations are described by distribution \(f_1\) to
which is calculated recursively by applying Bayes’ law:
After observing \(z_k, z_{k-1}, \ldots, z_0\), the decision-maker believes that \(z_{k+1}\) has probability distribution
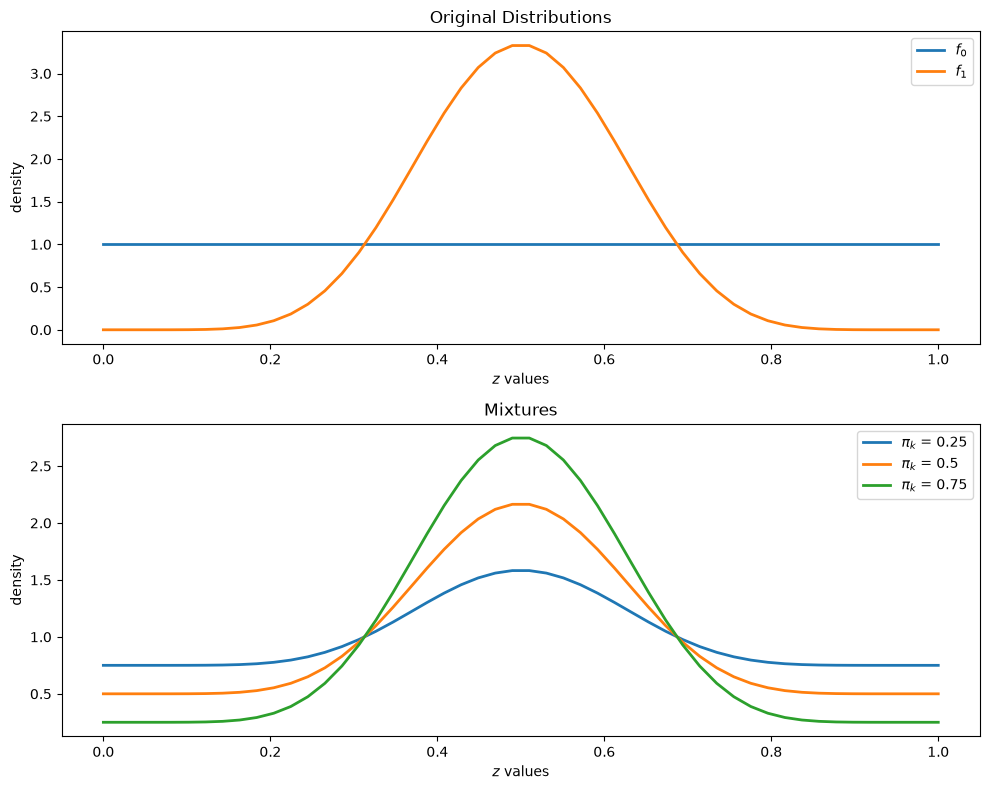
which is a mixture of distributions \(f_0\) and \(f_1\), with the weight on \(f_1\) being the posterior probability that \(f = f_1\) [1].
To illustrate such a distribution, let’s inspect some mixtures of beta distributions.
The density of a beta probability distribution with parameters \(a\) and \(b\) is
The next figure shows two beta distributions in the top panel.
The bottom panel presents mixtures of these distributions, with various mixing probabilities \(\pi_k\)
@jit
def p(x, a, b):
    r = gamma(a + b) / (gamma(a) * gamma(b))
    return r * x**(a-1) * (1 - x)**(b-1)

f0 = lambda x: p(x, 1, 1)
f1 = lambda x: p(x, 9, 9)
grid = np.linspace(0, 1, 50)

fig, axes = plt.subplots(2, figsize=(10, 8))

axes[0].set_title("Original Distributions")
axes[0].plot(grid, f0(grid), lw=2, label="$f_0$")
axes[0].plot(grid, f1(grid), lw=2, label="$f_1$")

axes[1].set_title("Mixtures")
for π in 0.25, 0.5, 0.75:
    y = (1 - π) * f0(grid) + π * f1(grid)
    axes[1].plot(grid, y, lw=2, label=fr"$\pi_k$ = {π}")

for ax in axes:
    ax.legend()
    ax.set(xlabel="$z$ values", ylabel="density")

plt.tight_layout()
plt.show()
27.2.1. Losses and Costs#
After observing \(z_k, z_{k-1}, \ldots, z_0\), the decision-maker chooses among three distinct actions:
He decides that \(f = f_0\) and draws no more \(z\)’s
He decides that \(f = f_1\) and draws no more \(z\)’s
He postpones deciding now and instead chooses to draw a \(z_{k+1}\)
Associated with these three actions, the decision-maker can suffer three kinds of losses:
A loss \(L_0\) if he decides \(f = f_0\) when actually \(f=f_1\)
A loss \(L_1\) if he decides \(f = f_1\) when actually \(f=f_0\)
A cost \(c\) if he postpones deciding and chooses instead to draw another \(z\)
27.2.2. Digression on Type I and Type II Errors#
If we regard \(f=f_0\) as a null hypothesis and \(f=f_1\) as an alternative hypothesis, then \(L_1\) and \(L_0\) are losses associated with two types of statistical errors
a type I error is an incorrect rejection of a true null hypothesis (a “false positive”)
a type II error is a failure to reject a false null hypothesis (a “false negative”)
So when we treat \(f=f_0\) as the null hypothesis
We can think of \(L_1\) as the loss associated with a type I error.
We can think of \(L_0\) as the loss associated with a type II error.
27.2.3. Intuition#
Before proceeding, let’s try to guess what an optimal decision rule might look like.
Suppose at some given point in time that \(\pi\) is close to 1.
Then our prior beliefs and the evidence so far point strongly to \(f = f_1\).
If, on the other hand, \(\pi\) is close to 0, then \(f = f_0\) is strongly favored.
Finally, if \(\pi\) is in the middle of the interval \([0, 1]\), then we are confronted with more uncertainty.
This reasoning suggests a sequential decision rule that we illustrate in the following figure:

As we’ll see, this is indeed the correct form of the decision rule.
Our problem is to determine threshold values \(A, B\) that somehow depend on the parameters described above.
You might like to pause at this point and try to predict the impact of a parameter such as \(c\) or \(L_0\) on \(A\) or \(B\).
27.2.4. A Bellman Equation#
Let \(J(\pi)\) be the total loss for a decision-maker with current belief \(\pi\) who chooses optimally.
Principles of dynamic programming teach us that an optimal loss function \(J\) satisfies the following Bellman functional equation
where \(\pi'\) is the random variable defined by Bayes’ Law
when \(\pi\) is fixed and \(z'\) is drawn from the current best guess, which is the distribution \(f\) defined by
In the Bellman equation, minimization is over three actions:
Accept the hypothesis that \(f = f_0\)
Accept the hypothesis that \(f = f_1\)
Postpone deciding and draw again
We can represent the Bellman equation as
where \(\pi \in [0,1]\) and
\(\pi L_0\) is the expected loss associated with accepting \(f_0\) (i.e., the cost of making a type II error).
\((1-\pi) L_1\) is the expected loss associated with accepting \(f_1\) (i.e., the cost of making a type I error).
\(h(\pi) := c + \mathbb E [J(\pi')]\); this is the continuation value; i.e., the expected cost associated with drawing one more \(z\).
The optimal decision rule is characterized by two numbers \(0 < B \leq A < 1\) that satisfy
and
The optimal decision rule is then
The two-threshold form of this rule follows from three properties of \(h\) and of the stopping loss \(S(\pi) = \min \{ \pi L_0, (1-\pi) L_1 \}\).
First, \(h(0) = h(1) = c\).
When \(\pi \in \{0, 1\}\), Bayes’ law sets \(\pi' = \pi\), and \(J(0) = J(1) = 0\).
Second, \(h\) is concave.
Write \(\mathbb E [J(\pi')] = \int f_\pi(z') J \left( \pi f_1(z') / f_\pi(z') \right) dz'\).
For each \(z'\), the integrand is the perspective \(t J(x/t)\) of \(J\) evaluated at \(x = \pi f_1(z')\) and \(t = f_\pi(z')\), both linear in \(\pi\).
The perspective of a concave function is concave, so \(\mathbb E [J(\pi')]\) is concave in \(\pi\) whenever \(J\) is.
\(J\) is the minimum of \(h\) and two linear functions, so \(J\) is concave whenever \(h\) is.
Therefore the operator \(Q\) defined below maps concave functions into concave functions, and its fixed point \(h\), a limit of iterates that start from \(h = 0\), is concave.
Third, \(S\) is linear on each side of \(\hat \pi = L_1/(L_0 + L_1)\).
On \([0, \hat \pi]\), accepting \(f_0\) is optimal where \(\pi L_0 - h(\pi) \leq 0\).
The function \(\pi L_0 - h(\pi)\) is convex and equals \(-c < 0\) at \(\pi = 0\), so this set is an interval \([0, B]\) with \(B > 0\).
On \([\hat \pi, 1]\), the same argument applied to \((1-\pi) L_1 - h(\pi)\) gives an interval \([A, 1]\) with \(A < 1\) on which accepting \(f_1\) is optimal.
The decision maker draws again on the interval \((B, A)\) between them.
That interval is empty, and \(B = A = \hat \pi\), when \(h(\hat \pi) \geq S(\hat \pi)\).
Because \(h \geq c\), this happens whenever \(c \geq L_0 L_1/(L_0 + L_1)\).
Our aim is to compute the cost function \(J\) as well as the associated cutoffs \(A\) and \(B\).
To help make our computations more manageable, we can use (27.2) to write the continuation cost \(h(\pi)\) as
The equality
is an equation in an unknown function \(h\).
Note
Such an equation is called a functional equation.
Using the functional equation, (27.4), for the continuation cost, we can back out optimal choices using the right side of (27.2).
This functional equation can be solved by taking an initial guess and iterating to find a fixed point.
Thus, we iterate with an operator \(Q\), where
The operator \(Q\) is monotone: \(h \leq g\) implies \(Q h \leq Q g\).
The decision maker does not discount future losses, so \(Q\) is not a contraction in the sup norm.
We start from \(h = 0\).
Then \(Q h \geq h\), and monotonicity makes the iterates \(Q^n h\) increase with \(n\).
The iterates are bounded above by \(c + L_0 L_1/(L_0 + L_1)\), so they converge, and the limit solves (27.4).
27.3. Implementation#
First, we will construct a jitclass to store the parameters of the model
wf_data = [('a0', float64),          # Parameters of beta distributions
           ('b0', float64),
           ('a1', float64),
           ('b1', float64),
           ('c', float64),           # Cost of another draw
           ('π_grid_size', int64),
           ('L0', float64),          # Cost of selecting f0 when f1 is true
           ('L1', float64),          # Cost of selecting f1 when f0 is true
           ('π_grid', float64[:]),
           ('mc_size', int64),
           ('z0', float64[:]),
           ('z1', float64[:])]
@jitclass(wf_data)
class WaldFriedman:

    def __init__(self,
                 c=1.25,
                 a0=1,
                 b0=1,
                 a1=3,
                 b1=1.2,
                 L0=25,
                 L1=25,
                 π_grid_size=200,
                 mc_size=1000,
                 seed=1234):

        self.a0, self.b0 = a0, b0
        self.a1, self.b1 = a1, b1
        self.c, self.π_grid_size = c, π_grid_size
        self.L0, self.L1 = L0, L1
        self.π_grid = np.linspace(0, 1, π_grid_size)
        self.mc_size = mc_size

        np.random.seed(seed)   # Monte Carlo draws used to compute E[J(π')]
        self.z0 = np.random.beta(a0, b0, mc_size)
        self.z1 = np.random.beta(a1, b1, mc_size)

    def f0(self, x):

        return p(x, self.a0, self.b0)

    def f1(self, x):

        return p(x, self.a1, self.b1)

    def f0_rvs(self):
        return np.random.beta(self.a0, self.b0)

    def f1_rvs(self):
        return np.random.beta(self.a1, self.b1)

    def κ(self, z, π):
        """
        Updates π using Bayes' rule and the current observation z
        """

        f0, f1 = self.f0, self.f1

        π_f0, π_f1 = (1 - π) * f0(z), π * f1(z)
        π_new = π_f1 / (π_f0 + π_f1)

        return π_new
As in Optimal Savings III: Stochastic Returns, to approximate a continuous value function
We iterate at a finite grid of possible values of \(\pi\).
When we evaluate \(\mathbb E[J(\pi')]\) between grid points, we use linear interpolation.
We define the operator function Q below.
@jit(nopython=True, parallel=True)
def Q(h, wf):

    c, π_grid = wf.c, wf.π_grid
    L0, L1 = wf.L0, wf.L1
    z0, z1 = wf.z0, wf.z1
    mc_size = wf.mc_size

    κ = wf.κ

    h_new = np.empty_like(π_grid)
    h_func = lambda p: np.interp(p, π_grid, h)

    for i in prange(len(π_grid)):
        π = π_grid[i]

        # Find the expected value of J by integrating over z
        integral_f0, integral_f1 = 0, 0
        for m in range(mc_size):
            π_0 = κ(z0[m], π)  # Draw z from f0 and update π
            integral_f0 += min(π_0 * L0, (1 - π_0) * L1, h_func(π_0))

            π_1 = κ(z1[m], π)  # Draw z from f1 and update π
            integral_f1 += min(π_1 * L0, (1 - π_1) * L1, h_func(π_1))

        integral = ((1 - π) * integral_f0 + π * integral_f1) / mc_size

        h_new[i] = c + integral

    return h_new
To solve the key functional equation, we will iterate using Q to find the fixed point
@jit
def solve_model(wf, tol=1e-4, max_iter=1000):
    """
    Compute the continuation cost function

    * wf is an instance of WaldFriedman
    """

    # Set up loop
    h = np.zeros(len(wf.π_grid))
    i = 0
    error = tol + 1

    while i < max_iter and error > tol:
        h_new = Q(h, wf)
        error = np.max(np.abs(h - h_new))
        i += 1
        h = h_new

    if error > tol:
        print("Failed to converge!")

    return h_new
27.4. Analysis#
Let’s inspect outcomes.
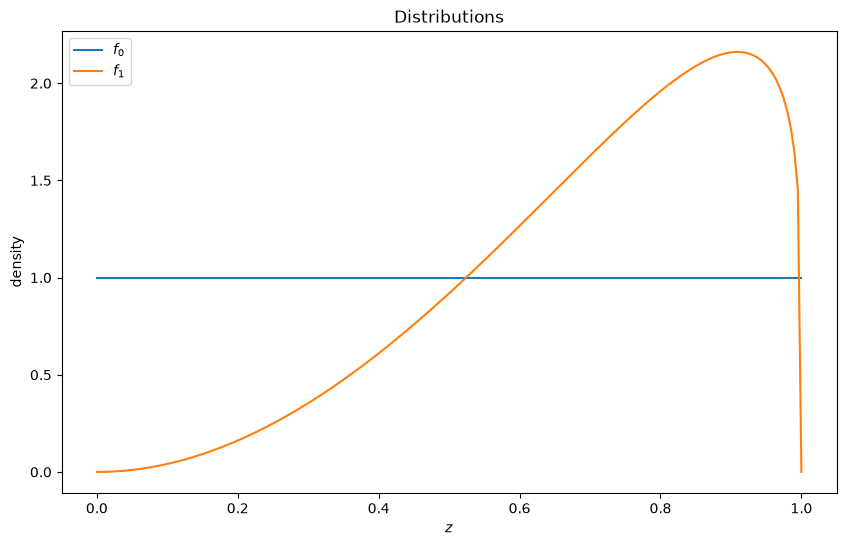
We will be using the default parameterization with distributions like so
wf = WaldFriedman()

z_grid = np.linspace(0, 1, 200)
fig, ax = plt.subplots(figsize=(10, 6))
ax.plot(z_grid, wf.f0(z_grid), label="$f_0$")
ax.plot(z_grid, wf.f1(z_grid), label="$f_1$")
ax.set(ylabel="density", xlabel="$z$", title="Distributions")
ax.legend()

plt.show()
27.4.1. Cost Function#
To solve the model, we will call our solve_model function
h_star = solve_model(wf) # Solve the model
We will also set up a function to compute the cutoffs \(A\) and \(B\) and plot these on our cost function plot
@jit
def find_cutoff_rule(wf, h):

    """
    This function takes a continuation cost function and returns the
    corresponding cutoffs of where you transition between continuing and
    choosing a specific model
    """

    π_grid = wf.π_grid
    L0, L1 = wf.L0, wf.L1

    # Evaluate cost at all points on grid for choosing a model
    cost_f0 = π_grid * L0
    cost_f1 = (1 - π_grid) * L1

    # Find B: largest π where cost_f0 <= min(cost_f1, h)
    optimal_cost = np.minimum(np.minimum(cost_f0, cost_f1), h)
    choose_f0 = (cost_f0 <= cost_f1) & (cost_f0 <= h)

    if np.any(choose_f0):
        B = π_grid[choose_f0][-1]  # Last point where we choose f0
    else:
        assert False, "No point where we choose f0"

    # Find A: smallest π where cost_f1 <= min(cost_f0, h)
    choose_f1 = (cost_f1 <= cost_f0) & (cost_f1 <= h)

    if np.any(choose_f1):
        A = π_grid[choose_f1][0]  # First point where we choose f1
    else:
        assert False, "No point where we choose f1"

    return (B, A)

B, A = find_cutoff_rule(wf, h_star)
cost_L0 = wf.π_grid * wf.L0
cost_L1 = (1 - wf.π_grid) * wf.L1

fig, ax = plt.subplots(figsize=(10, 6))

ax.plot(wf.π_grid, h_star, label='sample again')
ax.plot(wf.π_grid, cost_L1, label='choose f1')
ax.plot(wf.π_grid, cost_L0, label='choose f0')
ax.plot(wf.π_grid,
        np.amin(np.column_stack([h_star, cost_L0, cost_L1]),axis=1),
        lw=15, alpha=0.1, color='b', label=r'$J(\pi)$')

ax.annotate(r"$B$", xy=(B + 0.01, 0.5), fontsize=14)
ax.annotate(r"$A$", xy=(A + 0.01, 0.5), fontsize=14)

plt.vlines(B, 0, (1 - B) * wf.L1, linestyle="--")
plt.vlines(A, 0, A * wf.L0, linestyle="--")

ax.set(xlim=(0, 1), ylim=(0, 0.5 * max(wf.L0, wf.L1)), ylabel="cost",
       xlabel=r"$\pi$", title=r"Cost function $J(\pi)$")

plt.legend(borderpad=1.1)
plt.show()
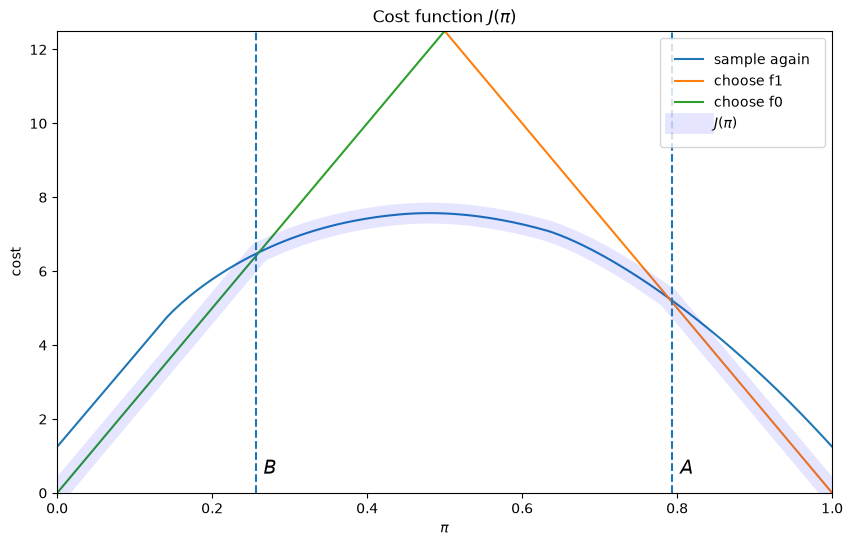
The cost function \(J\) equals \(\pi L_0\) for \(\pi \leq B\), and \((1-\pi) L_1\) for \(\pi \geq A\).
The slopes of the two linear pieces of the cost function \(J(\pi)\) are determined by \(L_0\) and \(-L_1\).
The cost function \(J\) is smooth in the interior region, where the posterior probability assigned to \(f_1\) is in the indecisive region \(\pi \in (B, A)\).
The decision-maker continues to sample until the probability that he attaches to model \(f_1\) falls below \(B\) or above \(A\).
27.4.2. The Bayesian rule is a sequential probability ratio test#
Let
be the likelihood ratio after the \(k+1\) observations \(z_0, \ldots, z_k\).
We write \(\Lambda_k\) rather than \(L_k\) because \(L_0\) and \(L_1\) denote losses in this lecture.
Iterating on Bayes’ law, as in Likelihood Ratio Processes and Bayesian Learning, gives
The posterior \(\pi_k\) is a strictly increasing function of \(\Lambda_k\).
Therefore \(\pi_k \geq A\) if and only if \(\Lambda_k \geq A_\Lambda\), and \(\pi_k \leq B\) if and only if \(\Lambda_k \leq B_\Lambda\), where
The Bayesian decision rule is Wald’s sequential probability ratio test from A Problem that Stumped Milton Friedman with thresholds \(A_\Lambda\) and \(B_\Lambda\) on the likelihood ratio.
The thresholds do not depend on \(k\) because \(J\) and \(h\) do not depend on time.
Wald and Wolfowitz [1948] used this connection in the other direction.
They showed that every sequential probability ratio test is a Bayes rule for a problem of this kind with suitably chosen losses and cost per draw.
They used that fact to prove that no other test with the same or smaller error probabilities has a smaller expected number of draws under \(f_0\) or under \(f_1\).
Arrow et al. [1949] characterized Bayes and minimax solutions of more general sequential decision problems.
For our default parameters and \(\pi_{-1} = 0.5\), the thresholds are
def LR_thresholds(B, A, π_minus_1=0.5):
    """Map thresholds on π into thresholds on the likelihood ratio."""
    prior_odds = (1 - π_minus_1) / π_minus_1
    return prior_odds * B / (1 - B), prior_odds * A / (1 - A)

B_Λ, A_Λ = LR_thresholds(B, A)
print(f"B = {B:.3f}, A = {A:.3f}")
print(f"B_Λ = {B_Λ:.2f}, A_Λ = {A_Λ:.2f}")
B = 0.256, A = 0.794
B_Λ = 0.34, A_Λ = 3.85
Exercise 27.1 compares the error probabilities of this test with the ones that Wald’s formulas in A Problem that Stumped Milton Friedman imply.
27.4.3. Simulations#
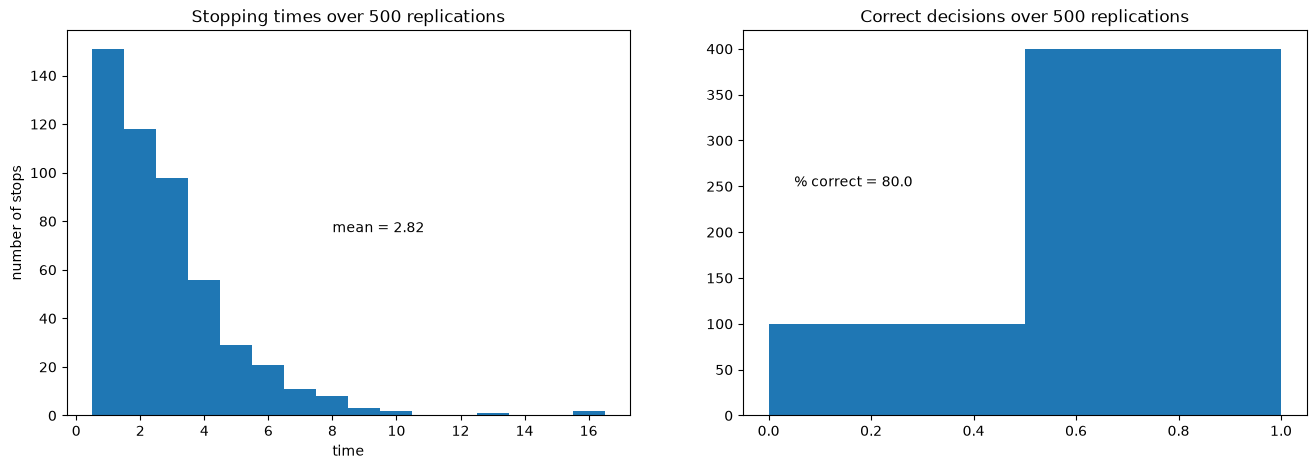
The next figure shows the outcomes of 500 simulations of the decision process.
In all 500 simulations, \(f_0\) generates the data, and the decision maker starts from the prior \(\pi_{-1} = 0.5\).
On the left is a histogram of stopping times, i.e., the number of draws of \(z_k\) required to make a decision.
The average number of draws is 2.82.
On the right is the fraction of correct decisions at the stopping time.
In this case, the decision-maker is correct 80% of the time.
@jit
def seed_numba(seed):
    """Seed the random number generator used by numba-compiled code."""
    np.random.seed(seed)

def simulate(wf, true_dist, h_star, π_0=0.5):

    """
    This function takes an initial condition and simulates until it
    stops (when a decision is made)
    """

    f0, f1 = wf.f0, wf.f1
    f0_rvs, f1_rvs = wf.f0_rvs, wf.f1_rvs
    π_grid = wf.π_grid
    κ = wf.κ

    if true_dist == "f0":
        f, f_rvs = wf.f0, wf.f0_rvs
    elif true_dist == "f1":
        f, f_rvs = wf.f1, wf.f1_rvs

    # Find cutoffs
    B, A = find_cutoff_rule(wf, h_star)

    # Initialize a couple of useful variables
    decision_made = False
    π = π_0
    t = 0

    while decision_made is False:
        z = f_rvs()
        t = t + 1
        π = κ(z, π)
        if π <= B:
            decision_made = True
            decision = 0
        elif π >= A:
            decision_made = True
            decision = 1

    if true_dist == "f0":
        if decision == 0:
            correct = True
        else:
            correct = False

    elif true_dist == "f1":
        if decision == 1:
            correct = True
        else:
            correct = False

    return correct, π, t

def stopping_dist(wf, h_star, ndraws=250, true_dist="f0", seed=0):

    """
    Simulates repeatedly to get distributions of time needed to make a
    decision and how often they are correct
    """

    seed_numba(seed)
    tdist = np.empty(ndraws, int)
    cdist = np.empty(ndraws, bool)

    for i in range(ndraws):
        correct, π, t = simulate(wf, true_dist, h_star)
        tdist[i] = t
        cdist[i] = correct

    return cdist, tdist

def simulation_plot(wf):
    h_star = solve_model(wf)
    ndraws = 500
    cdist, tdist = stopping_dist(wf, h_star, ndraws)

    fig, ax = plt.subplots(1, 2, figsize=(16, 5))

    counts, _, _ = ax[0].hist(tdist, bins=np.arange(1, np.max(tdist) + 2) - 0.5)
    ax[0].set_title(f"Stopping times over {ndraws} replications")
    ax[0].set(xlabel="time", ylabel="number of stops")
    ax[0].annotate(f"mean = {np.mean(tdist):.2f}",
                   xy=(max(tdist) / 2, max(counts) / 2))

    ax[1].hist(cdist.astype(int), bins=2)
    ax[1].set_title(f"Correct decisions over {ndraws} replications")
    ax[1].annotate(f"% correct = {100 * np.mean(cdist):.1f}",
                   xy=(0.05, ndraws / 2))

    plt.show()

simulation_plot(wf)
27.4.4. Comparative Statics#
Now let’s consider the following exercise.
We double the cost of drawing an additional observation.
Before you look, think about what will happen:
Will the decision-maker be correct more or less often?
Will he make decisions sooner or later?
wf = WaldFriedman(c=2.5)
simulation_plot(wf)
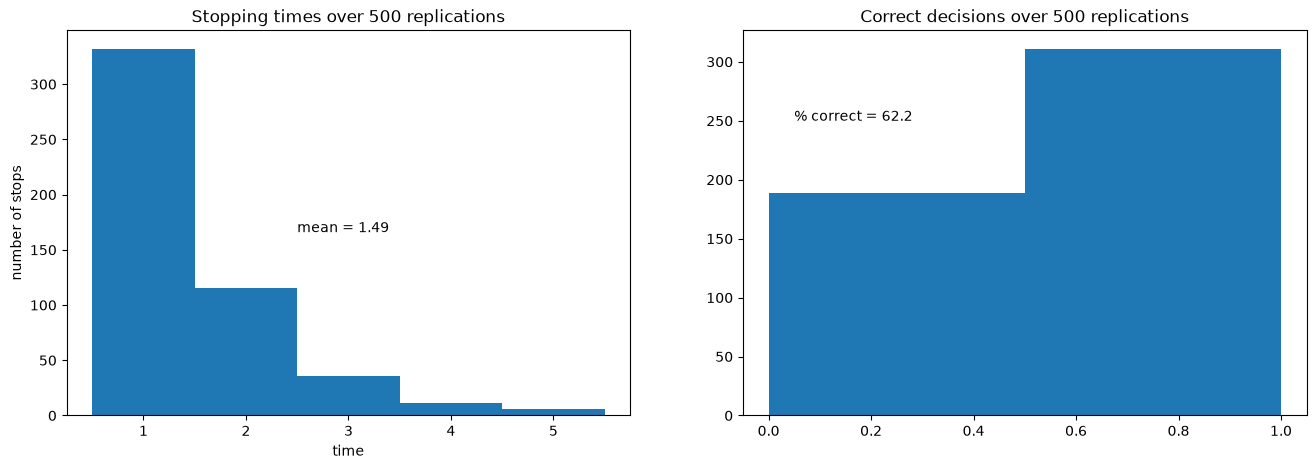
Increased cost per draw has induced the decision-maker to take fewer draws before deciding.
Because he decides with fewer draws, the percentage of time he is correct drops.
This leads to him having a higher expected loss when he puts equal weight on both models.
The code below computes \(J(0.5)\) and the mean number of draws \(\mathbb E[N]\) when \(\pi_{-1} = 0.5\) for both values of \(c\).
Because the prior puts equal weight on \(f_0\) and \(f_1\), \(\mathbb E[N]\) averages simulated mean stopping times under \(f_0\) and under \(f_1\).
def J_and_mean_N(c, ndraws=5000):
    """J(0.5) and the mean number of draws when π_{-1} = 0.5."""
    wf_c = WaldFriedman(c=c)
    h_c = solve_model(wf_c)
    S = np.minimum(wf_c.π_grid * wf_c.L0, (1 - wf_c.π_grid) * wf_c.L1)
    J_half = np.interp(0.5, wf_c.π_grid, np.minimum(S, h_c))
    _, t0 = stopping_dist(wf_c, h_c, ndraws, "f0", seed=1)
    _, t1 = stopping_dist(wf_c, h_c, ndraws, "f1", seed=2)
    return J_half, 0.5 * (t0.mean() + t1.mean())

for c in (1.25, 2.5):
    J_half, mean_N = J_and_mean_N(c)
    print(f"c = {c}: J(0.5) = {J_half:.2f}, E[N] = {mean_N:.2f}")
c = 1.25: J(0.5) = 7.56, E[N] = 3.34
c = 2.5: J(0.5) = 10.42, E[N] = 1.49
Doubling \(c\) raises \(J(0.5)\) from 7.56 to 10.42.
The envelope theorem accounts for the size of the increase.
For a fixed decision rule, the expected loss equals \(c \, \mathbb E[N]\) plus the expected loss from wrong decisions, a linear function of \(c\) with slope \(\mathbb E[N]\).
\(J\) is the minimum of these linear functions over decision rules, so \(dJ/dc = \mathbb E[N^*]\) at every \(c\) where \(J\) is differentiable; \(N^*\) is the number of draws under the optimal rule.
\(\mathbb E[N^*]\) falls from 3.34 to 1.49 as \(c\) rises from 1.25 to 2.5, so the increase in \(J(0.5)\) lies between \(1.25 \times 1.49 = 1.86\) and \(1.25 \times 3.34 = 4.17\).
The exercises below study how \(c\), \(L_0\), and \(L_1\) shape the thresholds \(B\) and \(A\) and the error probabilities of the Bayesian decision rule.
27.5. Exercises#
Exercise 27.1
Use the default parameters, \(\pi_{-1} = 0.5\), and the thresholds \(B_\Lambda\) and \(A_\Lambda\) that we computed above.
Simulate the Bayesian decision rule 20,000 times under \(f_0\) and 20,000 times under \(f_1\), and estimate its type I error probability \(\alpha\) (accepting \(f_1\) when \(f_0\) generates the data) and its type II error probability \(\beta\) (accepting \(f_0\) when \(f_1\) generates the data).
In A Problem that Stumped Milton Friedman, Wald’s inequalities \(\alpha \leq (1-\beta)/A\) and \(\beta \leq B(1-\alpha)\) hold with equality when the likelihood ratio never jumps past its thresholds. Use those equalities with \(A = A_\Lambda\) and \(B = B_\Lambda\) to compute the error probabilities that the test would have without overshoot, and compare them with your estimates.
Record \(\log \Lambda_N\) at the stopping time \(N\) and plot its distribution under \(f_0\) and under \(f_1\). Use the plot to explain the comparison in step 2.
Solution
Without overshoot, \(\alpha = (1-\beta)/A_\Lambda\) and \(\beta = B_\Lambda (1-\alpha)\).
Solving these two equations gives
With \(\pi_{-1} = 0.5\), \(\Lambda_N\) equals the posterior odds \(\pi_N / (1 - \pi_N)\) at the stopping time.
def simulate_many(wf, h_star, ndraws, true_dist, seed):
    """Correctness, terminal posterior, and stopping time of ndraws runs."""
    seed_numba(seed)
    correct = np.empty(ndraws, bool)
    π_N = np.empty(ndraws)
    N = np.empty(ndraws, int)
    for i in range(ndraws):
        correct[i], π_N[i], N[i] = simulate(wf, true_dist, h_star)
    return correct, π_N, N

wf = WaldFriedman()
h_star = solve_model(wf)
B, A = find_cutoff_rule(wf, h_star)
B_Λ, A_Λ = LR_thresholds(B, A)

correct_0, π_N0, N0 = simulate_many(wf, h_star, 20_000, "f0", seed=1)
correct_1, π_N1, N1 = simulate_many(wf, h_star, 20_000, "f1", seed=2)
α_hat, β_hat = 1 - correct_0.mean(), 1 - correct_1.mean()

α_wald = (1 - B_Λ) / (A_Λ - B_Λ)
β_wald = B_Λ * (A_Λ - 1) / (A_Λ - B_Λ)

print(f"simulated:           α = {α_hat:.3f}, β = {β_hat:.3f}")
print(f"without overshoot:   α = {α_wald:.3f}, β = {β_wald:.3f}")

log_Λ0 = np.log(π_N0 / (1 - π_N0))
log_Λ1 = np.log(π_N1 / (1 - π_N1))
log_Λ = np.concatenate((log_Λ0, log_Λ1))
above = log_Λ >= np.log(A_Λ)
print(f"mean of log Λ_N - log A_Λ when the test accepts f1: "
      f"{np.mean(log_Λ[above] - np.log(A_Λ)):.2f}")
print(f"mean of log B_Λ - log Λ_N when the test accepts f0: "
      f"{np.mean(np.log(B_Λ) - log_Λ[~above]):.2f}")
print(f"runs with log Λ_N < -8: {np.sum(log_Λ0 < -8)} under f0, "
      f"{np.sum(log_Λ1 < -8)} under f1")

fig, axes = plt.subplots(1, 2, figsize=(12, 4), sharey=True)
for ax, x, title in zip(axes, (log_Λ0, log_Λ1),
                        ("data from $f_0$", "data from $f_1$")):
    ax.hist(x, bins=np.linspace(-8, 3, 111), density=True, alpha=0.7)
    ax.axvline(np.log(A_Λ), color='C1', linestyle='--',
               label=r'$\log A_\Lambda$')
    ax.axvline(np.log(B_Λ), color='C2', linestyle='--',
               label=r'$\log B_\Lambda$')
    ax.set_title(title)
    ax.set_xlabel(r'$\log \Lambda_N$')
    ax.legend()
plt.tight_layout()
plt.show()
simulated:           α = 0.176, β = 0.095
without overshoot:   α = 0.187, β = 0.280
mean of log Λ_N - log A_Λ when the test accepts f1: 0.29
mean of log B_Λ - log Λ_N when the test accepts f0: 1.83
runs with log Λ_N < -8: 494 under f0, 0 under f1
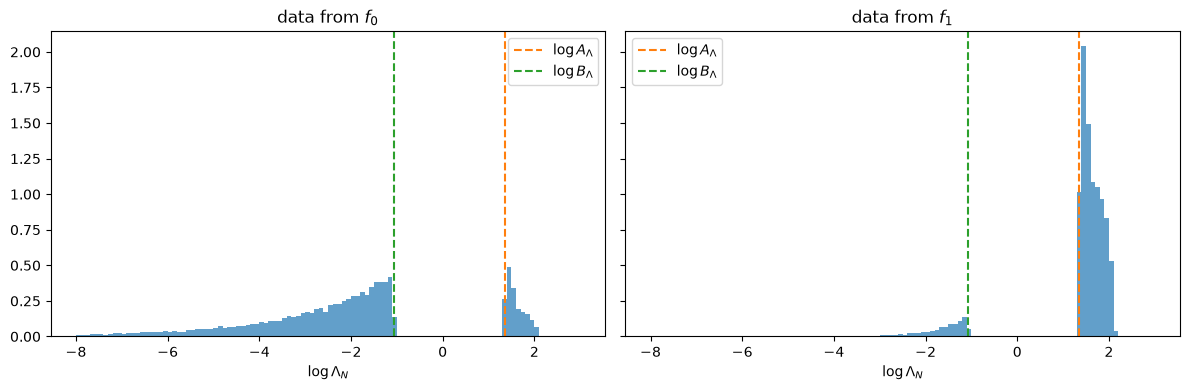
The histograms omit the 494 runs under \(f_0\) in which \(\log \Lambda_N < -8\).
The simulated \(\beta\) is far below the value without overshoot, and the simulated \(\alpha\) is somewhat below it.
On average, \(\log \Lambda_N\) exceeds \(\log A_\Lambda\) by 0.29 when the test accepts \(f_1\) and falls short of \(\log B_\Lambda\) by 1.83 when the test accepts \(f_0\).
Because \(f_0\) is uniform, the likelihood ratio of a single draw is \(f_1(z)\).
The density \(f_1(z)\) never exceeds 2.16, so one draw raises \(\log \Lambda\) by at most \(\log 2.16 = 0.77\), and \(\log \Lambda_N\) lands only a little above \(\log A_\Lambda\).
The density \(f_1(z)\) goes to zero as \(z \to 0\), so one draw can lower \(\log \Lambda\) by an arbitrarily large amount, and \(\log \Lambda_N\) often lands far below \(\log B_\Lambda\).
The change of measure in A Problem that Stumped Milton Friedman gives \(\beta = E_0[\Lambda_N \mathbf{1}\{\Lambda_N \leq B_\Lambda\}]\), so the further \(\Lambda_N\) falls below \(B_\Lambda\), the smaller \(\beta\) is relative to \(B_\Lambda (1 - \alpha)\).
Exercise 27.2
Let \(S(\pi) = \min \{ \pi L_0, (1-\pi) L_1 \}\) be the stopping loss.
Holding the other parameters at their defaults, solve the model for values of \(c\) between 0.5 and 5, and plot \(B(c)\) and \(A(c)\).
Show that the continuation region is empty if and only if \(c \geq \bar c = \max_\pi \{ S(\pi) - \mathbb E [S(\pi')] \}\), the largest expected reduction in the stopping loss that one more draw delivers.
Compute \(\bar c\) and compare it with the values of \(c\) at which your solutions in step 1 have an empty continuation region.
Solution
Suppose that \(c < S(\pi) - \mathbb E [S(\pi')]\) for some \(\pi\).
Since \(J \leq S\), \(h(\pi) = c + \mathbb E [J(\pi')] \leq c + \mathbb E [S(\pi')] < S(\pi)\), so drawing again is optimal at \(\pi\).
Suppose instead that \(c \geq S(\pi) - \mathbb E [S(\pi')]\) for every \(\pi\).
Let \(p_n\) be the posterior probability of \(f_1\) after \(n\) draws, with \(p_0 = \pi_{-1}\).
Then \(\mathbb E [c (n+1) + S(p_{n+1}) | p_n] \geq c n + S(p_n)\), so \(c n + S(p_n)\) is a submartingale under the decision maker’s beliefs.
By the optional stopping theorem, \(\mathbb E [c N + S(p_N)] \geq S(p_0)\) for every stopping rule \(N\) with finite mean.
No rule improves on stopping immediately, so the continuation region is empty.
def one_draw_value(wf):
    """S(π) - E[S(π')] on the grid, using the Monte Carlo draws in wf."""
    S = lambda π: np.minimum(π * wf.L0, (1 - π) * wf.L1)
    values = np.empty(len(wf.π_grid))
    for i, π in enumerate(wf.π_grid):
        ES = ((1 - π) * S(wf.κ(wf.z0, π)).mean()
              + π * S(wf.κ(wf.z1, π)).mean())
        values[i] = S(π) - ES
    return values

c_bar = one_draw_value(WaldFriedman()).max()
print(f"c̄ = {c_bar:.2f}")

c_grid = np.linspace(0.5, 5, 10)
B_c, A_c, empty = [], [], []
for c in c_grid:
    wf_c = WaldFriedman(c=c)
    h_c = solve_model(wf_c)
    B_val, A_val = find_cutoff_rule(wf_c, h_c)
    S_grid = np.minimum(wf_c.π_grid * wf_c.L0, (1 - wf_c.π_grid) * wf_c.L1)
    B_c.append(B_val)
    A_c.append(A_val)
    empty.append(not np.any(h_c < S_grid))

print("c values with an empty continuation region:",
      np.round(c_grid[np.array(empty)], 2))

fig, ax = plt.subplots()
ax.plot(c_grid, B_c, 'o-', lw=2, label='$B(c)$')
ax.plot(c_grid, A_c, 's-', lw=2, label='$A(c)$')
ax.fill_between(c_grid, B_c, A_c, alpha=0.2, label='draw again')
ax.axvline(c_bar, color='black', linestyle='--', lw=1, label=r'$\bar c$')
ax.set_xlabel('$c$')
ax.set_ylabel(r'$\pi$')
ax.legend(loc='upper right')
plt.tight_layout()
plt.show()
c̄ = 4.24
c values with an empty continuation region: [4.5 5. ]
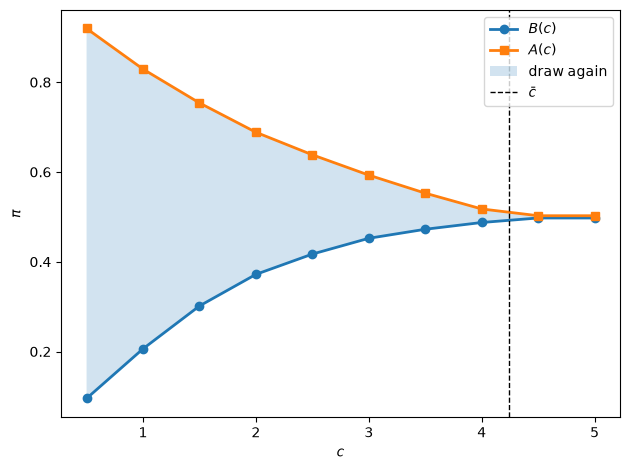
As \(c\) rises, \(B(c)\) rises and \(A(c)\) falls, and the continuation region shrinks.
The region vanishes at \(\bar c = 4.24\), far below the bound \(L_0 L_1 / (L_0 + L_1) = 12.5\) that we derived from \(h \geq c\).
When the region is empty, find_cutoff_rule returns the two grid points next to \(\hat \pi = 0.5\).
Exercise 27.3
Set \((L_0, L_1)\) to \((50, 25)\), \((25, 25)\), and \((25, 50)\) in turn, holding the other parameters at their defaults.
For each setting, compute \(B\), \(A\), \(B_\Lambda\), and \(A_\Lambda\) with \(\pi_{-1} = 0.5\), and estimate \(\alpha\), \(\beta\), and the mean stopping times under \(f_0\) and under \(f_1\) by simulation.
Explain how the thresholds and the error probabilities respond to \(L_0\) and \(L_1\).
Solution
We reuse simulate_many from the solution to Exercise 27.1.
for L0, L1 in [(50, 25), (25, 25), (25, 50)]:
    wf_L = WaldFriedman(L0=L0, L1=L1)
    h_L = solve_model(wf_L)
    B_val, A_val = find_cutoff_rule(wf_L, h_L)
    B_Λ_val, A_Λ_val = LR_thresholds(B_val, A_val)
    correct_0, _, N0 = simulate_many(wf_L, h_L, 20_000, "f0", seed=1)
    correct_1, _, N1 = simulate_many(wf_L, h_L, 20_000, "f1", seed=2)
    print(f"L0 = {L0}, L1 = {L1}: B = {B_val:.3f}, A = {A_val:.3f}, "
          f"B_Λ = {B_Λ_val:.2f}, A_Λ = {A_Λ_val:.2f}, "
          f"α = {1 - correct_0.mean():.3f}, β = {1 - correct_1.mean():.3f}, "
          f"E_0[N] = {N0.mean():.2f}, E_1[N] = {N1.mean():.2f}")
L0 = 50, L1 = 25: B = 0.116, A = 0.774, B_Λ = 0.13, A_Λ = 3.42, α = 0.214, β = 0.035, E_0[N] = 3.68, E_1[N] = 3.99
L0 = 25, L1 = 25: B = 0.256, A = 0.794, B_Λ = 0.34, A_Λ = 3.85, α = 0.176, β = 0.095, E_0[N] = 2.88, E_1[N] = 3.84
L0 = 25, L1 = 50: B = 0.302, A = 0.899, B_Λ = 0.43, A_Λ = 8.95, α = 0.070, β = 0.136, E_0[N] = 3.16, E_1[N] = 5.73
Raising \(L_1\) from 25 to 50 makes accepting \(f_1\) when \(f_0\) is true costlier.
The decision maker requires more evidence before accepting \(f_1\): \(A\) rises from 0.794 to 0.899, and \(A_\Lambda\) rises from 3.85 to 8.95.
He also accepts \(f_0\) on weaker evidence: \(B\) rises from 0.256 to 0.302, and \(B_\Lambda\) rises from 0.34 to 0.43.
The type I error probability \(\alpha\) falls from 0.176 to 0.070, and the type II error probability \(\beta\) rises from 0.095 to 0.136.
Raising \(L_0\) from 25 to 50 works in the opposite direction.
\(B\) falls from 0.256 to 0.116 and \(A\) falls from 0.794 to 0.774, so \(\beta\) falls to 0.035 and \(\alpha\) rises to 0.214.
In both cases the mean stopping times rise because a larger loss from one kind of error makes evidence more valuable.