35. Survival and Long-Run Dynamics under Recursive Preferences#
35.1. Overview#
This lecture studies the theory of long-run survival in Borovička [2020].
The classical market selection hypothesis says that agents with less accurate beliefs are driven out of the market in the long run.
Sandroni [2000] and Blume and Easley [2006] established this result for economies with separable expected-utility preferences and aggregate endowment bounded above and away from zero.
Borovička shows that the conclusion can fail under Epstein-Zin recursive preferences.
With recursive preferences, agents with distorted beliefs can survive and can even dominate.
The key mechanism is that recursive preferences separate risk aversion from the intertemporal elasticity of substitution.
Three channels matter for survival:
The risk premium channel rewards the more optimistic agent for holding more of the risky asset.
The speculative volatility channel penalizes aggressive positions through log-return volatility.
The saving channel changes consumption and saving decisions when the IES differs from one.
Under separable preferences, risk aversion equals the inverse of the IES, and that restriction ties the three channels together.
Their sum then depends only on the relative entropies of the two agents’ beliefs, and the agent with more accurate beliefs dominates.
Under recursive preferences, the comparison of risk aversion \(\gamma\) with the inverse IES \(\rho\) determines which long-run outcomes can occur.
Both agents can survive only if \(\gamma > \rho\), which means that agents prefer early resolution of uncertainty.
Each agent can dominate with positive probability only if \(\gamma < \rho\).
An IES above one strengthens the saving channel of an optimistic agent, but coexistence does not require it.
Note
The paper builds on the continuous-time recursive utility formulation of Duffie and Epstein [1992], using the planner’s problem approach of Dumas et al. [2000].
Important foundations for the market selection hypothesis were laid by De Long et al. [1991] and Blume and Easley [1992].
We start with some imports.
import numpy as np
import matplotlib.pyplot as plt
from math import erf, sqrt
from scipy.optimize import brentq
35.2. Environment#
The economy contains two infinitely lived agents, indexed by \(n \in \{1, 2\}\).
The agents have identical recursive preferences but different beliefs about aggregate endowment growth.
We write Borovička’s belief distortions \(u^n\) as \(\omega^n\).
35.2.1. Aggregate endowment#
Under the true probability measure \(P\), aggregate endowment satisfies
where \(W\) is a standard Brownian motion, \(\mu_Y\) is the drift, and \(\sigma_Y > 0\) is the volatility.
35.2.2. Heterogeneous beliefs#
Agent \(n\) believes that the drift is \(\mu_Y + \omega^n \sigma_Y\) instead of \(\mu_Y\).
The parameter \(\omega^n\) measures optimism when \(\omega^n > 0\) and pessimism when \(\omega^n < 0\).
Agent \(n\)’s subjective probability measure \(Q^n\) is defined by the Radon–Nikodym derivative
\(M^n\) is a likelihood ratio process, a continuous-time counterpart of the processes studied in Likelihood Ratio Processes.
Under \(Q^n\), the process \(W_t^n = W_t - \omega^n t\) is a Brownian motion, and agent \(n\) perceives
An agent with \(\omega^n > 0\) is optimistic about endowment growth, while an agent with \(\omega^n < 0\) is pessimistic.
Beliefs are dogmatic: agent \(n\) never revises \(\omega^n\) as she observes \(Y\).
For each finite \(t\), \(Q^n\) and \(P\) are equivalent on \(\mathcal{F}_t\).
Under \(P\), \(\log M_t^n\) has constant drift \(-\frac{1}{2}(\omega^n)^2\), so \(M_t^n \to 0\) \(P\)-almost surely when \(\omega^n \neq 0\), and \(Q^n\) and \(P\) are mutually singular on \(\mathcal{F}_\infty\).
The Blackwell–Dubins theorem in Merging of Opinions: The Blackwell–Dubins Theorem requires absolute continuity on \(\mathcal{F}_\infty\), so it does not apply here.
An agent with \(\omega^n \neq 0\) never comes to agree with \(P\), and agents with \(\omega^1 \neq \omega^2\) never come to agree with each other.
Market selection replaces merging: the open question is whether the market eliminates the agent whose beliefs are wrong.
35.2.3. Recursive preferences#
Both agents have Epstein-Zin recursive preferences.
We use \(\gamma > 0\) for relative risk aversion, \(\rho > 0\) for the inverse of the IES, and \(\beta > 0\) for the time-preference rate.
The Duffie-Epstein-Zin felicity function is
where \(\nu\) is the endogenous discount rate.
Note
In discrete time, Epstein-Zin preferences aggregate current consumption with a certainty equivalent of future utility via a CES aggregator (see Doubts or Variability?).
In continuous time there is no “next-period \(V_{t+1}\),” so Duffie and Epstein [1992] recast the recursion as a felicity function \(F(C,\nu)\) that depends on the agent’s own continuation-value rate \(\nu\).
The two formulations encode the same separation of risk aversion \(\gamma\) from the inverse IES \(\rho\).
When \(\gamma = \rho\), preferences reduce to the standard separable CRRA case.
35.3. Planner’s problem#
Following Dumas et al. [2000], we study equilibrium allocations through a social planner’s problem.
The planner chooses consumption shares \(z^1\) and \(z^2 = 1 - z^1\) and discount-rate processes \(\nu^n\) for the two agents.
35.3.1. Modified discount factors#
It is convenient to absorb belief distortions into the modified discount factors \(\tilde{\lambda}^n = \lambda^n M^n\), where \(M^n\) is the Radon-Nikodym derivative (35.2).
These processes satisfy
Exercise 35.1
Derive (35.4).
Hint: Use \(\log \tilde{\lambda}^n = \log \lambda^n + \log M^n\). The Pareto weight \(\lambda^n\) evolves as \(d\log \lambda_t^n = -\nu_t^n \, dt\), and \(\log M_t^n\) is given by (35.2).
Solution
From the definition \(\tilde{\lambda}^n = \lambda^n M^n\), we have
The Pareto weight satisfies \(d\log \lambda_t^n = -\nu_t^n \, dt\).
From (35.2), \(\log M_t^n = -\frac{1}{2}|\omega^n|^2 t + \omega^n W_t\), so
Adding the two:
35.3.3. HJB equation#
Homotheticity reduces the planner’s problem to a nonlinear ODE in the single state variable \(\upsilon\).
Because each agent’s utility is homogeneous of degree \(1-\gamma\) in consumption, the planner’s value function is homogeneous of degree one in the weights \((\tilde{\lambda}^1, \tilde{\lambda}^2)\) and of degree \(1-\gamma\) in \(Y\).
It factors as \(J(\tilde{\lambda}, Y) = (\tilde{\lambda}^1 + \tilde{\lambda}^2) Y^{1-\gamma} \tilde{J}(\upsilon)\), eliminating \(Y\) as a state variable.
35.3.3.1. From discrete to continuous time#
In discrete time, a planner maximizes a weighted sum of agents’ utilities by choosing allocations at each date.
The Bellman equation is
Here \(\delta \in (0, 1)\) is a one-period discount factor; elsewhere in this lecture \(\beta\) is a continuous-time rate of time preference.
In continuous time, the period length shrinks to \(dt\).
The “flow payoff” over \([t, t+dt)\) becomes \(\left[\upsilon F(z^1, \nu^1) + (1-\upsilon)F(z^2, \nu^2)\right] dt\), where \(F\) is the Duffie-Epstein-Zin felicity (35.3).
The expected change in the value function over \(dt\) is captured by the infinitesimal generator \(\mathcal{L}\).
For a diffusion \(d\upsilon = m \, dt + s \, dW\), Itô’s lemma gives
where \(m\) and \(s\) are the drift and diffusion of the Pareto share.
This is the continuous-time analogue of \(\delta \, \mathbb{E}[\tilde{J}(\upsilon')] - \tilde{J}(\upsilon)\): it measures how the value function drifts and fluctuates as \(\upsilon\) evolves.
Setting flow payoff plus expected capital gain equal to zero gives the schematic HJB equation:
subject to \(z^1 + z^2 \leq 1\).
35.3.3.2. Exact reduced ODE#
Proposition 2.3 of Borovička [2020] gives the exact HJB equation after substituting the homogeneity reduction \(J(\tilde{\lambda}, Y) = (\tilde{\lambda}^1 + \tilde{\lambda}^2) Y^{1-\gamma} \tilde{J}(\upsilon)\) and the dynamics of \(\upsilon\) and \(Y\):
subject to \(z^1 + z^2 \leq 1\).
The first line is the flow payoff from the two agents’ felicity functions.
The second line multiplies \(\tilde{J}(\upsilon)\) by a term that combines the agents’ discount rates, belief-weighted endowment drift, and a variance correction – these arise from absorbing the \(Y^{1-\gamma}\) factor via Itô’s lemma.
The third line multiplies \(\tilde{J}'(\upsilon)\) by the drift of the Pareto share, which depends on the difference in discount rates and the belief-weighted response to endowment risk.
The fourth line multiplies \(\tilde{J}''(\upsilon)\) by the squared diffusion of the Pareto share.
The boundary conditions are \(\tilde{J}(0) = \tilde{V}^2\) and \(\tilde{J}(1) = \tilde{V}^1\), where \(\tilde{V}^n\) is the continuation value in the homogeneous economy populated by agent \(n\) alone.
This is the continuous-time counterpart of the discrete-time planner’s problem in Blume and Easley [2006] (see also Heterogeneous Beliefs and Financial Markets).
35.4. Survival conditions#
The central result characterizes survival by the boundary behavior of \(m_\vartheta(\upsilon)\).
Proposition 35.1
Define the following repelling conditions (i) and (ii) and their attracting counterparts (i’) and (ii’):
Then:
(a) If (i) and (ii) hold, both agents survive under \(P\).
(b) If (i) and (ii’) hold, agent 1 dominates in the long run under \(P\).
© If (i’) and (ii) hold, agent 2 dominates in the long run under \(P\).
(d) If (i’) and (ii’) hold, each agent dominates with strictly positive probability.
The proof uses the Feller classification of boundary behavior for diffusions, as in Karlin and Taylor [1981].
Condition (i) says that when agent 1 is close to extinction, there is a force pushing her share back up.
Condition (ii) says that when agent 1 is close to absorbing the whole economy, there is a force pushing her share back down.
When both forces are present, the Pareto share is recurrent and both agents survive.
35.5. Wealth dynamics decomposition#
We now rewrite the survival conditions from Proposition 35.1 in terms of equilibrium wealth dynamics.
Agent 1 survives near extinction if and only if her wealth grows faster than agent 2’s when she is negligibly small.
When \(\upsilon \searrow 0\), prices are set entirely by agent 2, as if the economy were homogeneous.
Agent 1 is a price-taker in agent 2’s economy.
Let \(m_A^n(\upsilon)\) denote the expected log growth rate of agent \(n\)’s wealth \(A^n\), so that \(d \log A_t^n = m_A^n(\upsilon_t) dt + \sigma_A^n(\upsilon_t) dW_t\).
Proposition 3.3 of Borovička [2020] links the boundary drifts of the log-odds ratio to these growth rates:
Let \(R^n\) denote the cumulative return index of agent \(n\)’s portfolio, with \(d \log R_t^n = m_R^n(\upsilon_t) dt + \sigma_R^n(\upsilon_t) dW_t\).
Thus \(m_R^n\) is the expected log return on agent \(n\)’s portfolio, and \(m_R^n + \frac{1}{2}(\sigma_R^n)^2\) is its expected arithmetic return.
Let \((y^n)^{-1}\) denote agent \(n\)’s consumption-wealth ratio.
The difference in wealth growth rates decomposes into two channels:
The first term measures how much faster agent 1’s portfolio grows.
The second measures how much less agent 1 consumes out of wealth – a lower consumption-wealth ratio means more saving and faster wealth accumulation.
When this total difference is positive, condition (i) holds and agent 1 survives near extinction.
When it is negative, the boundary \(\upsilon = 0\) attracts.
Agent 1 then becomes extinct almost surely if condition (ii) also holds (case ©), and with strictly positive probability if condition (ii’) holds (case (d)).
Exercise 35.3
Derive (35.10).
Let \(A^n\) denote agent \(n\)’s wealth and \(C^n\) her consumption.
Let \(R^n\) be the cumulative return index of her portfolio, with \(d\log R^n = m_R^n \, dt + \sigma_R^n \, dW\), so that \(m_R^n\) is her expected log portfolio return.
The budget constraint is \(dA^n = A^n \, dR^n / R^n - C^n dt\).
Define the consumption-wealth ratio \((y^n)^{-1} = C^n / A^n\).
Show that \(d\log A^n = \left(m_R^n - (y^n)^{-1}\right) dt + \sigma_R^n \, dW\), so the difference in expected log wealth growth is \(m_A^1 - m_A^2 = (m_R^1 - m_R^2) + [(y^2)^{-1} - (y^1)^{-1}]\).
Solution
By Itô’s lemma applied to \(R^n = \exp(\log R^n)\), the instantaneous return is
Dividing the budget constraint by \(A^n\):
By Itô’s lemma, \(d\log A^n = \frac{dA^n}{A^n} - \frac{1}{2}\left(\frac{dA^n}{A^n}\right)^2\), and \(\left(dA^n/A^n\right)^2 = (\sigma_R^n)^2 dt\).
Then
so \(m_A^n = m_R^n - (y^n)^{-1}\).
Taking the difference for agents 1 and 2 gives
and passing to the limit \(\upsilon \searrow 0\) gives (35.10).
35.5.1. Portfolio returns#
At the boundary \(\upsilon \searrow 0\), the difference in expected log portfolio returns is
An optimistic agent (\(\omega^1 > \omega^2\)) overweights the risky asset by \((\omega^1 - \omega^2)/(\gamma \sigma_Y)\) relative to agent 2 and earns the equity risk premium on that extra exposure.
The subtracted volatility penalty reflects the cost of holding a more extreme portfolio: higher variance of log returns drags down expected log wealth growth.
This term depends on risk aversion \(\gamma\) but not on the IES, because portfolio choice is determined by risk aversion alone.
Exercise 35.4
Derive (35.11).
At the boundary \(\upsilon \searrow 0\), agent \(n\)’s optimal risky-asset share is \(\pi^n = 1 + (\omega^n - \omega^2)/(\gamma \sigma_Y)\) (see (35.15)).
Let \(r\) denote the risk-free rate and \(\bar{\mu}_R = r + \gamma \sigma_Y^2 - \omega^2 \sigma_Y\) the expected arithmetic return on the risky asset under \(P\).
(Using (35.13) and (35.14), \(\bar{\mu}_R\) equals the expected capital gain \(\mu_Y + \frac{1}{2}\sigma_Y^2\) plus the dividend yield \((y(0))^{-1}\).)
The continuously rebalanced portfolio has expected log return \(m_R^n = r + \pi^n(\bar{\mu}_R - r) - \frac{1}{2}(\pi^n)^2 \sigma_Y^2\).
Compute \(m_R^1 - m_R^2\) and simplify.
Solution
Using \(m_R^n = r + \pi^n(\bar{\mu}_R - r) - \frac{1}{2}(\pi^n)^2 \sigma_Y^2\), the difference is
The difference in risky shares is \(\pi^1 - \pi^2 = (\omega^1 - \omega^2)/(\gamma \sigma_Y)\).
The arithmetic equity premium is \(\bar{\mu}_R - r = \gamma \sigma_Y^2 - \omega^2 \sigma_Y\), so:
For the volatility term, write \((\pi^1)^2 - (\pi^2)^2 = (\pi^1 - \pi^2)(\pi^1 + \pi^2)\) and use \(\pi^2 = 1\), so \(\pi^1 + \pi^2 = 2 + (\omega^1 - \omega^2)/(\gamma \sigma_Y)\).
After simplification:
Combining the two pieces gives (35.11).
35.5.2. Consumption-wealth ratios#
The difference in consumption-wealth ratios at the boundary is
The term in brackets is the gap between the subjective certainty-equivalent returns that the two agents expect to earn on their optimal portfolios.
Under her own beliefs \(Q^n\), agent \(n\) perceives the Sharpe ratio \(\lambda^n = \gamma \sigma_Y + \omega^n - \omega^2\) on the risky asset.
Her optimal portfolio earns the certainty-equivalent return \(r + (\lambda^n)^2/(2\gamma)\), and the term in brackets equals \([(\lambda^1)^2 - (\lambda^2)^2]/(2\gamma)\).
The bracket also equals half the gap between the agents’ subjective expected arithmetic portfolio returns.
The factor \((1-\rho)/\rho\) translates this perceived return advantage into a saving response.
When IES \(> 1\) (\(\rho < 1\)), the factor is positive: a higher perceived return makes the agent save more, because the substitution effect dominates the income effect.
When IES \(< 1\) (\(\rho > 1\)), the factor is negative: the income effect dominates and the agent saves less, working against survival.
When IES \(= 1\) (\(\rho = 1\)), the two effects cancel and the saving channel vanishes entirely.
This is the channel through which recursive preferences alter survival outcomes by separating \(\gamma\) from \(\rho\).
Exercise 35.5
Derive (35.12).
At the boundary \(\upsilon \searrow 0\), both agents take as given the risk-free rate \(r\) and a risky asset with volatility \(\sigma_Y\) and expected excess return \(\gamma \sigma_Y^2 - \omega^2 \sigma_Y\) under \(P\).
Show that under \(Q^n\) agent \(n\) perceives the Sharpe ratio \(\lambda^n = \gamma\sigma_Y + \omega^n - \omega^2\). A portfolio with risky share \(\pi\) has subjective certainty-equivalent return \(r + \pi \sigma_Y \lambda^n - \frac{1}{2}\gamma \pi^2 \sigma_Y^2\). Show that the optimal share reproduces (35.15) and that the maximized certainty-equivalent return is \(\mathrm{CE}^n = r + (\lambda^n)^2/(2\gamma)\).
Let \(c^n = (y^n)^{-1}\) and let \(\mu_V^n = \mathrm{CE}^n - c^n\) be the subjective certainty-equivalent growth rate of agent \(n\)’s wealth, which is also that of her consumption. Use the Hamilton-Jacobi-Bellman equation of an Epstein-Zin investor facing constant investment opportunities to show that \(c^n = \beta - (1-\rho)\mu_V^n\), and hence \(\mu_V^n = (\mathrm{CE}^n - \beta)/\rho\).
Show that \(\mu_V^2 = \mu_Y + \omega^2\sigma_Y + \frac{1}{2}(1-\gamma)\sigma_Y^2\), so that \(c^2\) reproduces (35.14).
Deduce (35.12).
Hint: For step 2, use the normalized Duffie-Epstein aggregator
and guess \(V(A) = (\kappa A)^{1-\gamma}/(1-\gamma)\) for a constant \(\kappa > 0\).
Solution
Step 1. Under \(Q^n\), \(dW = dW^n + \omega^n dt\).
The risky asset’s instantaneous return, \((r + \gamma\sigma_Y^2 - \omega^2\sigma_Y)dt + \sigma_Y dW\), becomes \((r + \gamma\sigma_Y^2 - \omega^2\sigma_Y + \omega^n\sigma_Y)dt + \sigma_Y dW^n\).
Its subjective Sharpe ratio is therefore \(\lambda^n = \gamma\sigma_Y + \omega^n - \omega^2\).
The certainty-equivalent return \(r + \pi\sigma_Y\lambda^n - \frac{1}{2}\gamma\pi^2\sigma_Y^2\) is maximized at \(\pi^n = \lambda^n/(\gamma\sigma_Y) = 1 + (\omega^n - \omega^2)/(\gamma\sigma_Y)\), which is (35.15).
The maximized value is \(\mathrm{CE}^n = r + (\lambda^n)^2/(2\gamma)\).
Step 2. Under \(Q^n\), wealth satisfies \(dA = A\left[(r + \pi\sigma_Y\lambda^n - c)dt + \pi\sigma_Y dW^n\right]\).
With \(V(A) = (\kappa A)^{1-\gamma}/(1-\gamma)\), we have \(((1-\gamma)V)^{1/(1-\gamma)} = \kappa A\) and the HJB equation is
Dividing by \((\kappa A)^{1-\gamma}\) gives
The first-order condition for \(c\) is \(\beta (c/\kappa)^{-\rho}/\kappa = 1\), which implies \((c/\kappa)^{1-\rho} = c/\beta\).
Substituting this and the optimal \(\pi\) into the HJB equation gives
which rearranges to \(c^n = \beta - (1-\rho)(\mathrm{CE}^n - c^n) = \beta - (1-\rho)\mu_V^n\).
Solving the same equation for \(c^n\) gives \(\rho c^n = \beta - (1-\rho)\mathrm{CE}^n\), so \(\mu_V^n = \mathrm{CE}^n - c^n = (\mathrm{CE}^n - \beta)/\rho\).
The quantity \(\mu_V^n\) is the subjective certainty-equivalent growth rate of wealth.
Under \(Q^n\), \(d\log A\) has drift \(r + \pi\sigma_Y\lambda^n - c - \frac{1}{2}\pi^2\sigma_Y^2\) and volatility \(\pi\sigma_Y\).
Adding the risk adjustment \(\frac{1}{2}(1-\gamma)\pi^2\sigma_Y^2\) and evaluating at \(\pi^n\) gives \(\mathrm{CE}^n - c^n\).
Step 3. For agent 2, \(\lambda^2 = \gamma\sigma_Y\), so \(\mathrm{CE}^2 = r + \frac{1}{2}\gamma\sigma_Y^2\).
Substituting (35.13) gives \(\mathrm{CE}^2 = \beta + \rho\left(\mu_Y + \omega^2\sigma_Y + \frac{1}{2}(1-\gamma)\sigma_Y^2\right)\), so \(\mu_V^2 = \mu_Y + \omega^2\sigma_Y + \frac{1}{2}(1-\gamma)\sigma_Y^2\).
Then \(c^2 = \beta - (1-\rho)\mu_V^2\) is (35.14).
Step 4. Taking differences,
Since \(\lambda^1 - \lambda^2 = \omega^1 - \omega^2\) and \(\lambda^1 + \lambda^2 = 2\gamma\sigma_Y + \omega^1 - \omega^2\),
which gives (35.12).
The factor \(1/\rho\) reflects feedback from consumption to wealth growth: \(c^n\) depends on \(\mu_V^n\), and \(\mu_V^n = \mathrm{CE}^n - c^n\) depends on \(c^n\).
Here is a numerical check at \(\gamma = 5\), \(\rho = 0.67\), \(\omega^1 = 0.25\), \(\omega^2 = 0\), \(\sigma_Y = 0.02\), \(\mu_Y = 0.02\), and \(\beta = 0.05\).
γ, ρ, β, μ_y, σ_y = 5.0, 0.67, 0.05, 0.02, 0.02
ω_1, ω_2 = 0.25, 0.0

r = β + ρ * (μ_y + ω_2 * σ_y + 0.5 * (1 - γ) * σ_y**2) - 0.5 * γ * σ_y**2

def consumption_rate(ω_n):
    λ_n = γ * σ_y + ω_n - ω_2
    CE_n = r + λ_n**2 / (2 * γ)
    return (β - (1 - ρ) * CE_n) / ρ

c_1, c_2 = consumption_rate(ω_1), consumption_rate(ω_2)
y0_inv = β - (1 - ρ) * (μ_y + ω_2 * σ_y + 0.5 * (1 - γ) * σ_y**2)
Δω = ω_1 - ω_2
formula = (1 - ρ) / ρ * (Δω * σ_y + Δω**2 / (2 * γ))

print(f"c^2 from the HJB solution:     {c_2:.6f}")
print(f"(y(0))^(-1) from eq:wc_ratio:  {y0_inv:.6f}")
print(f"c^2 - c^1 from the HJB:        {c_2 - c_1:.6f}")
print(f"eq:consumption_rates:          {formula:.6f}")
c^2 from the HJB solution:     0.043664
(y(0))^(-1) from eq:wc_ratio:  0.043664
c^2 - c^1 from the HJB:        0.005541
eq:consumption_rates:          0.005541
35.5.3. Two comparative statics#
Survival depends on \(\gamma\), \(\rho\), and the signal-to-noise ratios \(\omega^1 / \sigma_Y\) and \(\omega^2 / \sigma_Y\), not on \(\omega^1\), \(\omega^2\), and \(\sigma_Y\) separately.
The survival conditions do not depend on \(\beta\) or \(\mu_Y\), which affect the level of consumption and prices but not relative wealth dynamics at the boundary.
def portfolio_return_diff(ω_1, ω_2, γ, σ_y):
    """
    Difference in expected log portfolio returns at the boundary.
    """
    Δω = ω_1 - ω_2
    risky_share_diff = Δω / (γ * σ_y)
    risk_premium = γ * σ_y**2 - ω_2 * σ_y
    volatility_term = (Δω / γ) * (σ_y + 0.5 * Δω / γ)
    return risky_share_diff * risk_premium - volatility_term


def saving_channel(ω_1, ω_2, γ, ρ, σ_y):
    """
    Difference in consumption-wealth ratios at the boundary.
    """
    Δω = ω_1 - ω_2
    subjective_return_diff = Δω * σ_y + Δω**2 / (2 * γ)
    return (1 - ρ) / ρ * subjective_return_diff


def boundary_drift(ω_1, ω_2, γ, ρ, σ_y):
    """
    Boundary drift m_ϑ(0+) when agent 1 becomes negligible.

    By eq:drift_wealth, this is γ times the wealth-growth
    differential in eq:wealth_decomp.
    Positive drift means agent 1 survives (repelling boundary).
    """
    return γ * (
        portfolio_return_diff(ω_1, ω_2, γ, σ_y)
        + saving_channel(ω_1, ω_2, γ, ρ, σ_y)
    )
The case \(\upsilon \nearrow 1\) is symmetric.
Swapping the agents’ labels turns \(\vartheta\) into \(-\vartheta\), so \(\lim_{\upsilon \nearrow 1} m_\vartheta(\upsilon)\) equals -boundary_drift(ω_2, ω_1, γ, ρ, σ_y).
35.5.4. Risk aversion versus the IES#
The two boundary drifts satisfy a simple identity.
Proposition 35.2
To derive it, let \(\Delta = \omega^1 - \omega^2\).
Combining (35.9), (35.10), (35.11), and (35.12) gives
At \(\upsilon \nearrow 1\) the roles of the agents are reversed, which replaces \(\Delta\) by \(-\Delta\), \(\omega^2\) by \(\omega^1\), and \(m_\vartheta\) by \(-m_\vartheta\):
In the difference, the terms linear in \(\sigma_Y\) cancel.
The risk premium terms add to \(\Delta(\omega^1 - \omega^2) = \Delta^2\), the volatility terms add to \(-\Delta^2/\gamma\), and the saving terms add to \(\Delta^2 (1-\rho)/\rho\).
The sum is \(\Delta^2(1/\rho - 1/\gamma)\).
The identity sorts the \((\gamma, \rho)\) plane:
Outcome (a), coexistence, requires \(\lim_{\upsilon \searrow 0} m_\vartheta > 0 > \lim_{\upsilon \nearrow 1} m_\vartheta\), so it requires \(\gamma > \rho\).
Outcome (d), in which each agent dominates with positive probability, requires the reverse inequalities, so it requires \(\gamma < \rho\).
On the diagonal \(\gamma = \rho\) the two boundary drifts are equal, so when \(|\omega^1| \neq |\omega^2|\) exactly one agent dominates.
Outcomes (b) and © can occur on either side of the diagonal.
Epstein-Zin agents prefer early resolution of uncertainty when \(\gamma > \rho\) [Epstein and Zin, 1989, Kreps and Porteus, 1978].
Both agents can survive only in economies populated by agents with that preference.
Borovička [2020] notes that the coexistence region in the top-left panel of his Figure 2 lies where \(\gamma > \rho\); Proposition 35.2 shows that this holds for all belief distortions and all \(\sigma_Y\).
Neither the IES alone nor risk aversion alone settles the question.
An IES above one is not sufficient for coexistence, because \(\gamma < \rho < 1\) rules it out.
An IES above one is not necessary either, as the next section shows.
Exercise 35.6
Carry out the algebra behind Proposition 35.2, starting from (35.11) and (35.12).
Show that when \(\gamma = \rho\) both boundary drifts equal \(\frac{1}{2}\left[(\omega^2)^2 - (\omega^1)^2\right]\).
Use
boundary_driftto verify the identity at 10,000 randomly drawn parameter vectors \((\omega^1, \omega^2, \gamma, \rho, \sigma_Y)\).
Solution
Part 1. Multiplying (35.11) by \(\gamma\) gives
Multiplying (35.12) by \(\gamma\) gives \(\frac{1-\rho}{\rho}\left(\gamma\Delta\sigma_Y + \frac{\Delta^2}{2}\right)\).
Their sum is \(\lim_{\upsilon \searrow 0} m_\vartheta\) by (35.9) and (35.10).
At \(\upsilon \nearrow 1\), agent 2 is the negligible agent and agent 1 sets prices.
Applying the same formulas with the labels swapped gives \(\gamma \lim_{\upsilon \nearrow 1}[m_A^2 - m_A^1]\), which equals \(-\lim_{\upsilon \nearrow 1} m_\vartheta\).
Swapping labels replaces \(\Delta\) by \(-\Delta\) and \(\omega^2\) by \(\omega^1\), so
Adding the two expressions term by term:
Part 2. Setting \(\rho = \gamma\), the saving term becomes \((1-\gamma)\Delta\sigma_Y + (1-\gamma)\Delta^2/(2\gamma)\).
Adding it to the portfolio term, the terms in \(\sigma_Y\) and in \(\Delta^2/(2\gamma)\) cancel and leave
By Part 1, the drift at \(\upsilon \nearrow 1\) is the same.
When \(\gamma = \rho\) the saving term is not zero unless \(\rho = 1\); the three channels net to a constant that does not depend on \(\gamma\) or \(\sigma_Y\).
Part 3.
rng = np.random.default_rng(0)
n_draws = 10_000
max_err = 0.0
for _ in range(n_draws):
    ω_1, ω_2 = rng.normal(0.0, 0.3, size=2)
    γ = rng.uniform(0.05, 30.0)
    ρ = rng.uniform(0.05, 5.0)
    σ_y = rng.uniform(0.005, 0.2)
    m_0 = boundary_drift(ω_1, ω_2, γ, ρ, σ_y)
    m_1 = -boundary_drift(ω_2, ω_1, γ, ρ, σ_y)
    gap = (ω_1 - ω_2)**2 * (1 / ρ - 1 / γ)
    max_err = max(max_err, abs(m_0 - m_1 - gap))

print(f"largest error over {n_draws} draws: {max_err:.2e}")

for γ in [0.5, 2.0, 7.0]:
    m_sep = boundary_drift(0.25, -0.1, γ, γ, 0.02)
    print(f"γ = ρ = {γ}: m_ϑ(0+) = {m_sep:.6f},  "
          f"[(ω^2)^2 - (ω^1)^2] / 2 = {0.5 * (0.1**2 - 0.25**2):.6f}")
largest error over 10000 draws: 1.07e-14
γ = ρ = 0.5: m_ϑ(0+) = -0.026250,  [(ω^2)^2 - (ω^1)^2] / 2 = -0.026250
γ = ρ = 2.0: m_ϑ(0+) = -0.026250,  [(ω^2)^2 - (ω^1)^2] / 2 = -0.026250
γ = ρ = 7.0: m_ϑ(0+) = -0.026250,  [(ω^2)^2 - (ω^1)^2] / 2 = -0.026250
35.6. Survival regions#
A central contribution of Borovička [2020] is the characterization of survival regions in the \((\gamma, \rho)\) plane.
Under separable preferences, \(\gamma = \rho\), the agent with more accurate beliefs always dominates.
Under recursive preferences, all four outcomes in Proposition 35.1 can occur.
Figure 2 in the paper studies the case where agent 2 has correct beliefs, so \(\omega^2 = 0\).
The next cell follows that figure.
For the limiting panel \(|\omega^1|/\sigma_Y \to \infty\) we use the limits of \(m_\vartheta(0+)/(\omega^1)^2\) and \(m_\vartheta(1-)/(\omega^1)^2\), which Exercise 35.7 derives.
def limit_boundary_drifts(γ, ρ):
    """
    Limits of m_ϑ(0+) / (ω^1)^2 and m_ϑ(1-) / (ω^1)^2
    as |ω^1| / σ_y -> ∞, with ω^2 = 0.
    """
    m_0 = (γ - (1 + γ) * ρ) / (2 * γ * ρ)
    m_1 = ((1 - γ) * ρ - γ) / (2 * γ * ρ)
    return m_0, m_1
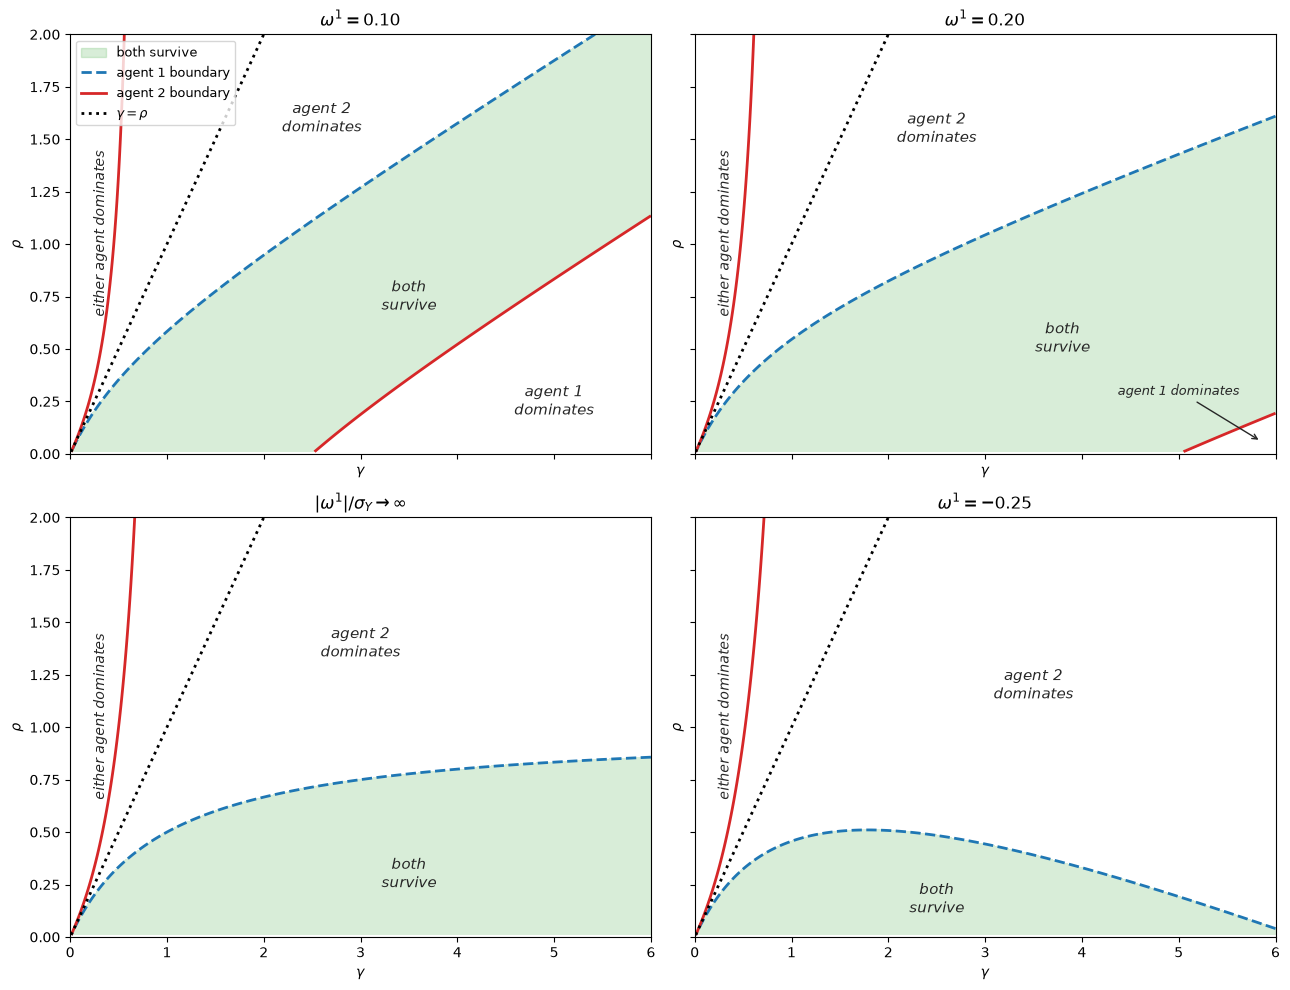
Fig. 35.1 Survival regions corresponding to Figure 2 in Borovička (2020)#
Each panel plots two curves in the \((\gamma, \rho)\) plane for a different value of agent 1’s belief distortion \(\omega^1\) (agent 2 has correct beliefs, \(\omega^2 = 0\)).
The dashed curve (blue) is where the boundary drift at \(\upsilon = 0\) equals zero – condition (i) in Proposition 35.1.
The solid curve (red) is where the boundary drift at \(\upsilon = 1\) equals zero – condition (ii).
The shaded region is where both agents survive.
The dotted diagonal \(\gamma = \rho\) is the separable CRRA case, along which the agent with more accurate beliefs always dominates.
The next cell reports the share of the plotted window occupied by each outcome, the share of the coexistence region with \(\rho > 1\) (IES \(< 1\)), and the largest \(\rho\) in the coexistence region.
names = ["ω¹ = 0.10", "ω¹ = 0.20", "|ω¹|/σ_y → ∞", "ω¹ = -0.25"]
print(f"{'panel':<15}{'both':>7}{'agent 1':>9}{'agent 2':>9}{'either':>8}"
      f"{'share ρ > 1':>13}{'max ρ':>8}")
n_wrong_side = 0
for idx, name in enumerate(names):
    both, ag1_dom, ag2_dom, either = region_masks[idx]
    print(f"{name:<15}{both.mean():7.3f}{ag1_dom.mean():9.3f}"
          f"{ag2_dom.mean():9.3f}{either.mean():8.3f}"
          f"{(both & (R > 1)).sum() / both.sum():13.3f}{R[both].max():8.3f}")
    n_wrong_side += (both & (R >= G)).sum() + (either & (R <= G)).sum()

print(f"\ngrid points with coexistence and ρ ≥ γ, "
      f"or with outcome (d) and ρ ≤ γ: {n_wrong_side}")
panel             both  agent 1  agent 2  either  share ρ > 1   max ρ
ω¹ = 0.10        0.439    0.171    0.323   0.066        0.421   2.000
ω¹ = 0.20        0.486    0.008    0.436   0.070        0.173   1.606
|ω¹|/σ_y → ∞     0.335    0.000    0.590   0.075        0.000   0.853
ω¹ = -0.25       0.167    0.000    0.755   0.078        0.000   0.509

grid points with coexistence and ρ ≥ γ, or with outcome (d) and ρ ≤ γ: 0
Every shaded region lies below the diagonal, and every region where either agent can dominate lies above it, as Proposition 35.2 requires.
Moderate optimism (\(\omega^1 = 0.10\)) produces a wide coexistence region that extends across most of the \(\gamma\) range.
Coexistence does not require IES \(> 1\): 42 percent of the shaded area in this panel has \(\rho > 1\), including the point \(\gamma = 5\), \(\rho = 1.5\).
Stronger optimism (\(\omega^1 = 0.20\)) rotates both curves clockwise.
The agent 1 curve falls, so agent 2 dominates in a larger part of the plane above it.
The lower branch of the agent 2 curve meets the axis \(\rho = 0\) at \(\gamma = \omega^1/(2\sigma_Y)\), which is 2.5 when \(\omega^1 = 0.10\) and 5 when \(\omega^1 = 0.20\).
At that value of \(\gamma\), the two agents’ subjective certainty-equivalent returns at the boundary \(\upsilon = 1\) are equal, and the saving channel changes sign there.
Agent 1 therefore dominates only in a sliver at the bottom right of the \(\omega^1 = 0.20\) panel, and the coexistence region grows from 44 to 49 percent of the plotted window.
In the limit \(|\omega^1|/\sigma_Y \to \infty\) (bottom-left), the boundary curves are \(\rho = \gamma/(1+\gamma)\) and, for \(\gamma < 1\), \(\rho = \gamma/(1-\gamma)\) (see Exercise 35.7).
Both agents survive exactly when \(\rho < \gamma/(1+\gamma)\), the region below the agent 1 curve.
That curve rises toward \(\rho = 1\) as \(\gamma\) grows, so in this limit coexistence requires IES \(> 1\).
The agent 2 curve separates outcome © from outcome (d), and agent 1 never dominates.
Pessimistic distortions (\(\omega^1 = -0.25\), bottom-right) can also survive, but only in a much narrower part of the parameter space: 17 percent of the plotted window, all of it with \(\rho < 0.51\).
The coexistence region ends at \(\gamma = |\omega^1|/(2\sigma_Y) = 6.25\), just beyond the plotted range.
For larger \(\gamma\) her short position is too small, \(\pi^1 > -1\), for her subjective certainty-equivalent return to exceed agent 2’s.
With IES \(> 1\) the saving channel then works against her, and with IES \(< 1\) it is too weak to offset her portfolio losses.
Exercise 35.7
Let \(\omega^2 = 0\).
Show that, holding \(\gamma\) and \(\rho\) fixed, \(m_\vartheta(0+)/(\omega^1)^2\) and \(m_\vartheta(1-)/(\omega^1)^2\) depend on \(\omega^1\) and \(\sigma_Y\) only through \(\sigma_Y/\omega^1\), and that as \(\sigma_Y/\omega^1 \to 0\) they converge to the expressions in
limit_boundary_drifts.Deduce that the boundary curves in the limit are \(\rho = \gamma/(1+\gamma)\) and, for \(\gamma < 1\), \(\rho = \gamma/(1-\gamma)\). Classify the four outcomes in the limit and show that agent 1 never dominates.
Verify numerically that the zero curve of
boundary_driftat \(\upsilon = 0\) converges to \(\rho = \gamma/(1+\gamma)\) as \(\omega^1/\sigma_Y\) grows.
Hint: \(m_\vartheta(0+)\) is affine in \(1/\rho\), so for each \(\gamma\) its zero can be computed in closed form.
Solution
Part 1. Let \(\Delta = \omega^1\) and \(s = \sigma_Y/\omega^1\).
From the expression for \(\lim_{\upsilon \searrow 0} m_\vartheta\) in the derivation of Proposition 35.2, with \(\omega^2 = 0\),
Similarly,
The difference of the two limits is \((\gamma - \rho)/(\gamma\rho) = 1/\rho - 1/\gamma\), as Proposition 35.2 requires.
Part 2. The first limit is positive if and only if \(\rho < \gamma/(1+\gamma)\).
The second limit is negative if and only if \((1-\gamma)\rho < \gamma\).
That inequality holds for every \(\rho > 0\) when \(\gamma \geq 1\), and holds if and only if \(\rho < \gamma/(1-\gamma)\) when \(\gamma < 1\).
Since \(\gamma/(1+\gamma) < \gamma/(1-\gamma)\) for \(\gamma \in (0, 1)\), condition (i) implies condition (ii).
Hence:
(a) both survive if and only if \(\rho < \gamma/(1+\gamma)\);
(b) agent 1 dominates nowhere, because (i) and (ii’) cannot hold together;
© agent 2 dominates if \(\rho > \gamma/(1+\gamma)\) and either \(\gamma \geq 1\) or \(\rho < \gamma/(1-\gamma)\);
(d) either agent dominates if \(\gamma < 1\) and \(\rho > \gamma/(1-\gamma)\).
Part 3. Write \(m_\vartheta(0+) = \gamma\left[P + (1/\rho - 1) S\right]\), where \(P\) is the portfolio-return difference and \(S\) is the bracket in (35.12).
The drift vanishes at \(1/\rho = 1 - P/S\), so \(\rho = S/(S - P)\).
def lower_zero_curve(ω_1, ω_2, σ_y, γ):
    """
    The ρ at which m_ϑ(0+) = 0, using that m_ϑ(0+) is affine in 1/ρ.
    """
    Δω = ω_1 - ω_2
    P = portfolio_return_diff(ω_1, ω_2, γ, σ_y)
    S = Δω * σ_y + Δω**2 / (2 * γ)
    return S / (S - P)


γ_check = np.array([0.5, 1.0, 2.0, 5.0, 20.0])
σ_y = 0.02
print("γ:              ", γ_check)
for ratio in [5, 50, 500, 5000]:
    ρ_zero = lower_zero_curve(ratio * σ_y, 0.0, σ_y, γ_check)
    print(f"ω¹/σ_y = {ratio:>5}: ", np.round(ρ_zero, 4))
print("γ / (1 + γ):    ", np.round(γ_check / (1 + γ_check), 4))
γ:               [ 0.5  1.   2.   5.  20. ]
ω¹/σ_y =     5:  [0.3529 0.5833 0.9474 1.875  6.2069]
ω¹/σ_y =    50:  [0.3355 0.5098 0.7013 0.9677 1.6514]
ω¹/σ_y =   500:  [0.3336 0.501  0.6702 0.8472 1.0247]
ω¹/σ_y =  5000:  [0.3334 0.5001 0.667  0.8347 0.9596]
γ / (1 + γ):     [0.3333 0.5    0.6667 0.8333 0.9524]
35.7. Three survival channels#
The decomposition above can be visualized directly.
def decompose_survival(ω_1, ω_2, γ_grid, ρ, σ_y):
    """
    Decompose the wealth-growth differential in proposition 3.4.

    The total equals lim (m_A^1 - m_A^2) = m_ϑ(0+) / γ as υ -> 0.
    """
    Δω = ω_1 - ω_2
    risk_premium_term = Δω * (γ_grid * σ_y - ω_2) / γ_grid
    volatility_term = -(Δω / γ_grid) * (σ_y + 0.5 * Δω / γ_grid)
    saving_term = (1 - ρ) / ρ * (Δω * σ_y + Δω**2 / (2 * γ_grid))
    total = risk_premium_term + volatility_term + saving_term
    return risk_premium_term, volatility_term, saving_term, total


ω_1 = 0.25
ω_2 = 0.0
ρ = 0.67
σ_y = 0.02
γ_grid = np.linspace(0.5, 15.0, 300)

risk_term, vol_term, save_term, total = decompose_survival(
    ω_1, ω_2, γ_grid, ρ, σ_y
)

fig, ax = plt.subplots(figsize=(11, 6))
ax.plot(γ_grid, risk_term, color="C0", lw=2, label="risk premium term")
ax.plot(γ_grid, vol_term, "--", color="C3", lw=2, label="volatility term")
ax.plot(γ_grid, save_term, "-.", color="C2", lw=2, label="saving term")
ax.plot(γ_grid, total, color="black", lw=2,
        label=r"total $= m_\vartheta(0+)/\gamma$")
ax.axhline(0, color="gray", lw=1)
ax.set_xlabel(r"risk aversion $\gamma$")
ax.set_ylabel("contribution to wealth-growth differential")
ax.legend()
plt.tight_layout()
plt.show()

γ_star = brentq(
    lambda γ: decompose_survival(ω_1, ω_2, γ, ρ, σ_y)[3], 0.5, 15.0
)
print(f"the total crosses zero at γ = {γ_star:.3f}")
the total crosses zero at γ = 1.465
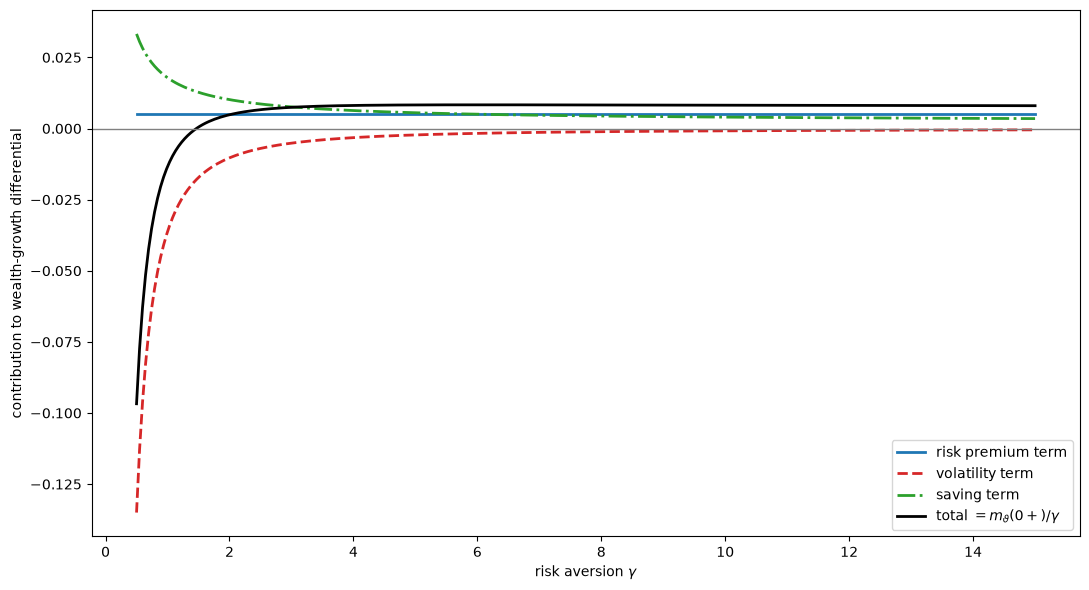
This figure decomposes the wealth-growth differential \(\lim_{\upsilon \searrow 0}[m_A^1 - m_A^2] = \lim_{\upsilon \searrow 0} m_\vartheta / \gamma\) into three terms for an optimistic agent (\(\omega^1 = {0.25}\), \(\omega^2 = 0\)) with IES \(= 1/\rho \approx 1.49\) and \(\sigma_Y = 0.02\).
The risk premium term (blue) is positive throughout because the optimistic agent overweights the risky asset and earns the equity premium.
The volatility term (red dashed) is negative and large at low \(\gamma\), reflecting the cost of holding a volatile portfolio.
The saving term (green dash-dot) is positive when IES \(> 1\) because the optimistic agent perceives a high return on wealth and saves more aggressively.
The total (black) crosses zero at \(\gamma \approx 1.47\); below that value the volatility penalty dominates, condition (i) fails, and the boundary \(\upsilon = 0\) attracts.
35.8. Varying the IES#
The sign of the saving term is pinned down by the IES.
fig, axes = plt.subplots(1, 3, figsize=(16, 4.5), sharey=True)

ω_1 = 0.25
ω_2 = 0.0
σ_y = 0.02
γ_grid = np.linspace(0.5, 25.0, 300)

ies_values = [0.5, 1.0, 1.5]

for idx, ies in enumerate(ies_values):
    ρ = 1.0 / ies
    risk_term, vol_term, save_term, total = decompose_survival(
        ω_1, ω_2, γ_grid, ρ, σ_y
    )

    ax = axes[idx]
    ax.plot(γ_grid, risk_term, color="C0", lw=2, label="risk premium")
    ax.plot(γ_grid, vol_term, "--", color="C3", lw=2, label="volatility")
    ax.plot(γ_grid, save_term, "-.", color="C2", lw=2, label="saving")
    ax.plot(γ_grid, total, color="black", lw=2, label="total")
    ax.axhline(0, color="gray", lw=1)
    ax.set_title(f"IES = {ies:.1f}", fontsize=12)
    ax.set_xlabel(r"risk aversion $\gamma$")
    ax.set_ylabel("contribution")

axes[0].legend(fontsize=9)
plt.tight_layout()
plt.show()

for ies in ies_values:
    γ_star = brentq(
        lambda γ: decompose_survival(ω_1, ω_2, γ, 1 / ies, σ_y)[3], 0.5, 25.0
    )
    print(f"IES = {ies:.1f}: the total crosses zero at γ = {γ_star:.2f}")
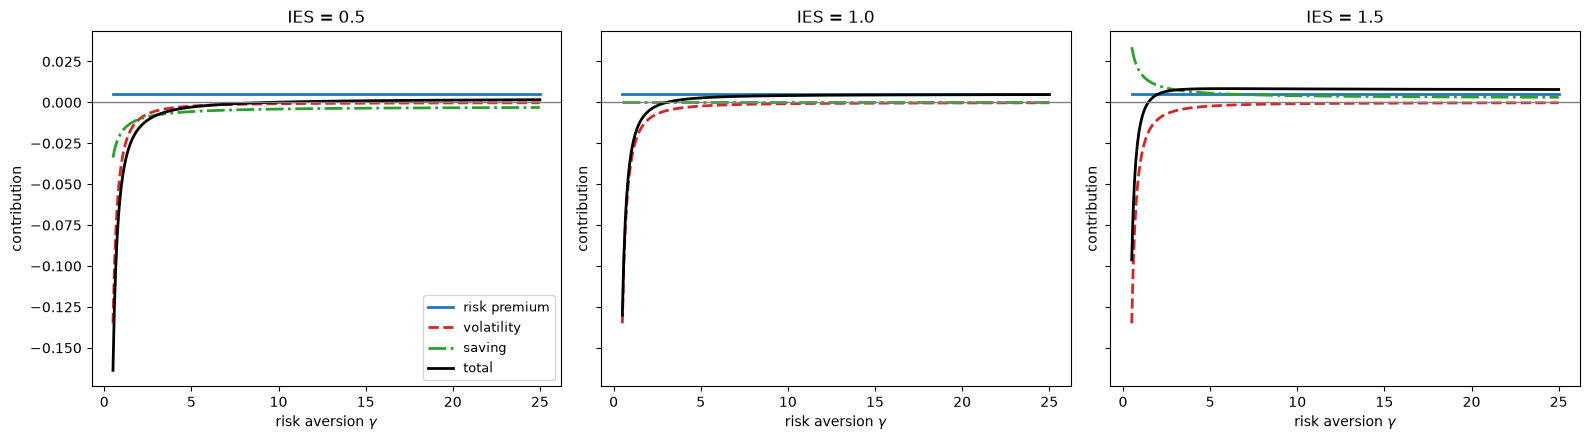
Fig. 35.2 Boundary decomposition for different IES values#
IES = 0.5: the total crosses zero at γ = 9.56
IES = 1.0: the total crosses zero at γ = 3.05
IES = 1.5: the total crosses zero at γ = 1.45
Each panel shows the same three-term decomposition as the previous figure, but now for three different values of the IES (\(\omega^1 = 0.25\), \(\omega^2 = 0\), \(\sigma_Y = 0.02\)).
Left panel (IES \(= 0.5\)): the saving term is negative, so the optimistic agent actually saves less, working against survival. The risk premium term still makes the total positive for \(\gamma > 9.56\), so condition (i) holds with IES below one.
Center panel (IES \(= 1.0\)): the saving term vanishes entirely, so only the portfolio return and volatility channels remain.
This eliminates the saving channel but does not by itself reproduce the full separable CRRA benchmark, which requires \(\gamma = \rho\) (i.e., IES \(= 1/\gamma\)), not merely \(\rho = 1\).
Right panel (IES \(= 1.5\)): the saving term is positive and shifts the total drift upward, expanding the range of \(\gamma\) values for which the optimistic agent survives.
The zero crossing moves from \(\gamma = 9.56\) to \(3.05\) to \(1.45\) as the IES rises from 0.5 to 1 to 1.5.
35.9. Asymptotic results#
Borovička derives several useful asymptotic results.
As \(\gamma \searrow 0\), each agent dominates with strictly positive probability.
As \(\gamma \nearrow \infty\), the relatively more optimistic agent dominates.
As \(\rho \searrow 0\), the relatively more optimistic agent always survives.
The relatively more pessimistic agent can also survive when risk aversion is sufficiently low.
As \(\rho \nearrow \infty\), a nondegenerate long-run equilibrium cannot exist.
The next figure illustrates the first result by plotting both boundary drifts as \(\gamma\) becomes small.
ω_1 = 0.25
ω_2 = 0.0
ρ = 0.67
σ_y = 0.02
γ_grid = np.linspace(0.05, 5.0, 300)

drift_at_0 = np.array([boundary_drift(ω_1, ω_2, γ, ρ, σ_y) for γ in γ_grid])
drift_at_1 = np.array([-boundary_drift(ω_2, ω_1, γ, ρ, σ_y) for γ in γ_grid])

fig, ax = plt.subplots(figsize=(10, 5))
ax.plot(γ_grid, drift_at_0, color="C0", lw=2, label=r"$\upsilon \to 0$")
ax.plot(γ_grid, drift_at_1, "--", color="C3", lw=2, label=r"$\upsilon \to 1$")
ax.axhline(0, color="gray", lw=1)
ax.set_xlabel(r"risk aversion $\gamma$")
ax.set_ylabel("boundary drift")
ax.legend()
plt.tight_layout()
plt.show()
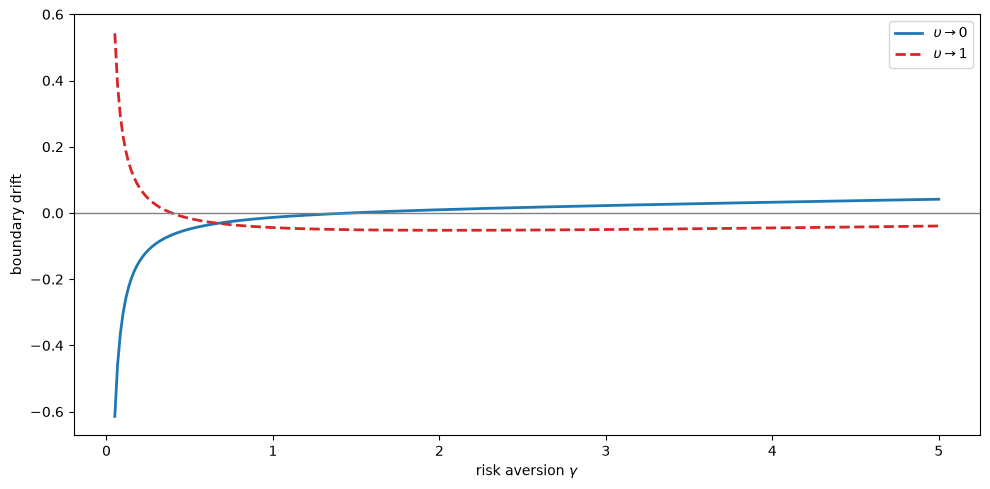
Fig. 35.3 Boundary drifts for small risk aversion#
This figure plots the two boundary drifts as a function of \(\gamma\) (\(\omega^1 = 0.25\), \(\omega^2 = 0\), IES \(\approx 1.49\)).
The solid blue curve is the drift \(m_\vartheta\) at \(\upsilon \to 0\) (agent 1 near extinction); coexistence requires this to be positive (condition (i)).
The dashed red curve is the drift \(m_\vartheta\) at \(\upsilon \to 1\) (agent 2 near extinction); coexistence requires this to be negative (condition (ii)).
The figure illustrates asymptotic result 1.
For small \(\gamma\), the blue curve is negative and the red curve is positive.
Both boundaries are attracting: near \(\upsilon = 0\) the negative drift pulls \(\upsilon\) toward 0, and near \(\upsilon = 1\) the positive drift pushes \(\upsilon\) toward 1.
This is outcome (d) in Proposition 35.1: neither boundary is repelling, so whichever agent happens to get ahead early will dominate, with each agent having strictly positive probability of dominance depending on the realized Brownian path.
The red curve crosses zero first, at \(\gamma \approx 0.39\), while the blue curve is still negative.
For \(\gamma\) between about 0.39 and 1.47, the boundary \(\upsilon = 1\) repels and the boundary \(\upsilon = 0\) attracts, so agent 2 dominates – outcome ©.
The two curves cross each other at \(\gamma = \rho = 0.67\), as Proposition 35.2 requires; their common value there is \(-\frac{1}{2}(\omega^1)^2 = -0.03125\).
The blue curve crosses zero at \(\gamma \approx 1.47\).
Beyond that point both boundaries repel and both agents survive – outcome (a).
Outside the plotted range, the red curve crosses zero again at \(\gamma \approx 10.7\), and for larger \(\gamma\) agent 1 dominates – outcome (b), in line with asymptotic result 2.
Exercise 35.8
Take the parameters of Fig. 35.3: \(\omega^1 = 0.25\), \(\omega^2 = 0\), \(\rho = 0.67\), \(\sigma_Y = 0.02\).
Show that \(2\gamma \lim_{\upsilon \searrow 0} m_\vartheta\) and \(2\gamma \lim_{\upsilon \nearrow 1} m_\vartheta\) are quadratic polynomials in \(\gamma\), and use them to find every \(\gamma > 0\) at which a boundary drift changes sign.
Confirm the roots with
boundary_drift.Label the outcome of Proposition 35.1 on each interval between consecutive roots.
Solution
Let \(\Delta = \omega^1\), \(\omega^2 = 0\), and \(k = (1-\rho)/\rho\).
Multiplying the two boundary drifts from the derivation of Proposition 35.2 by \(2\gamma\) gives
When \(\Delta > 0\), the first quadratic has one positive root because its constant term is negative.
The second has two positive roots when its discriminant is positive, because its constant term and its leading coefficient are both positive.
ω_1, ω_2, ρ, σ_y = 0.25, 0.0, 0.67, 0.02
Δ, k = ω_1 - ω_2, (1 - ρ) / ρ

roots_0 = np.roots([2 * Δ * σ_y / ρ, k * Δ**2 - 2 * Δ * σ_y, -Δ**2])
roots_1 = np.roots([2 * Δ * σ_y / ρ,
                    -(2 * Δ * σ_y + (1 + ρ) / ρ * Δ**2), Δ**2])
roots_0 = np.sort(roots_0[roots_0 > 0])
roots_1 = np.sort(roots_1[roots_1 > 0])

m_0 = lambda γ: boundary_drift(ω_1, ω_2, γ, ρ, σ_y)
m_1 = lambda γ: -boundary_drift(ω_2, ω_1, γ, ρ, σ_y)

print("roots of m_ϑ(0+):", roots_0, " check:", [m_0(g) for g in roots_0])
print("roots of m_ϑ(1-):", roots_1, " check:", [m_1(g) for g in roots_1])

outcome = {(True, True): "(a) both survive",
           (True, False): "(b) agent 1 dominates",
           (False, True): "(c) agent 2 dominates",
           (False, False): "(d) either agent dominates"}

cuts = np.concatenate(([0.0], np.sort(np.concatenate((roots_0, roots_1))),
                       [np.inf]))
for lo, hi in zip(cuts[:-1], cuts[1:]):
    γ_mid = 0.5 * (lo + hi) if np.isfinite(hi) else 2 * lo
    print(f"γ in ({lo:6.3f}, {hi:6.3f}):  "
          f"{outcome[(m_0(γ_mid) > 0, m_1(γ_mid) < 0)]}")
roots of m_ϑ(0+): [1.46529206]  check: [np.float64(5.0837530595323925e-18)]
roots of m_ϑ(1-): [ 0.39074321 10.71675679]  check: [np.float64(-2.4401931409719703e-17), np.float64(-6.971478593011729e-18)]
γ in ( 0.000,  0.391):  (d) either agent dominates
γ in ( 0.391,  1.465):  (c) agent 2 dominates
γ in ( 1.465, 10.717):  (a) both survive
γ in (10.717,    inf):  (b) agent 1 dominates
The outcomes run from (d) to © to (a) to (b) as \(\gamma\) rises, consistent with asymptotic results 1 and 2.
35.10. The separable case#
When \(\gamma = \rho\), the model collapses to the separable CRRA benchmark.
Blume and Easley [2006] study this benchmark in discrete time; Heterogeneous Beliefs and Financial Markets presents their analysis.
The two agents’ discount rates \(\nu^1\) and \(\nu^2\) then coincide, and the log-odds process (35.6) becomes
Its drift is the common value of the two boundary drifts in Proposition 35.2 when \(\gamma = \rho\) (see Exercise 35.6).
The drift is constant and depends only on the relative entropy of the two belief distortions.
Under \(P\), the relative entropy of \(P\) with respect to \(Q^n\) on \(\mathcal{F}_t\) is \(E^P[-\log M_t^n] = \frac{1}{2}(\omega^n)^2 t\), the Kullback–Leibler divergence described in Kullback–Leibler divergence.
The drift of \(\vartheta\) is the difference between the growth rates of the two agents’ relative entropies.
The agent with the smaller \(|\omega^n|\) dominates under \(P\).
If the two agents have equal magnitudes of belief distortions, neither becomes extinct almost surely, but no nondegenerate stationary wealth distribution exists.
def simulate_crra_pareto(ω_1, ω_2, T, dt, n_paths, seed=42):
    """
    Simulate Pareto-share dynamics in the separable benchmark.
    """
    rng = np.random.default_rng(seed)
    n_steps = int(T / dt)
    t_grid = np.linspace(0, T, n_steps + 1)

    drift = 0.5 * (ω_2**2 - ω_1**2)
    volatility = ω_1 - ω_2

    θ = np.zeros((n_paths, n_steps + 1))
    dW = rng.normal(0.0, np.sqrt(dt), size=(n_paths, n_steps))

    for t in range(n_steps):
        θ[:, t + 1] = θ[:, t] + drift * dt + volatility * dW[:, t]

    υ_paths = 1.0 / (1.0 + np.exp(-θ))
    return t_grid, υ_paths


ω_1 = 0.10
ω_2 = 0.0
T, dt = 2000, 0.05
t_grid, υ_paths = simulate_crra_pareto(ω_1, ω_2, T=T, dt=dt, n_paths=50)

fig, ax = plt.subplots(figsize=(11, 5))

for i in range(20):
    ax.plot(t_grid, υ_paths[i], color="C0", alpha=0.25, lw=1)

ax.axhline(0.5, color="gray", linestyle=":", lw=1)
ax.set_xlabel("time")
ax.set_ylabel(r"Pareto share $\upsilon_t$")
ax.set_ylim(0, 1)
plt.tight_layout()
plt.show()

drift = 0.5 * (ω_2**2 - ω_1**2)
vol = abs(ω_1 - ω_2)
print(f"{'t':>6}{'share of paths with υ_t < 1/2':>32}{'P(υ_t < 1/2)':>16}")
for t in [200, 500, 1000, 2000]:
    k = int(round(t / dt))
    share = np.mean(υ_paths[:, k] < 0.5)
    prob = 0.5 * (1 + erf(-drift * sqrt(t) / vol / sqrt(2)))
    print(f"{t:>6}{share:>32.2f}{prob:>16.3f}")
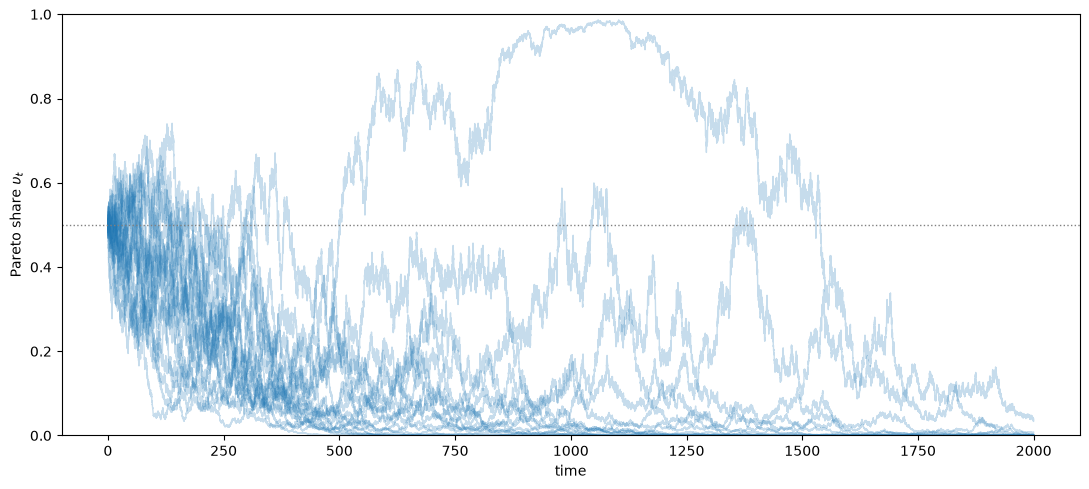
Fig. 35.4 Pareto-share paths in the separable benchmark#
     t   share of paths with υ_t < 1/2    P(υ_t < 1/2)
   200                            0.78           0.760
   500                            0.84           0.868
  1000                            0.94           0.943
  2000                            1.00           0.987
This figure simulates 50 sample paths of the Pareto share \(\upsilon_t\) under separable CRRA preferences (\(\gamma = \rho\)) with \(\omega^1 = 0.10\) and \(\omega^2 = 0\).
Agent 2 has correct beliefs, so \(\vartheta\) has drift \(-\frac{1}{2}(\omega^1)^2 = -0.005\) and \(\upsilon_t \to 0\) almost surely.
Agent 1 is driven to extinction – the classical market-selection result of Blume and Easley [2006].
Selection is slow.
The volatility of \(\vartheta\) is \(0.1\), so at \(t = 200\) the mean of \(\vartheta_t\), \(-1\), is smaller in magnitude than its standard deviation, \(1.41\).
The table compares the share of the 50 simulated paths with \(\upsilon_t < 1/2\) with the probability \(P(\vartheta_t < 0) = \Phi(0.05\sqrt{t})\), where \(\Phi\) is the standard normal distribution function.
About three quarters of the paths have \(\upsilon_t < 1/2\) at \(t = 200\); nearly all do by \(t = 2000\).
35.11. Asset pricing implications#
As one agent becomes negligible, current prices converge to those of the homogeneous economy populated by the large agent.
When agent 2 is the large agent, Proposition 5.1 in Borovička [2020] implies
and
The aggregate wealth dynamics also converge to those of the homogeneous economy:
Proposition 5.3 then gives the negligible agent’s own consumption-saving and portfolio choices.
Her consumption-wealth ratio converges to
The small agent’s risky-asset share converges to
Hence optimism implies leverage, while sufficiently strong pessimism implies shorting.
ω_2 = 0.0
σ_y = 0.02
ω_grid = np.linspace(-0.5, 1.0, 300)

fig, ax = plt.subplots(figsize=(10, 5))

for γ in [2, 5, 10, 20]:
    π_1 = 1 + (ω_grid - ω_2) / (γ * σ_y)
    ax.plot(ω_grid, π_1, lw=2, label=rf"$\gamma = {γ}$")

ax.axhline(1.0, color="gray", linestyle=":", lw=1)
ax.axhline(0.0, color="gray", linestyle=":", lw=1)
ax.axvline(0.0, color="gray", linestyle=":", lw=1)
ax.set_xlabel(r"belief distortion $\omega^1$")
ax.set_ylabel(r"risky share $\pi^1$")
ax.legend()
plt.tight_layout()
plt.show()
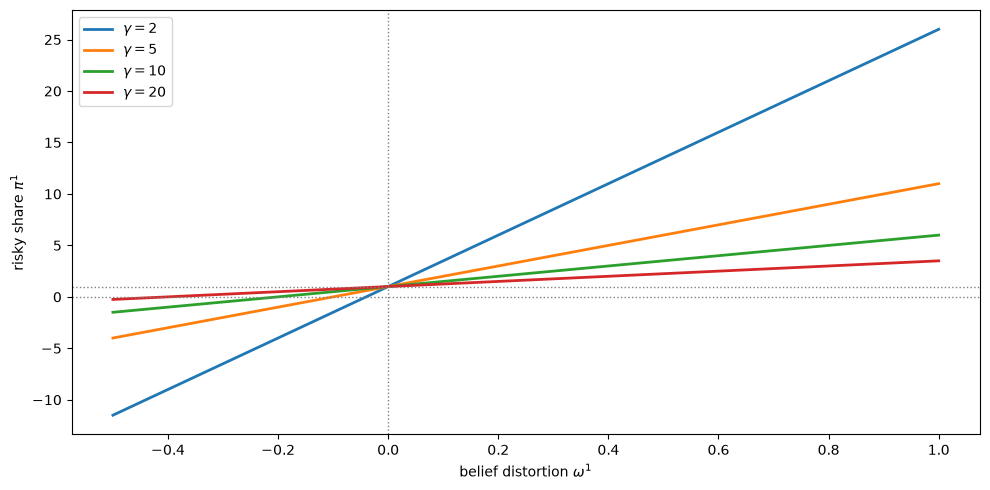
Fig. 35.5 Limiting risky-asset shares of the small agent#
This figure plots the limiting risky-asset share \(\pi^1\) of the negligible agent as a function of her belief distortion \(\omega^1\) (\(\omega^2 = 0\), \(\sigma_Y = 0.02\)), for four levels of risk aversion.
At \(\omega^1 = 0\) the agent agrees with agent 2 and holds the market portfolio (\(\pi^1 = 1\)).
Optimism (\(\omega^1 > 0\)) leads to leverage (\(\pi^1 > 1\)), while sufficient pessimism (\(\omega^1 < 0\)) leads to shorting (\(\pi^1 < 0\)).
Higher risk aversion compresses these deviations toward one.
35.12. Optimistic and pessimistic distortions#
Optimistic and pessimistic beliefs affect survival asymmetrically.
An optimistic agent benefits from the risk premium term and, when IES \(> 1\), from the saving term as well.
A pessimistic agent holds less of the risky asset than agent 2, who holds the market portfolio, \(\pi^2 = 1\).
With \(\omega^2 = 0\), the portfolio that maximizes the expected log return under \(P\) has risky share \(\gamma\).
When \(\gamma \geq 1\), a smaller risky share moves the pessimist away from that portfolio, so she earns a lower expected log return than agent 2.
She can then survive only if the saving effect is strong enough to offset that loss.
With IES \(> 1\) the saving term helps her only when she holds a large short position, \(\pi^1 < -1\); with IES \(< 1\) it helps her only when \(-1 < \pi^1 < 1\).
When \(\gamma < 1\), the market portfolio is more leveraged than the portfolio that maximizes the expected log return.
A mildly pessimistic agent with \(2\gamma - 1 < \pi^1 < 1\) then earns a higher expected log return than agent 2 without help from the saving channel.
For example, with \(\rho = 1\), \(\gamma = 0.5\), \(\sigma_Y = 0.02\), and \(\omega^1 = -0.005\), both boundary drifts are positive and the pessimist dominates.
print(f"m_ϑ(0+) = {boundary_drift(-0.005, 0.0, 0.5, 1.0, 0.02):.2e}, "
      f"m_ϑ(1-) = {-boundary_drift(0.0, -0.005, 0.5, 1.0, 0.02):.2e}")
m_ϑ(0+) = 2.50e-05, m_ϑ(1-) = 5.00e-05
fig, axes = plt.subplots(1, 2, figsize=(14, 5), sharey=True)

σ_y = 0.02
ω_2 = 0.0
ρ = 0.67
γ_grid = np.linspace(0.5, 25.0, 300)

ax = axes[0]
for ω_1 in [0.1, 0.25, 0.5, 1.0]:
    _, _, _, total = decompose_survival(ω_1, ω_2, γ_grid, ρ, σ_y)
    ax.plot(γ_grid, total, lw=2, label=rf"$\omega^1 = {ω_1}$")
ax.axhline(0, color="gray", lw=1)
ax.set_title("optimistic", fontsize=12)
ax.set_xlabel(r"risk aversion $\gamma$")
ax.set_ylabel(r"$m_\vartheta(0+)/\gamma$")
ax.set_ylim(-0.03, 0.06)
ax.legend(fontsize=9)

ax = axes[1]
for ω_1 in [-0.1, -0.25, -0.5, -1.0]:
    _, _, _, total = decompose_survival(ω_1, ω_2, γ_grid, ρ, σ_y)
    ax.plot(γ_grid, total, lw=2, label=rf"$\omega^1 = {ω_1}$")
ax.axhline(0, color="gray", lw=1)
ax.set_title("pessimistic", fontsize=12)
ax.set_xlabel(r"risk aversion $\gamma$")
ax.legend(fontsize=9)

plt.tight_layout()
plt.show()

f = lambda γ: decompose_survival(-1.0, ω_2, γ, ρ, σ_y)[3]
total = f(γ_grid)
idx = np.where(np.diff(np.sign(total)) != 0)[0]
roots = [brentq(f, γ_grid[i], γ_grid[i + 1]) for i in idx]
print("ω¹ = -1.0: the curve changes sign at γ =", np.round(roots, 2))
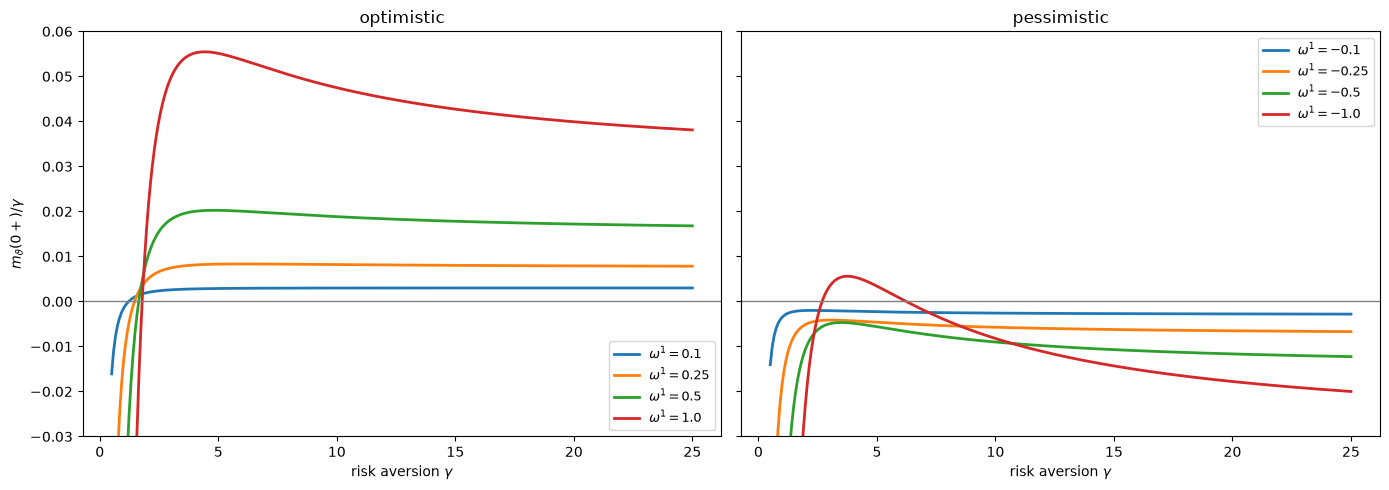
Fig. 35.6 Wealth-growth differential at the boundary for optimistic and pessimistic distortions#
ω¹ = -1.0: the curve changes sign at γ = [2.69 6.23]
Both panels plot the wealth-growth differential \(\lim_{\upsilon \searrow 0}[m_A^1 - m_A^2] = \lim_{\upsilon \searrow 0} m_\vartheta/\gamma\) as a function of \(\gamma\) (IES \(\approx 1.49\), \(\omega^2 = 0\)).
We clip the vertical axis; every curve falls steeply as \(\gamma \to 0\).
Where the curve is positive, agent 1 survives near extinction.
Left panel (optimistic agent): larger \(\omega^1\) means a bigger bet on the risky asset, so the volatility penalty dominates at low \(\gamma\) but the drift turns positive once \(\gamma\) is large enough.
Right panel (pessimistic agent): the curves for \(\omega^1 = -0.1, -0.25, -0.5\) are negative throughout. Only the most pessimistic agent, \(\omega^1 = -1\), survives near extinction, for \(\gamma\) between about 2.69 and 6.23. There she shorts the risky asset heavily (\(\pi^1 < -1\)), expects a high return on her position, and saves enough to offset her portfolio losses.
35.13. Long-run consumption distribution#
When both agents survive, the Pareto share keeps moving across the whole interval \((0, 1)\).
The next simulation is only a toy approximation.
It interpolates the drift between its two boundary values, so it illustrates the recurrence logic without solving the full equilibrium ODE.
def simulate_pareto_share_toy(ω_1, ω_2, γ, ρ, σ_y, T, dt, n_paths=20, seed=42):
    """
    Simulate a toy Pareto-share process by interpolating boundary drifts.
    """
    rng = np.random.default_rng(seed)
    n_steps = int(T / dt)
    t_grid = np.linspace(0, T, n_steps + 1)

    volatility = ω_1 - ω_2
    m_0 = boundary_drift(ω_1, ω_2, γ, ρ, σ_y)
    m_1 = -boundary_drift(ω_2, ω_1, γ, ρ, σ_y)

    θ = np.zeros((n_paths, n_steps + 1))
    dW = rng.normal(0.0, np.sqrt(dt), size=(n_paths, n_steps))

    for t in range(n_steps):
        υ = 1.0 / (1.0 + np.exp(-θ[:, t]))
        drift = m_0 * (1 - υ) + m_1 * υ
        θ[:, t + 1] = θ[:, t] + drift * dt + volatility * dW[:, t]

    υ_paths = 1.0 / (1.0 + np.exp(-θ))
    return t_grid, υ_paths


ω_1 = 0.25
ω_2 = 0.0
γ = 5.0
ρ = 0.67
σ_y = 0.02

t_grid, υ_paths = simulate_pareto_share_toy(
    ω_1, ω_2, γ, ρ, σ_y, T=500, dt=0.05, n_paths=50, seed=42
)

fig, axes = plt.subplots(1, 2, figsize=(14, 5))

ax = axes[0]
for i in range(20):
    ax.plot(t_grid, υ_paths[i], color="C0", alpha=0.25, lw=1)
ax.axhline(0.5, color="gray", linestyle=":", lw=1)
ax.set_title("sample paths", fontsize=12)
ax.set_xlabel("time")
ax.set_ylabel(r"Pareto share $\upsilon_t$")
ax.set_ylim(0, 1)

ax = axes[1]
_, υ_long = simulate_pareto_share_toy(
    ω_1, ω_2, γ, ρ, σ_y, T=2000, dt=0.05, n_paths=5, seed=123
)
υ_stationary = υ_long[:, υ_long.shape[1] // 2:].ravel()
ax.hist(υ_stationary, bins=80, density=True, color="steelblue",
        edgecolor="white", alpha=0.7)
ax.set_title("approximate stationary density", fontsize=12)
ax.set_xlabel(r"Pareto share $\upsilon$")
ax.set_ylabel("density")
ax.set_xlim(0, 1)

plt.tight_layout()
plt.show()
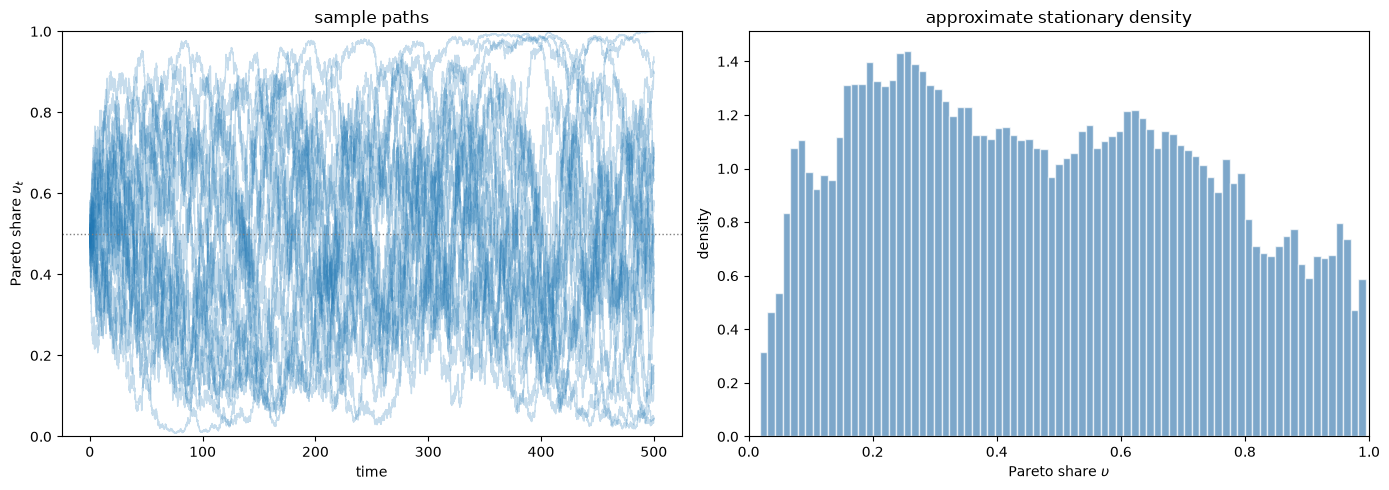
Fig. 35.7 A toy stationary Pareto-share simulation#
The left panel shows 50 sample paths of the Pareto share \(\upsilon_t\) under parameters inside the coexistence region (\(\omega^1 = 0.25\), \(\omega^2 = 0\), \(\gamma = 5\), IES \(\approx 1.49\)).
Unlike the separable case in Fig. 35.4, the paths do not drift to zero – they repeatedly visit a wide range of values, bouncing between the two repelling boundaries.
The right panel approximates the stationary density by pooling the second half of longer simulations.
The interior mode is consistent with neither agent being driven to extinction.
However, this toy interpolation only illustrates the recurrence logic; it does not reproduce the quantitative stationary consumption-share density in Figure 4 of Borovička [2020], which requires solving the full interior equilibrium ODE.
35.14. Summary#
Recursive preferences weaken the classical market-selection result.
The portfolio return channel still rewards more optimistic beliefs.
The volatility channel still penalizes aggressive positions.
The saving channel rewards an agent who expects a high return on her portfolio when IES \(> 1\) and penalizes her when IES \(< 1\).
The two boundary drifts differ by \((\omega^1 - \omega^2)^2(1/\rho - 1/\gamma)\).
Both agents can survive only when \(\gamma > \rho\), which means that agents prefer early resolution of uncertainty.
Each agent can dominate with positive probability only when \(\gamma < \rho\).
Coexistence does not require IES \(> 1\): with \(\omega^1 = 0.10\), \(\omega^2 = 0\), and \(\sigma_Y = 0.02\), both agents survive at \(\gamma = 5\), \(\rho = 1.5\).
Recursive-preference economies with \(\gamma > \rho\) can support stationary long-run wealth distributions with persistent heterogeneity in beliefs and portfolio positions.