103. Adaptive Learning and Escape Dynamics#
103.1. Overview#
This lecture is the culmination of the theory built by Sargent [1999].
It follows chapter 8, the most ambitious chapter of the book.
Everything after it in this suite builds on it:
Escaping Nash Inflation and Priors, Escapes, and Learning Cycles sharpen its analytics;
Econometric Policy Evaluation follows the book’s chapter 9 in taking the adaptive models to data;
Drifts and Volatilities and Drifts and Volatilities after 2000 put its central claim to an empirical test; and
The Lost Conquest: Fed Policy in the 2020s carries its tools to a later episode.
In Self-Confirming Equilibria a government held fixed beliefs about the Phillips curve — beliefs that were confirmed by the data those beliefs generated.
Here we make the government a real-time econometrician.
Each period it
re-estimates its Phillips curve by recursive least squares from the data seen so far, and
sets inflation at the first-period recommendation of the Phelps problem for its current estimate.
We ask whether such an adaptive government converges to a self-confirming equilibrium.
The answer depends on a single parameter — the gain that governs how fast old data are discounted:
With a decreasing gain that implements least squares, the mean dynamics pull the economy toward a self-confirming equilibrium asymptotically, and in the limit we get nothing new: the system is stuck near the Nash outcome.
With a constant gain, agents discount past data, convergence is arrested, and new outcomes emerge as the system recurrently escapes the self-confirming equilibrium toward the Ramsey (zero-inflation) outcome, in spontaneous stabilizations that resemble the arrival of Volcker.
The word “asymptotically” matters.
In a finite sample a falling gain also slows the journey back to the self-confirming equilibrium, so a least squares government whose prior is not tight can escape early and then stay near Ramsey for a very long time (Least squares learning: a decreasing gain).
These escapes are the heart of the vindication of econometric policy evaluation story from The Rise and Fall of U.S. Inflation: an adaptive government, learning a Solow-Tobin distributed-lag version of the natural-rate hypothesis, is led by chance observations to stabilize inflation.
This lecture replicates, analyzes, and reinterprets simulations like those of Christopher Sims and Heetaik Chung [Chung, 1990, Sims, 1988].
Their governments ran Kalman filters on Phillips-curve coefficients that they believed drift as random walks (see A First Look at the Kalman Filter).
Sims’s government fit a static Phillips curve, and Chung’s fit a distributed lag.
In their simulations the government escaped from Nash once and stayed near Ramsey, apparently indefinitely.
Chung’s filter had a gain that did not vanish, which let him estimate the government’s learning rule from post-war U.S. data (The econometricians did return the compliment; Exercise 91.7 poses a stripped-down version of his problem).
Following Sargent [1999], we instead give the government constant-gain recursive least squares, which produces recurrent escapes: the mean dynamics keep pulling the beliefs back toward the self-confirming equilibrium, and the economy keeps escaping again.
Sargent and Williams [2005] trace the difference to the government’s prior about coefficient drift, and Priors, Escapes, and Learning Cycles reproduces their account.
Because Sims’s government fit a static curve, the induction-hypothesis mechanism studied below does not apply to his simulations (chapter 8, footnote 15 of Sargent [1999]).
Here we study the escapes by simulation; Escaping Nash Inflation then characterizes them analytically as a second, deterministic ODE, and Priors, Escapes, and Learning Cycles asks how the government’s prior about coefficient drift reshapes both forces.
Let’s import what we need:
import matplotlib.pyplot as plt
import numpy as np
from scipy.integrate import solve_ivp
from scipy.linalg import solve_discrete_are, solve_discrete_lyapunov
103.2. A primer on recursive algorithms#
This section is a self-contained primer.
It develops the two analytical objects — mean dynamics and escape routes — that organize everything that follows, and it explains the sense in which one and the same recursion can be read either as an algorithm for computing a self-confirming equilibrium or as a model of a government adapting in real time.
The material is technical, and readers who want the punchline can skip to the simulations below and refer back as needed.
Readers arriving from the Bounded Rationality lectures have seen the scalar version of the mean dynamics, together with the \(T\)-map and E-stability, in One recursion, many learners, and Least Squares Learning in Self-Referential Models proves the convergence theorems for linear self-referential models.
This primer holds the general large-deviation theory for the whole suite; Escaping Nash Inflation applies it to a static version of the model.
103.2.1. Beliefs, moment conditions, and self-confirming equilibria#
A self-confirming equilibrium under the classical identification is pinned down by the government’s beliefs about some population moments and the regression coefficients they imply.
Under the classical identification these beliefs are measured by the triple \((\gamma, \, E X_{C} X_{C}^\top, \, E U X_{C})\), where \(\gamma\) is the vector of Phillips-curve coefficients.
In the adaptive models of this lecture the time-\(t\) values of these objects are among the economy’s state variables; they disappear as state variables in a self-confirming equilibrium only because there they are constants.
A self-confirming equilibrium under the classical identification satisfies the moment conditions
where the mathematical expectation is taken with respect to a distribution of \((U_t, X_{Ct})\) that depends on \(\gamma\) through the solution \(h(\gamma)\) of the Phelps problem.
Self-reference surfaces precisely in this dependence of the distribution on \(\gamma\): the government’s beliefs shape its policy, which shapes the data on which the beliefs are then checked.
The first line of (103.1) is the least squares normal equations for \(\gamma\), pre-multiplied by the inverse second-moment matrix; the second line defines \(R_{XC}\) as the second-moment matrix of the regressors.
It is convenient to assemble all the unknowns into a single vector
where \(\operatorname{col}(R_{XC})\) stacks the columns of \(R_{XC}\).
The moment conditions (103.1) then take the compact form
where \(\zeta\) is a random vector and the expectation is over its distribution (which, again, depends on \(\phi\)).
A self-confirming equilibrium is a set of beliefs \(\phi_f\) that is a zero of \(b\),
The rest of this section describes recursive algorithms for finding such a zero, and a change of perspective that converts each computational algorithm into a model of real-time adaptation.
103.2.2. Iteration#
The simplest algorithm computes a sequence \(\{\phi_k\}\) of estimates from
where the distribution used to evaluate the expectation defining \(b(\phi_k)\) in (103.3) is itself evaluated at the current estimate \(\phi_k\), and \(a > 0\) is a step size.
This is the relaxation algorithm used to compute self-confirming equilibria in Self-Confirming Equilibria.
Each step requires evaluating the mathematical expectation \(b(\phi) = \mathbb{E}[F(\phi, \zeta)]\) — which is exactly why we needed the moment (Lyapunov) formulas there.
103.2.3. Stochastic approximation#
A random version of (103.5) is obtained by replacing the mean \(b(\phi_n)\) by a single random draw \(F(\phi_n, \zeta_n)\) and letting the step size do the averaging:
To study the limiting behavior of (103.6), define artificial time
form the sampled process \(\phi(t_n) = \phi_n\), and interpolate (typically piecewise-linearly) to obtain a continuous-time process \(\phi^o(t)\).
One then approximates \(\phi^o(t)\) by a continuous-time process as \(n \to \infty\) and uses it to characterize the tail of the original sequence.
Different rates of decrease of the gain sequence \(\{a_n\}\) produce different approximating processes, because they change the mapping (103.7) from real time \(n\) to artificial time \(t_n\).
Note
Recursive stochastic approximation originates with Robbins and Monro [1951], who devised (103.6) to find the root of a regression function observed with noise, and with Kiefer and Wolfowitz [1952], who adapted it to find the maximum of a regression function (the “K-W” algorithms referred to below).
The “ODE method” for analyzing such recursions — approximating the interpolated process by the solution of a differential equation — is due to Ljung [1977]; book-length treatments are Benveniste et al. [1990] and Kushner and Yin [2003].
Its use to study learning in self-referential macroeconomic models is developed by Marcet and Sargent [1989] and, comprehensively, by Evans and Honkapohja [2001].
103.2.4. Mean dynamics#
The classic stochastic approximation algorithms of Kushner and Clark [1978] and Ljung [1977] set the gain to decrease like \(a_n \sim 1/n\) (at least for \(t \geq N\) for some \(N > 0\)).
This permits strong statements about the almost sure convergence of (103.6) to a zero of \(b(\phi)\).
For \(a_n \sim 1/n\), as \(n \to \infty\) the interpolated process \(\phi^o(t)\) approaches the solution of the ordinary differential equation
which we call the mean dynamics — the vector generalization of the scalar least-squares-learning ODE of Least squares learning converges to Nash.
A law of large numbers makes the random term in the continuous-time approximation vanish fast enough that the mean dynamics (103.8) describe the tail behavior of the stochastic process (103.6).
Consequently:
if the algorithm converges (almost surely), it converges to a zero of the mean dynamics, \(b(\phi) = 0\) — a self-confirming equilibrium; and
the ODE (103.8) carries the information about local and global stability of the algorithm.
Local stability is governed by the eigenvalues of the Jacobian of \(b\) at a rest point: if all eigenvalues have negative real parts the rest point is locally stable.
This is the condition called E-stability (One recursion, many learners).
For least squares the Jacobian has a simple structure, established by the Jacobian-reduction proposition (Proposition 137.2) of Least Squares Learning in Self-Referential Models:
the block belonging to the second-moment matrix contributes repeated eigenvalues equal to \(-1\); and
the remaining eigenvalues are those of \(DT - I\), where the map \(T\) sends a belief to the population regression coefficients that the belief induces.
Under a decreasing gain the eigenvalue of largest real part also governs the rate of convergence.
A necessary condition for the usual \(\sqrt{t}\) rate, with asymptotically normal estimates, is that every eigenvalue have real part below \(-\tfrac12\).
Mean dynamics near the self-confirming equilibrium computes these eigenvalues for our model; one of them, repeated five times, sits exactly at the \(-\tfrac12\) boundary.
That boundary concerns the asymptotic distribution of a decreasing-gain estimator.
It does not govern how often a constant-gain government escapes; the large-deviation objects introduced below do.
Note
Brock and Hommes [1997] build models whose global behavior is driven by stable mean dynamics far from rational expectations equilibria together with local instability of adaptation near them — a complementary mechanism for generating endogenous fluctuations from learning.
103.2.5. Constant gain and convergence in distribution#
We are equally interested in versions of (103.6) with a constant gain \(a_n = \epsilon > 0\) for all \(n\).
Limit theorems for constant-gain algorithms use a weaker notion of convergence — convergence in distribution — than the almost-sure convergence available when \(a_n \sim 1/n\).
They concern small-noise limits, taken as \(\epsilon \to 0\) and \(n\epsilon \to +\infty\) simultaneously.
Again using artificial time (103.7), form the family of processes
interpolate to obtain \(\phi^\epsilon(t)\), and study its small-\(\epsilon\) limit.
Dupuis and Kushner, Kushner and Yin [2003], and others verified conditions under which, as \(\epsilon \to 0\) and \(\epsilon n \to \infty\), the process \(\phi_n^\epsilon\) converges in distribution to the zeros of the same mean dynamics (103.8); the restrictions on the mean dynamics needed for convergence match those from the classic \(a_n \sim 1/n\) theory.
Unlike the decreasing-gain algorithm, a constant-gain algorithm does not settle down: \((\gamma, R_{XC})\) converges to a stationary stochastic process, perpetually fluctuating around — and occasionally far from — the self-confirming equilibrium.
103.2.6. Escape routes and the theory of large deviations#
The feature of the constant-gain apparatus that matters most for this lecture is not convergence toward \(\phi_f\) but the excursions away from it.
We are as interested in movements away from a self-confirming equilibrium as in those toward one, because the recurrent stabilizations in the simulations are precisely such excursions.
The theory of large deviations characterizes these excursions through three objects.
First, the log moment generating function of (an averaged version of) the innovation process \(F(\phi_n, \zeta_n)\): for a vector \(\alpha\) conformable to \(F\),
where the expectation is over the distribution of \(\zeta\).
Note
Equation (103.10) is a heuristic shorthand.
The object that actually enters the theory is a time-averaged limit; Dupuis and Kushner [1987] and Kushner and Yin [2003] assume that for each block width \(\Delta > 0\) the following limit exists uniformly in \(\phi_i, \alpha_i\) on any compact set: $\( \sum_{i=0}^{T/\Delta - 1} \Delta\, H(\alpha_i, \phi_i) = \lim_{N \to \infty} \frac{\Delta}{N} \log \mathbb{E} \exp \sum_{i=0}^{T/\Delta - 1} \alpha_i^\top \sum_{j=iN}^{iN+N-1} F(\phi_i, \zeta_j) . \)\( The inner sum averages the innovations over a block of length \)N$; the double limit lets us treat serially dependent innovations.
Second, the Legendre transform of \(H\), which plays the role of a rate function:
Third, the action functional, which measures the “cost” of a candidate escape path \(\phi(\cdot)\):
Dupuis and Kushner turn the search for the most likely escape into a deterministic control problem.
Let \(D\) be a compact set containing \(\phi_f\), with boundary \(\partial D\), and let \(C[0,T]\) be the continuous functions on \([0,T]\).
The escape route is the path \(\tilde\phi(\cdot)\) that solves
Assuming the minimizer \(\tilde\phi(\cdot)\) is unique, and letting \(t_D^\epsilon\) be the first time the constant-gain process \(\phi^\epsilon(t)\) leaves \(D\), Dupuis and Kushner [1987] show that for every \(\eta > 0\)
In words: conditional on escaping the set \(D\), the system leaves it near the terminal point of the least-action path — so the escape has a deterministic direction and shape, even though it is triggered by chance.
This is the sense in which the escapes below, though they require no large shock, “seem purposeful”: they follow the least-action route dictated by (103.13).
The same theory delivers the mean time to escape.
Let \(\bar S\) be the minimized value of (103.13); then \(\epsilon \log \mathbb{E}\, t_D^\epsilon \to \bar S\) as \(\epsilon \to 0\).
So escapes become exponentially rare as the gain shrinks.
That is a small-gain statement.
When \(\bar S\) is small relative to \(\epsilon\), as it is at the gains used in this suite, escapes are frequent: mean escape times grow roughly like \(1/\epsilon\), not like \(\exp(\bar S / \epsilon)\) (Simulating escapes measures them), and in the simulations below the government spends most of its time near the Ramsey outcome.
A crucial contrast with the mean dynamics: the mean dynamics (103.8) do not depend on the noise around them, whereas the escape routes do — the noise not only adds random fluctuations around (103.8), it also carves out this second family of paths.
Note
The mathematical foundations are the large-deviation theory for randomly perturbed dynamical systems of Freidlin and Wentzell [1998] (especially their chapter 4), specialized to stochastic approximation by Dupuis and Kushner [1987] and Dupuis and Kushner [1989]; a weak-convergence treatment is Dupuis and Ellis [1997].
103.2.7. A tractable action functional#
The escape-route calculation promises cheap information about central tendencies of the algorithm, but the action functional (103.12) is generally hard to compute.
An important special case simplifies it dramatically.
Suppose the innovation is additive and Gaussian,
where \(\zeta_n\) is stationary and Gaussian but not necessarily serially uncorrelated, and define \(\Omega = \sum_j \mathbb{E}\, \zeta_t \zeta_{t-j}^\top\).
Then the action functional takes the quadratic form
where \((\cdot)^{+}\) is the Moore-Penrose generalized inverse (used to handle possible stochastic singularity of \(\sigma \Omega \sigma^\top\)).
The weight \(w(s)\) depends on the gain: \(w(s) = \exp(s)\) when \(p = 1\) in \(a_n = a_0 / n^p\), and \(w(s) = 1\) when \(p < 1\).
Read (103.15) as a cost that penalizes departures of the realized drift \(\tfrac{d}{ds}\phi\) from the mean drift \(b(\phi)\), weighting each direction by the inverse of the local noise covariance \(\sigma \Omega \sigma^\top\).
The least-action escape therefore threads the beliefs through regions where the mean dynamics are weak and the noise is large — which, in our model, is the direction of the induction hypothesis.
Our model does not satisfy the assumptions behind (103.15) exactly.
Its innovation \(F\) contains products such as \(X_{C,t} X_{C,t}^\top\) and \(X_{C,t} U_t\), so it is quadratic in the shocks rather than additive and Gaussian.
Note
Cho et al. [2002], the published treatment of the model of this lecture, reduce the escape problem to minimizing a quadratic cost of the form (103.15), with a weighting matrix that is a fourth-moment matrix computed from Lyapunov equations.
The reduction draws on an early version of Williams’s work, [Williams, 2001].
Williams [2019], the published version, notes that the early version misapplied a large-deviation theorem, a discrepancy that matters only for dynamic models like the one in this lecture, so the CWS calculations for the dynamic model rest on that shortcut.
They solve the control problem (103.13) numerically for the Nash self-confirming equilibrium of the dynamic model and find (their Figure 3) that along the dominant escape path the sum of weights on inflation rises from \(-1\) to nearly zero, the value that activates the induction hypothesis — that is, the escape heads toward the Ramsey outcome.
Sargent and Williams [2005] replace recursive least squares with a Kalman filter whose drift covariance \(V\) is fixed, and study how \(V\) reshapes the escape (Priors, Escapes, and Learning Cycles).
The constant-gain algorithm of this lecture is a Kalman filter whose drift covariance is proportional to the current \(P_{t-1}\) (see below); a fixed \(V\) reproduces it only asymptotically.
Kasa [2004] applies the same large-deviation machinery to recurrent currency crises.
103.2.8. From computation to adaptation#
The preceding recursions were introduced as algorithms to approximate a self-confirming equilibrium.
The same mathematics tells us what happens when we instead modify our self-confirming-equilibrium models to incorporate real-time adaptation — simply by reading \(\phi_n\) as the government’s time-\(n\) beliefs rather than as the \(n\)-th iterate of a solver.
Two facts organize everything below:
gain sequences that implement least squares (decreasing like \(1/t\)) make the mean dynamics pull the economy toward self-confirming equilibria, at least asymptotically; while
gain sequences that fall off more slowly — in the limit, constant gains that discount the past — arrest that pull and increase the frequency with which the escape dynamics influence outcomes.
Note
A brief intellectual history.
Lucas and Prescott [1971] dismissed iterating on the moment conditions (103.4) as a computational strategy, but Townsend [1983] used it.
DeCanio [1979] and Evans [1985], Evans [1989] used the map from perceived to actual laws of motion to define expectational stability.
Woodford [1990] and Marcet and Sargent [1989], Marcet and Sargent [1989] used the mean dynamics (103.8) to establish conditions for the convergence of least squares learning to rational expectations in models with self-reference, both requiring continuity of \(b(\phi)\).
In-Koo Cho studied problems with discontinuous \(b(\phi)\) inherited from discontinuous decision rules (trigger strategies in credibility and search problems); to make least squares learning approach rational expectations he used gains satisfying \(\tfrac{1}{\sqrt n} < a_n < \tfrac{1}{\log n}\), which yield a diffusion approximation to (103.6) that promotes enough experimentation to discover an equilibrium (footnote 8 of chapter 8 of Sargent [1999] prints the two bounds the other way round, which describes an empty set because \(\log n < \sqrt n\)).
Kandori et al. [1993] use related mathematics to select long-run equilibria in games via mutation, and Roger Myerson applied an escape-route calculation to a voting problem.
The modern synthesis of these learning methods is Evans and Honkapohja [2001].
103.3. The adaptive model#
We now build the classical adaptive model.
103.3.1. Government beliefs and behavior#
The government believes in a distributed-lag Phillips curve
Arriving at time \(t\) with an estimate \(\gamma_{t-1}\), it sets the systematic part of inflation by solving the Phelps problem as if \(\gamma_{t-1}\) will govern the Phillips curve forever:
It then updates its beliefs by recursive least squares (RLS):
where \(\{g_t\}\) is the gain sequence.
Least squares sets \(g_t = 1/t\); a constant-gain algorithm sets \(g_t = g_0 > 0\) and discounts past observations, which is sensible if the government suspects the Phillips curve wanders over time.
Readers arriving from A government learning the Phillips curve should note a change of letters: there, and throughout the Bounded Rationality lectures (Notation across the series), \(\gamma\) is the gain and \(\alpha\) the beliefs, whereas here, following the book, \(\gamma\) denotes the beliefs and \(g_t\), or \(1 - \lambda\) below, the gain (see also A note on notation).
The public is assumed to know the government’s rule, so its inflation forecast is \(x_t = h(\gamma_{t-1}) X_{t-1}\), the systematic part of (103.17).
Unemployment is generated by the actual Phillips curve of Self-Confirming Equilibria with \(\rho_1 = \rho_2 = 0\):
103.3.2. The Phelps problem with lags#
Given a belief \(\gamma\), the decision rule \(h(\gamma)\) solves an LQ control problem.
Write the believed Phillips curve as \(U_t = \gamma_0 y_t + c^\top s_t\), where \(\gamma_0\) is the coefficient on current inflation and \(c\) collects the coefficients on the state \(s_t = X_{t-1}\).
The government minimizes \(\mathbb{E}\sum_t \delta^t (U_t^2 + y_t^2)\), so the per-period loss is \(s_t^\top (cc^\top) s_t + (\gamma_0^2 + 1) y_t^2 + 2\gamma_0\, y_t\, c^\top s_t\), and the state evolves as \(s_{t+1} = A s_t + B y_t\) with
This is the Phelps problem of Adaptive Expectations and the Phelps Problem, now with a distributed-lag Phillips curve.
We solve the discounted LQ problem with scipy’s discrete algebraic Riccati equation.
To fold the discount factor into an undiscounted problem we scale \(A\) and \(B\) by \(\sqrt{\delta}\).
The cross-product term \(2\gamma_0\, y_t\, c^\top s_t\) in the loss (N in the code) is a per-period cost, like the other two terms, so it is not scaled.
class AdaptivePhillips:
    """
    Classical adaptive Phillips curve model: the government re-estimates a
    distributed-lag Phillips curve by recursive least squares and each period
    acts on the first-period recommendation of the Phelps problem.
    """

    def __init__(self, θ=1.0, U_star=5.0, σ1=0.3, σ2=0.3, δ=0.98):
        self.θ, self.U_star, self.σ1, self.σ2, self.δ = θ, U_star, σ1, σ2, δ

        # classical self-confirming belief: U = -θ y + (θ²+1)U*
        self.γ_sce = np.array([-θ, 0.0, 0.0, 0.0, 0.0, (θ**2 + 1) * U_star])

        # self-confirming moment matrix M = E[X_C X_C'] and residual variance
        self.M = self._sce_moments()
        self.σC2 = σ1**2                       # var(U | X_C) at the SCE

    def _sce_moments(self):
        "E[X_C X_C'] at the serially-uncorrelated classical SCE."
        θ, σ1, σ2 = self.θ, self.σ1, self.σ2
        μU, μy = self.U_star, self.θ * self.U_star
        Σ = {('U', 'U'): θ**2 * σ2**2 + σ1**2, ('y', 'y'): σ2**2,
             ('U', 'y'): -θ * σ2**2, ('y', 'U'): -θ * σ2**2}
        # regressors: (time, type) for [y_t, U_{t-1}, U_{t-2}, y_{t-1}, y_{t-2}, 1]
        regs = [(0, 'y'), (1, 'U'), (2, 'U'), (1, 'y'), (2, 'y'), (None, 'c')]
        mean = {'U': μU, 'y': μy, 'c': 1.0}
        M = np.zeros((6, 6))
        for i, (ti, tyi) in enumerate(regs):
            for j, (tj, tyj) in enumerate(regs):
                if tyi == 'c' or tyj == 'c' or ti != tj:
                    M[i, j] = mean[tyi] * mean[tyj]
                else:
                    M[i, j] = Σ[(tyi, tyj)] + mean[tyi] * mean[tyj]
        return M

    def phelps_h(self, γ):
        "Government decision rule ŷ_t = h(γ)·X_{t-1} for belief γ."
        δ, γ0, c = self.δ, γ[0], γ[1:]
        R = np.outer(c, c)
        Q = np.array([[γ0**2 + 1.0]])
        N = (γ0 * c).reshape(1, -1)
        A = np.zeros((5, 5)); B = np.zeros((5, 1))
        A[0, :] = c; B[0, 0] = γ0          # U_t
        A[1, 0] = 1.0                       # U_{t-1}
        B[2, 0] = 1.0                       # y_t
        A[3, 2] = 1.0                       # y_{t-1}
        A[4, 4] = 1.0                       # constant
        sb = np.sqrt(δ)
        Ad, Bd = sb * A, sb * B             # discounting folded into A, B
        P = solve_discrete_are(Ad, Bd, R, Q, s=N.T)   # cross term unscaled
        F = np.linalg.solve(Q + Bd.T @ P @ Bd, Bd.T @ P @ Ad + N)
        return -F.ravel()
We use the Kalman-filter implementation of RLS from Appendix A of Sargent [1999].
The government treats \(\gamma\) as a hidden state that follows a random walk, \(\tilde\gamma_t = \tilde\gamma_{t-1} + w_t\), and observes it through the regression \(U_t = \tilde\gamma_t^\top X_{C,t} + \varepsilon_{C,t}\); the Kalman filter of A First Look at the Kalman Filter then updates its estimate \(\gamma_t\) and the estimate’s covariance matrix \(P_t\).
A forgetting factor \(\lambda \in (0, 1]\) maps to the gain:
\(\lambda = 1\) sets the drift covariance \(\mathbb{E} w_t w_t^\top\) to zero and gives least squares (\(g_t \to 1/t\));
\(\lambda < 1\) sets \(\mathbb{E} w_t w_t^\top = (1/\lambda - 1) P_{t-1}\), a drift covariance proportional to the government’s current uncertainty, and gives a constant gain \(g_0 = 1 - \lambda\).
The prior is initialized as if the government had already seen \(T_0\) periods of self-confirming-equilibrium data, through \(P_0 = (\sigma_C^2 / T_0)\, M^{-1}\); larger \(T_0\) (T_prior in the code) means a tighter prior.
The function also returns the final beliefs and covariance matrix, which we use below.
def simulate(model, λ, T_prior, n=1000, seed=0):
    "Simulate the adaptive system. λ=1 is least squares; λ<1 is constant gain."
    rng = np.random.default_rng(seed)
    θ, U_star, σ1, σ2 = model.θ, model.U_star, model.σ1, model.σ2

    γ = model.γ_sce.copy()
    P = (model.σC2 / T_prior) * np.linalg.inv(model.M)
    R2 = model.σC2
    g0 = 1 - λ

    U1 = U2 = U_star
    y1 = y2 = θ * U_star
    y_path, U_path, sumweights, constant = (np.empty(n) for _ in range(4))

    for t in range(n):
        h = model.phelps_h(γ)
        X_lag = np.array([U1, U2, y1, y2, 1.0])
        yhat = h @ X_lag

        v2, v1 = σ2 * rng.standard_normal(), σ1 * rng.standard_normal()
        y = yhat + v2
        U = U_star - θ * (y - yhat) + v1

        φ = np.array([y, U1, U2, y1, y2, 1.0])           # X_C,t
        denom = R2 + φ @ P @ φ
        gain = P @ φ / denom
        γ = γ + gain * (U - γ @ φ)
        R1 = (g0 / (1 - g0)) * P if λ < 1 else 0.0        # constant vs decreasing
        P = P - np.outer(P @ φ, φ @ P) / denom + R1

        y_path[t], U_path[t] = y, U
        sumweights[t] = γ[0] + γ[3] + γ[4]               # weights on current+lagged y
        constant[t] = γ[5]
        U2, U1 = U1, U
        y2, y1 = y1, y

    return dict(y=y_path, U=U_path, sumweights=sumweights, constant=constant,
                γ=γ, P=P)
Let’s check the decision rule at the self-confirming belief.
model = AdaptivePhillips()
h_sce = model.phelps_h(model.γ_sce)
print("decision rule at the self-confirming belief:")
print(f"  h(γ_sce) = {np.round(h_sce, 3) + 0.0}  (a constant rule of "
      f"{h_sce[-1]:.1f} = Nash inflation)")
decision rule at the self-confirming belief:
  h(γ_sce) = [0. 0. 0. 0. 5.]  (a constant rule of 5.0 = Nash inflation)
At the self-confirming belief the Phelps rule is a constant equal to the Nash inflation rate, and the beliefs reproduce themselves — the adaptive system’s rest point is the self-confirming equilibrium of Self-Confirming Equilibria.
We follow Sargent [1999] in setting the true data-generating parameters to the classical example at the end of Self-Confirming Equilibria: \(U^* = 5\), \(\theta = 1\), \(\sigma_1 = \sigma_2 = 0.3\), \(\rho_1 = \rho_2 = 0\), \(\delta = 0.98\).
The classical self-confirming equilibrium has serially uncorrelated \((U, y)\) fluctuating around means \((5, 5)\).
103.4. Mean dynamics near the self-confirming equilibrium#
Before simulating, we compute the mean dynamics (103.8) for this model and their behavior near the self-confirming equilibrium.
Substituting the government’s rule (103.17) and the public’s forecast into the true Phillips curve gives
The shock \(v_{1t}\) is independent of every regressor in \(X_{C,t}\).
So when the government uses the rule \(h(\gamma)\), the population regression of \(U_t\) on \(X_{C,t}\) is exactly
where \(h_j(\gamma)\) is the \(j\)-th entry of \(h(\gamma)\).
This is the \(T\)-map of One recursion, many learners for our model: it sends the government’s perceived Phillips curve to the actual one that its policy generates.
Applied to the recursive least squares algorithm (103.18), stochastic approximation delivers the mean dynamics (equation (89) of the book)
where \(\tau\) is artificial time and \(M(\gamma) = \mathbb{E} X_{C,t} X_{C,t}^\top\) is computed from the stationary distribution of the system when the government’s beliefs are frozen at \(\gamma\).
A rest point has \(T(\gamma) = \gamma\) and \(R_{XC} = M(\gamma)\): it is a self-confirming equilibrium.
At a rest point the Jacobian of (103.20) is block triangular.
Its eigenvalues are therefore those of \(DT - I\), together with repeated eigenvalues of \(-1\) from the \(R_{XC}\) block (Proposition 137.2 of Least Squares Learning in Self-Referential Models).
We compute \(DT\) at the self-confirming belief by finite differences.
def T_map(model, γ):
    "Population regression of U_t on X_C,t when the government uses h(γ)."
    θ, h = model.θ, model.phelps_h(γ)
    return np.concatenate([[-θ], θ * h[:4], [model.U_star + θ * h[4]]])


def jacobian_T(model, ε=1e-5):
    "Finite-difference Jacobian of T at the self-confirming belief."
    J = np.empty((6, 6))
    for j in range(6):
        d = np.zeros(6)
        d[j] = ε
        J[:, j] = (T_map(model, model.γ_sce + d)
                   - T_map(model, model.γ_sce - d)) / (2 * ε)
    return J


DT_I = jacobian_T(model) - np.eye(6)
print("DT - I at the self-confirming belief:")
print(np.round(DT_I, 3) + 0.0)
print("eigenvalues:", np.round(np.sort(np.linalg.eigvals(DT_I).real), 4))
print(f"-1/(1 + θ²) = {-1 / (1 + model.θ**2)}")
DT - I at the self-confirming belief:
[[-1.     0.     0.     0.     0.     0.   ]
 [ 0.    -0.5    0.     0.     0.     0.   ]
 [ 0.     0.    -0.5    0.     0.     0.   ]
 [ 0.     0.     0.    -0.5    0.     0.   ]
 [ 0.     0.     0.     0.    -0.5    0.   ]
 [ 0.     2.45   2.401 -2.45  -2.401 -0.5  ]]
eigenvalues: [-1.  -0.5 -0.5 -0.5 -0.5 -0.5]
-1/(1 + θ²) = -0.5
The matrix \(DT - I\) is lower triangular, so its eigenvalues are its diagonal entries.
The first, \(-1\), belongs to the coefficient on current inflation: \(T\) assigns that coefficient \(-\theta\) whatever the government believes.
The other five all equal \(-1/(1+\theta^2) = -\tfrac12\).
The second group has a simple source.
At the self-confirming equilibrium the lags carry no weight, and to first order the Phelps rule responds to a small believed coefficient \(c_j\) on a lagged variable as the static first-order condition \(y_t = \theta\, c^\top X_{t-1} / (1+\theta^2)\) prescribes.
That makes the diagonal entry of \(DT\) equal to \(\theta^2/(1+\theta^2)\).
The off-diagonal entries all sit in the last row: a believed coefficient on a lag also shifts the constant in the rule, through the dynamic part of the Phelps problem.
The repeated eigenvalue \(-1/(1+\theta^2)\) is the same number as the slope \(\mathcal{M}\) of the scalar mean dynamics in Least squares learning converges to Nash, where the public learned a single number, and as the classical E-stability eigenvalue of Uniqueness and E-stability.
Sargent [1999] reports a repeated eigenvalue of \(-.5\) “of multiplicity 6”, together with repeated eigenvalues of \(-1\) for \(R_{XC}\).
The computation shows that the multiplicity is five; the sixth eigenvalue for the beliefs, the one for the coefficient on current inflation, is \(-1\).
All eigenvalues are negative, so the self-confirming equilibrium is E-stable.
At \(\theta = 1\) the repeated eigenvalue sits exactly on the \(-\tfrac12\) boundary, so least squares converges more slowly than the usual \(\sqrt{t}\) rate, as in the scalar case of Least squares learning converges to Nash.
As noted in the primer, that boundary concerns the asymptotic distribution of the least squares estimates; how often a constant-gain government escapes is governed instead by the minimized action \(\bar S\).
Exercise 103.3 asks how the eigenvalues change with \(\theta\).
103.5. Least squares learning: a decreasing gain#
First, least squares (a decreasing gain), with a tight prior worth \(T_0 = 5000\) periods of data.
ls = simulate(model, λ=1.0, T_prior=5000, n=1000, seed=1)

fig, ax = plt.subplots(figsize=(9, 4.5))
ax.plot(ls['y'], lw=0.8)
ax.axhline(5, color='k', ls='--', lw=1, label='self-confirming (Nash)')
ax.axhline(0, color='C2', ls=':', lw=1, label='Ramsey')
ax.set_xlabel('$t$')
ax.set_ylabel('inflation $y_t$')
ax.legend()
plt.show()
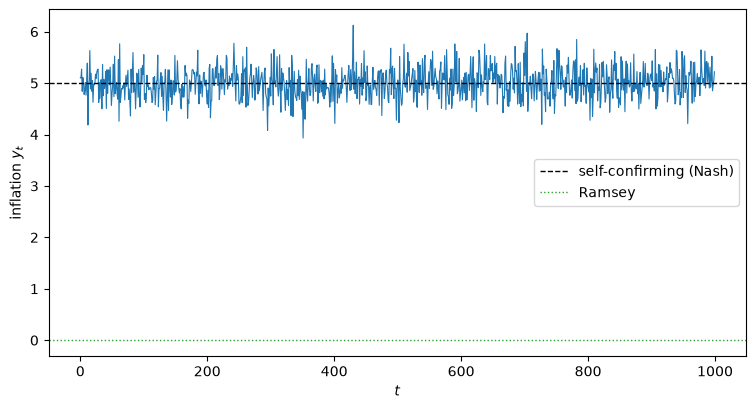
Fig. 103.1 Classical adaptive model under least squares with a tight prior: inflation hugs the self-confirming value#
In Fig. 103.1 inflation hugs the self-confirming value of 5, and the simulation looks like a draw from the self-confirming equilibrium itself.
This is the outcome the book describes: least squares gets us nothing new, and the government is stuck near Nash.
But the result depends on the prior.
The book’s Figure 8.1 uses a looser prior, \(T_0 = 800\), and shows 400 periods in which inflation stays near 5.
Let’s compare eight paths of 1000 periods under each prior.
To see through the noise we plot a 20-period moving average of inflation, and we call the first date at which that average falls below 1 the government’s first escape.
def moving_average(y, k=20):
    return np.convolve(y, np.ones(k) / k, mode='valid')


def first_escape(y, k=20, level=1.0):
    "First date at which the k-period moving average of y falls below level."
    below = moving_average(y, k) < level
    return int(np.argmax(below)) if below.any() else None


def returns_to_nash(y, k=20, level=4.0):
    "Whether the moving average climbs back above level after the first escape."
    t = first_escape(y, k)
    return t is not None and bool((moving_average(y, k)[t:] > level).any())


ls_runs = {T0: [simulate(model, λ=1.0, T_prior=T0, n=1000, seed=s)
                for s in range(8)]
           for T0 in (5000, 800)}

fig, axes = plt.subplots(1, 2, figsize=(11, 4), sharey=True)
for ax, (T0, runs) in zip(axes, ls_runs.items()):
    for sim in runs:
        ax.plot(np.arange(19, 1000), moving_average(sim['y']), lw=0.8)
    ax.axhline(5, color='k', ls='--', lw=1)
    ax.axhline(0, color='C2', ls=':', lw=1)
    ax.set_title(rf'$T_0 = {T0}$')
    ax.set_xlabel('$t$')
axes[0].set_ylabel('20-period moving average of $y_t$')
plt.tight_layout()
plt.show()

for T0, runs in ls_runs.items():
    escapes = [first_escape(sim['y']) for sim in runs]
    print(f"T_0 = {T0}: {sum(e is not None for e in escapes)} of {len(runs)} "
          f"paths escape; {sum(returns_to_nash(sim['y']) for sim in runs)} "
          f"of them return above 4")
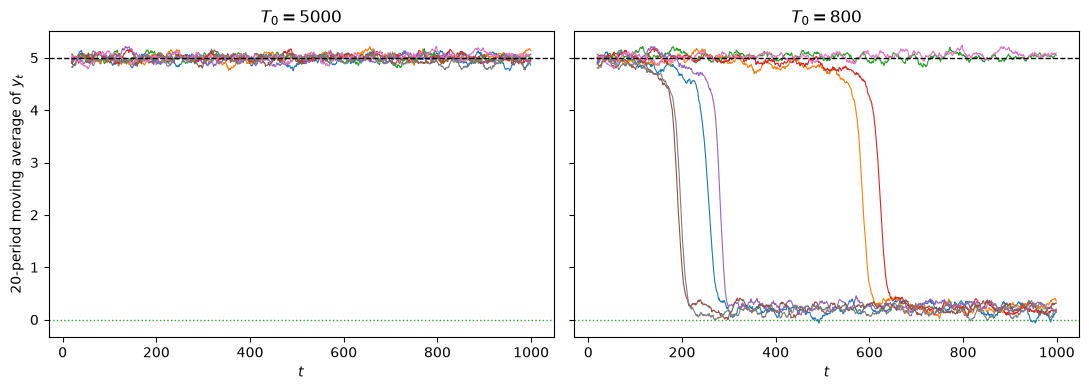
Fig. 103.2 Least squares under a tight and a looser prior: escapes under the looser prior stick#
T_0 = 5000: 0 of 8 paths escape; 0 of them return above 4
T_0 = 800: 6 of 8 paths escape; 0 of them return above 4
Under the looser prior, Fig. 103.2 shows least squares escaping toward Ramsey, and every path that escapes stays there.
Why, if least squares converges to the self-confirming equilibrium?
Because the convergence theorems are about the limit.
With a prior worth \(T_0\) periods, the least squares gain is \(1/(T_0 + t)\), so after \(t\) periods artificial time (103.7) has advanced by about \(\tau = \log\left((T_0 + t)/T_0\right)\).
The clock slows as it runs: each additional unit of \(\tau\) costs \(e \approx 2.7\) times as many periods as the one before.
A constant gain \(g_0\), by contrast, advances \(\tau\) by \(g_0\) every period.
That explains both panels.
A tight prior slows the clock from the start: 1000 periods supply only \(\log(6000/5000) \approx 0.18\) units of artificial time when \(T_0 = 5000\), against \(\log(1800/800) \approx 0.81\) when \(T_0 = 800\).
And once the government has escaped, the slowing clock also delays the return.
To see how much artificial time the return needs, we integrate the mean dynamics (103.20) from the beliefs \((\gamma_t, R_{XC,t})\) that one escaped path holds at \(t = 1000\).
We obtain \(M(\gamma)\) from the stationary distribution of \((y_t, U_t)\) under the frozen rule \(h(\gamma)\), using a discrete Lyapunov equation.
Under least squares, \(R_{XC,t} = \sigma_C^2 P_t^{-1}/(T_0 + t)\).
def stationary_moments(model, γ):
    """
    Mean inflation and M(γ) = E[X_C X_C'] in the stationary distribution
    of the true system when the government's beliefs are frozen at γ.
    """
    θ, U_star, σ1, σ2 = model.θ, model.U_star, model.σ1, model.σ2
    h = model.phelps_h(γ)
    # z_t = (y_t, y_{t-1}, y_{t-2}, U_t, U_{t-1}, U_{t-2}) obeys
    # z_t = c + A z_{t-1} + C (v_1t/σ1, v_2t/σ2)
    A = np.zeros((6, 6))
    A[0, [0, 1, 3, 4]] = h[2], h[3], h[0], h[1]   # the rule h(γ)
    A[1, 0] = A[2, 1] = A[4, 3] = A[5, 4] = 1.0
    c = np.array([h[4], 0, 0, U_star, 0, 0])
    C = np.zeros((6, 2))
    C[0] = 0, σ2                                  # y_t = h X_{t-1} + v_2t
    C[3] = σ1, -θ * σ2                            # U_t = U* - θ v_2t + v_1t
    μ = np.linalg.solve(np.eye(6) - A, c)
    Σ = solve_discrete_lyapunov(A, C @ C.T)
    # X_C = (y_t, U_{t-1}, U_{t-2}, y_{t-1}, y_{t-2}, 1)
    idx = [0, 4, 5, 1, 2]
    M = np.ones((6, 6))
    M[:5, :5] = Σ[np.ix_(idx, idx)] + np.outer(μ[idx], μ[idx])
    M[:5, 5] = M[5, :5] = μ[idx]
    return μ[0], M


def mean_dynamics(τ, x, model):
    "Right side of the mean dynamics for the stacked vector (γ, col R_XC)."
    γ, R = x[:6], x[6:].reshape(6, 6)
    _, M = stationary_moments(model, γ)
    dγ = np.linalg.solve(R, M @ (T_map(model, γ) - γ))
    return np.concatenate([dγ, (M - R).ravel()])


def halfway(τ, x, model):
    "Event: mean inflation climbs back to half the Nash rate."
    return stationary_moments(model, x[:6])[0] - 0.5 * model.θ * model.U_star


halfway.direction = 1

T0, n = 800, 1000
sim = next(s for s in ls_runs[T0] if first_escape(s['y']) is not None)
R_n = model.σC2 * np.linalg.inv(sim['P']) / (T0 + n)
x0 = np.concatenate([sim['γ'], R_n.ravel()])

τ_grid = [0, 1, 2, 5, 10, 20, 30]
sol = solve_ivp(mean_dynamics, (0, τ_grid[-1]), x0, t_eval=τ_grid,
                events=halfway, args=(model,), rtol=1e-6, atol=1e-8)

print(f"{'τ':>4} {'sum of weights':>15} {'mean inflation':>15} "
      f"{'periods, least squares':>23} {'periods, gain 0.025':>20}")
for τ, x in zip(sol.t, sol.y.T):
    γ = x[:6]
    print(f"{τ:4.0f} {γ[0] + γ[3] + γ[4]:15.2f} "
          f"{stationary_moments(model, γ)[0]:15.2f} "
          f"{(T0 + n) * (np.exp(τ) - 1):23.1e} {τ / 0.025:20,.0f}")

τ_half = sol.t_events[0][0]
print(f"\nmean inflation is back to {0.5 * model.θ * model.U_star} at τ = "
      f"{τ_half:.1f}: after {(T0 + n) * (np.exp(τ_half) - 1):.1e} more periods "
      f"of least squares, or {τ_half / 0.025:.0f} periods at a gain of 0.025")
   τ  sum of weights  mean inflation  periods, least squares  periods, gain 0.025
   0            0.00            0.21                 0.0e+00                    0
   1           -0.00            0.25                 3.1e+03                   40
   2           -0.01            0.30                 1.2e+04                   80
   5           -0.11            1.07                 2.7e+05                  200
  10           -0.27            2.10                 4.0e+07                  400
  20           -0.52            3.35                 8.7e+11                  800
  30           -0.72            4.10                 1.9e+16                1,200

mean inflation is back to 2.5 at τ = 12.6: after 5.6e+08 more periods of least squares, or 506 periods at a gain of 0.025
The last two columns count periods after \(t = 1000\).
The mean dynamics do carry the beliefs back toward the self-confirming equilibrium: the sum of weights on inflation falls back toward \(-1\), and mean inflation climbs back toward 5.
So least squares converges, but only asymptotically.
Near the induction hypothesis the mean dynamics are weak, and the return needs many units of artificial time.
A constant gain of 0.025 supplies them within several hundred periods.
Least squares supplies them only over a span of time that dwarfs any historical sample, because a falling gain slows the return as well as the departure.
In a finite sample, then, a decreasing gain can turn an early escape into an escape that sticks.
Paths of this kind, one escape followed by a long stay near Ramsey, resemble what Sims and Chung found with their Kalman filters, although the mechanism here differs from theirs; Priors, Escapes, and Learning Cycles (Sims’s nonconvergence) explains their outcome through the prior in their filters.
Exercise 103.2 measures how often least squares escapes under three priors.
103.6. Constant gain and escape dynamics#
Now give the government a constant gain \(g_0 = 1 - \lambda = 0.025\), so it discounts past data.
We use the book’s Figure 8.2 settings, \(\lambda = 0.975\) and \(T_0 = 300\); other lectures in this suite use other gains, each taken from its own source.
cg = simulate(model, λ=0.975, T_prior=300, n=1000, seed=1)

fig, ax = plt.subplots(figsize=(9, 4.5))
ax.plot(cg['y'], lw=0.8)
ax.axhline(5, color='k', ls='--', lw=1, label='self-confirming (Nash)')
ax.axhline(0, color='C2', ls=':', lw=1, label='Ramsey')
ax.set_xlabel('$t$')
ax.set_ylabel('inflation $y_t$')
ax.legend()
plt.show()
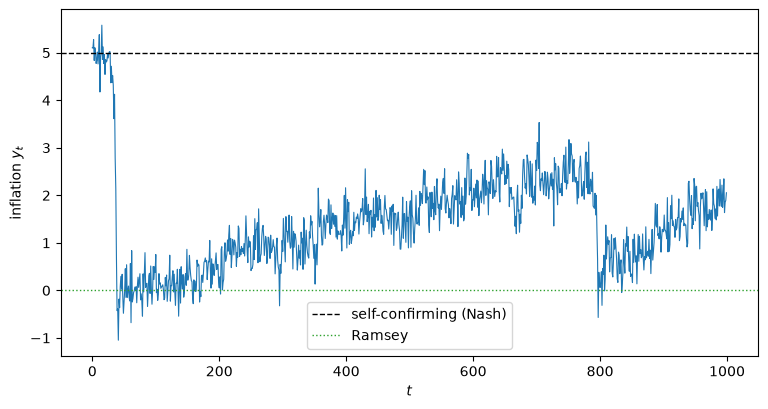
Fig. 103.3 Classical adaptive model under a constant gain: recurrent escapes toward Ramsey#
In Fig. 103.3 inflation starts near the self-confirming value of 5 and within a few dozen periods drops almost to zero.
Over the next several hundred periods it drifts back up, but only part of the way toward 5, before a second stabilization sends it back toward zero.
The mean dynamics that pull the system toward the self-confirming equilibrium are opposed by a recurrent force that sends inflation close to the Ramsey outcome.
The drift back up is the slow return computed in Least squares learning: a decreasing gain, now run on a clock that does not slow down: the mean dynamics pull the beliefs back, and the noise launches a new escape before they get there.
Sargent [1999] checked that no large shocks trigger these stabilizations: they are an endogenous feature of the constant-gain learning dynamics.
One path can mislead, so we repeat the simulation for 24 seeds.
For each path we record the date of the first escape, the fraction of periods with inflation below 2, and whether the moving average of inflation ever climbs back above 4 after the first escape.
We also record the lowest value that the sum of weights on current and lagged inflation reaches after the first escape; we return to that sum below.
cg_runs = [simulate(model, λ=0.975, T_prior=300, n=1000, seed=s)
           for s in range(24)]

firsts = [first_escape(sim['y']) for sim in cg_runs]
frac_low = [(sim['y'] < 2).mean() for sim in cg_runs]
low_sw = [sim['sumweights'][t + 20:].min()
          for sim, t in zip(cg_runs, firsts) if t is not None]

print(f"paths that escape: {sum(t is not None for t in firsts)} of {len(cg_runs)}")
escaped = [t for t in firsts if t is not None]
print(f"first escape: median t = {np.median(escaped):.0f}, latest t = {max(escaped)}")
print(f"fraction of periods with y < 2: {min(frac_low):.0%} to "
      f"{max(frac_low):.0%} across seeds (mean {np.mean(frac_low):.0%})")
print(f"paths that return above 4 after escaping: "
      f"{sum(returns_to_nash(sim['y']) for sim in cg_runs)}")
print(f"lowest sum of weights after the first escape: {min(low_sw):.2f}")
paths that escape: 24 of 24
first escape: median t = 56, latest t = 145
fraction of periods with y < 2: 74% to 95% across seeds (mean 83%)
paths that return above 4 after escaping: 0
lowest sum of weights after the first escape: -0.71
Every path escapes early, inflation is below 2 in most periods, and no path’s moving average climbs back above 4 within 1000 periods.
At this gain escapes are frequent, not rare.
The large-deviation statement that escapes become exponentially rare is a small-gain limit; Simulating escapes measures how escape times grow as the gain shrinks.
103.7. The escape route and the induction hypothesis#
Why does the system escape toward Ramsey rather than in some other direction?
The answer is the induction hypothesis of Adaptive Expectations and the Phelps Problem: when the sum of the weights on current and lagged inflation in the estimated Phillips curve approaches zero, the Phelps problem advises the government to reduce inflation.
Let’s plot inflation together with that sum of weights.
fig, axes = plt.subplots(2, 1, figsize=(9, 7), sharex=True)

axes[0].plot(cg['y'], lw=0.8)
axes[0].axhline(0, color='C2', ls=':', lw=1)
axes[0].set_ylabel('inflation $y_t$')

axes[1].plot(cg['sumweights'], lw=0.8, color='C1')
axes[1].axhline(-1, color='k', ls='--', lw=1, label='self-confirming value')
axes[1].axhline(0, color='C3', ls=':', lw=1, label='induction hypothesis')
axes[1].set_xlabel('$t$')
axes[1].set_ylabel('sum of weights on $y$')
axes[1].legend()

plt.tight_layout()
plt.show()
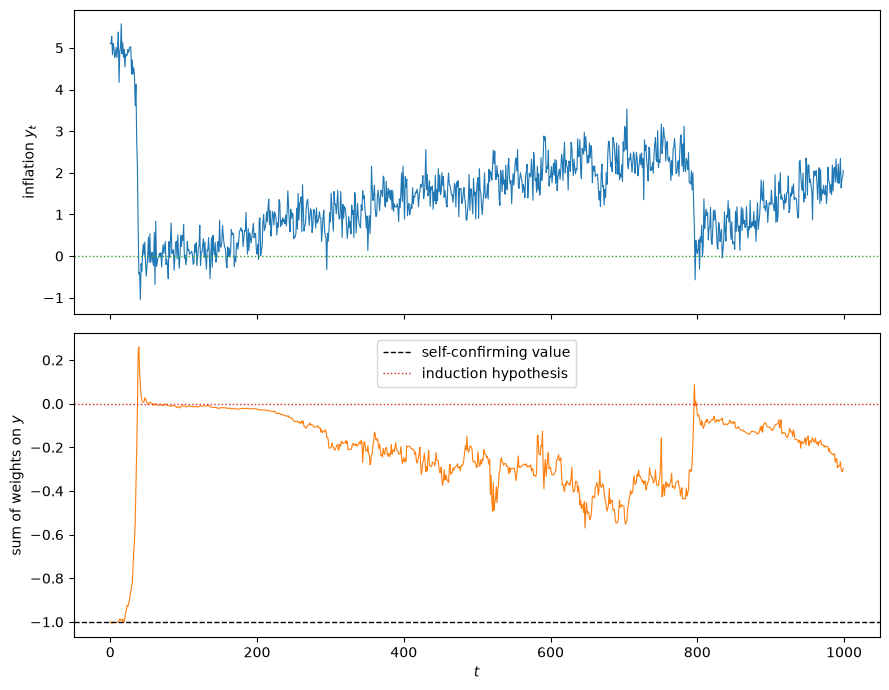
Fig. 103.4 Stabilizations coincide with the sum of weights on inflation rising toward zero#
In Fig. 103.4 the first stabilization coincides with the sum of weights jumping from its self-confirming value of \(-1\) to about zero.
The sum of weights never goes back to \(-1\), here or in any of the 24 runs above.
As inflation drifts back up, the sum of weights falls only part of the way toward \(-1\), and the next stabilization coincides with its rising back toward zero.
When it reaches zero, the induction hypothesis is (temporarily) satisfied, the Phelps problem calls for near-Ramsey inflation, and the resulting data briefly reinforce the induction hypothesis — a situation that is not self-confirming in the technical sense but is nonetheless self-reinforcing.
We can see the escape route directly by plotting the joint path of the constant and the sum of weights in the estimated Phillips curve.
fig, ax = plt.subplots(figsize=(8, 6))
sc = ax.scatter(cg['constant'], cg['sumweights'], c=np.arange(len(cg['y'])),
                cmap='viridis', s=6)
ax.axhline(0, color='C3', ls=':', lw=1.5, label='induction hypothesis')
ax.axhline(-1, color='k', ls='--', lw=1, label='self-confirming value')
ax.set_xlabel('constant in estimated Phillips curve')
ax.set_ylabel('sum of weights on $y$')
ax.legend()
plt.colorbar(sc, label='time $t$')
plt.show()
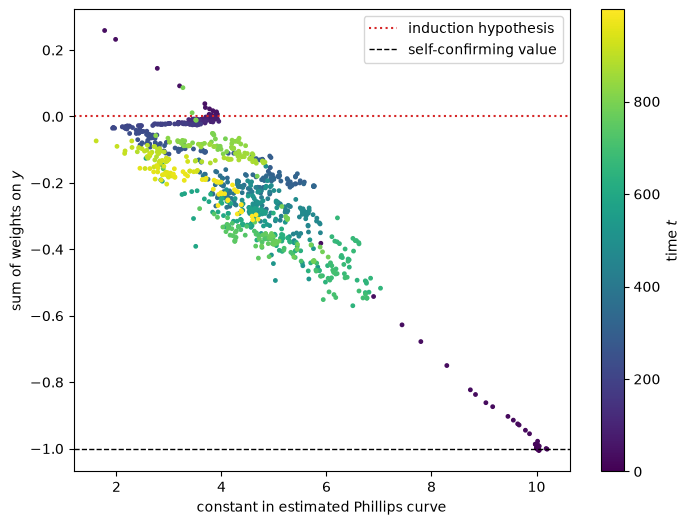
Fig. 103.5 The escape route in belief space, coloured by time#
In Fig. 103.5 the beliefs leave the self-confirming point (constant 10, sum of weights \(-1\)) early and do not come back to it.
Afterwards they move back and forth below the induction line: as inflation drifts up, the sum of weights falls and the constant rises, and each stabilization sends the beliefs back up toward the induction line (sum of weights \(= 0\)).
That line is the end of the escape route along which the government learns a Solow-Tobin version of the natural-rate hypothesis and stabilizes inflation.
103.8. Relation to equilibria under forecast misspecification#
The near-Ramsey episodes are reminiscent of the equilibria with optimal misspecified forecasts of Optimal Misspecified Beliefs and Self-Confirming Equilibria.
There, a forecasting model without a constant but with a unit root could closely approximate a true model that includes a constant.
Here an approximation with a similar flavor operates during the near-Ramsey episodes: the government’s estimated Phillips curve, by driving the sum of weights toward zero, uses the induction hypothesis to approximate a constant — except that the approximated model is not fixed but changes as the government’s own beliefs feed back through the Phelps problem.
103.9. Role of the discount factor#
Sargent [1999] reports two findings about the government’s discount factor \(\delta\):
the recurrent stabilizations toward Ramsey depend on \(\delta\) being near one; and
lowering \(\delta\) raises the inflation rate observed during the low-inflation episodes.
The book does not report the simulations behind them, so let’s run some.
We simulate 16 seeds for each of three discount factors, reusing the first 16 constant-gain runs above for \(\delta = 0.98\).
δ_runs = {0.98: cg_runs[:16]}
for δ in (0.90, 0.95):
    m = AdaptivePhillips(δ=δ)
    δ_runs[δ] = [simulate(m, λ=0.975, T_prior=300, n=1000, seed=s)
                 for s in range(16)]

for δ in sorted(δ_runs):
    runs = δ_runs[δ]
    firsts = [first_escape(sim['y']) for sim in runs]
    eig = np.linalg.eigvals(jacobian_T(AdaptivePhillips(δ=δ)) - np.eye(6)).real
    print(f"δ = {δ}: {sum(t is not None for t in firsts)} of {len(runs)} escape, "
          f"median first escape t = {np.median([t for t in firsts if t is not None]):.0f}, "
          f"mean inflation for t ≥ 200 = {np.mean([sim['y'][200:].mean() for sim in runs]):.2f}, "
          f"eig(DT - I) = {np.unique(np.round(eig, 4))}")
δ = 0.9: 16 of 16 escape, median first escape t = 56, mean inflation for t ≥ 200 = 1.70, eig(DT - I) = [-1.  -0.5]
δ = 0.95: 16 of 16 escape, median first escape t = 55, mean inflation for t ≥ 200 = 1.44, eig(DT - I) = [-1.  -0.5]
δ = 0.98: 16 of 16 escape, median first escape t = 54, mean inflation for t ≥ 200 = 1.24, eig(DT - I) = [-1.  -0.5]
Over this range of discount factors the second finding holds, but the first does not.
The timing of the first escape hardly depends on \(\delta\); what changes is how low inflation goes once the government has escaped.
That makes sense.
At the self-confirming equilibrium the Phelps rule is a constant, Nash inflation, for every \(\delta\), and the eigenvalues computed in Mean dynamics near the self-confirming equilibrium do not depend on \(\delta\) either, so the forces that govern the escape are much the same.
Once the induction hypothesis is active, though, the government believes it faces a vertical long-run Phillips curve and a short-run tradeoff, and Adaptive Expectations and the Phelps Problem showed that a discounted Phelps problem of that kind stops short of zero inflation, more so the less patient the government is.
fig, ax = plt.subplots(figsize=(9, 4.5))
for δ in sorted(δ_runs):
    ax.plot(np.arange(19, 1000), moving_average(δ_runs[δ][1]['y']),
            lw=0.9, label=rf'$\delta = {δ}$')
ax.axhline(0, color='k', lw=0.5)
ax.set_xlabel('$t$')
ax.set_ylabel('20-period moving average of $y_t$')
ax.legend()
plt.show()
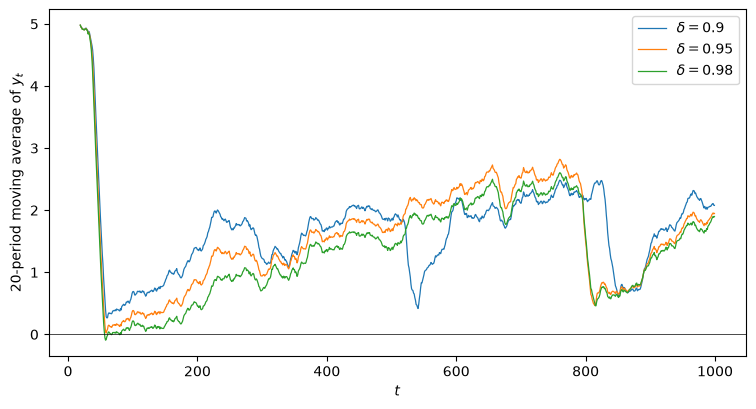
Fig. 103.6 The government’s discount factor shifts the level of inflation after an escape, not the escape’s timing#
Fig. 103.6 shows one seed: the three governments escape at about the same date, and right after the escape the less patient ones settle at higher inflation.
103.10. Anticipated utility#
The adaptive model is an example of what David Kreps calls an anticipated utility model [Kreps, 1998].
The government adapts a temporarily misspecified model — a Phillips curve with fixed coefficients — to incorporate the most recent observations, and reoptimizes along the way.
In forming decisions at \(t\), it acts as if its current estimate \(\gamma_{t-1}\) will govern the Phillips curve forever, using the same policy functional \(h(\cdot)\) that would be optimal if \(\gamma\) were truly time-invariant.
This is a small departure from rational expectations: calendar time enters only through the drifting beliefs \(\gamma_t\).
The government treats coefficient drift in two different ways.
When it estimates, it allows for drift: the constant gain discounts old data precisely because the government suspects that the Phillips curve wanders, and in the Kalman-filter form of (103.18) it attributes a positive covariance to the drift.
When it decides, it ignores drift: it acts as if \(\gamma_{t-1}\) will never change.
Anticipated utility thus stretches a property of linear-quadratic problems.
Certainty equivalence (Certainty Equivalence) lets a decision maker who faces additive uncertainty replace random variables by their expectations.
The anticipated-utility government does the same with its uncertain coefficients \(\gamma\), which enter multiplicatively, where certainty equivalence no longer holds.
A Bayesian decision maker would instead take into account, when choosing \(y_t\), that its beliefs will change (Rational Learning and Rational Expectations), and a robust one would guard against misspecification of its model.
Yet, as the simulations show, this modest departure from rationality is enough to generate a rich account of the rise and fall of U.S. inflation, and to supply underpinnings for the vindication of econometric policy evaluation.
103.11. Conclusions#
For long stretches, an adaptive government learns to generate better than Nash outcomes.
These results come from the recurrent dynamics of adaptation: the mean dynamics that under least squares pull the system toward a self-confirming equilibrium continue to operate, but under a constant gain the noise lets the system recurrently escape toward the Ramsey outcome.
Starting from a self-confirming equilibrium, the adaptive algorithm gradually makes the government put enough weight on the induction hypothesis that chance observations eventually promote a stabilization.
With a decreasing gain the same forces operate on a clock that keeps slowing down: least squares converges to the self-confirming equilibrium only asymptotically, and in a finite sample an early escape can stick.
Adaptation makes the government’s beliefs a hidden state that imparts serial correlation into inflation — so that an outside forecaster would do well to use a random-coefficients model, or to make the constant adjustments that Lucas noted in his Critique [Lucas, 1976].
(Unemployment stays serially uncorrelated in this model, because the public knows the government’s rule and only inflation surprises move unemployment.)
In this sense the adaptive models contain the underpinnings for vindicating econometric policy evaluation — the second of the two stories of The Rise and Fall of U.S. Inflation.
That last observation is a testable one, and it is worth recording what the model predicts before anyone looks.
If the government’s beliefs really are a hidden drifting state, then a reduced-form description of post-war inflation and unemployment ought to show drifting coefficients, not merely drifting shock variances.
The model also predicts how the persistence of inflation should move with its level.
At the self-confirming equilibrium inflation is serially uncorrelated, while after a constant-gain escape it is persistent (Exercise 103.4), so low inflation should come with high persistence.
Drifts and Volatilities fits a drifting-coefficients model to the data and reports the verdict: persistence rose and fell with the level of inflation, and it fell during the Volcker disinflation, the opposite of this prediction.
Before that, the suite continues with the theory.
Escaping Nash Inflation characterizes the escape route analytically, Priors, Escapes, and Learning Cycles shows how the government’s prior about coefficient drift shapes both the mean dynamics and the escapes, and Econometric Policy Evaluation follows the book’s chapter 9 in estimating the adaptive models on U.S. data.
103.12. Exercises#
Exercise 103.1
Everything above hinges on the constant gain, so it is worth seeing how much.
Simulate the classical adaptive model with \(\lambda \in \{0.99, 0.975, 0.95\}\) and \(T_0 = 300\), for 24 seeds each, and measure how often inflation escapes toward Ramsey.
Use two statistics that measure frequency:
the median date of the first escape, defined as in Least squares learning: a decreasing gain; and
the number of escape episodes per 1000 periods, where an episode starts when the sum of weights on current and lagged inflation rises above \(-0.1\), and the sum must fall back below \(-0.3\) before another episode can start.
Also compute the fraction of periods with \(y_t < 2\).
How does a larger gain (smaller \(\lambda\), faster discounting of the past) affect each statistic?
Why is the fraction of periods with low inflation a poor measure of how often the government escapes?
Note
A more ambitious version of this exercise is to build the Keynesian adaptive model, in which the government fits the Phillips curve in the reverse direction, regressing inflation on unemployment.
The regressors are \(X_{K,t} = \begin{bmatrix} U_t & U_{t-1} & U_{t-2} & y_{t-1} & y_{t-2} & 1 \end{bmatrix}^\top\); the government estimates \(\beta\) in \(y_t = \beta^\top X_{K,t} + \varepsilon_{K,t}\), then inverts to \(\gamma\) using the inversion formulas \(\gamma_1 = \beta_1^{-1}\), \(\gamma_{-1} = -\beta_{-1}/\beta_1\) of Self-Confirming Equilibria before solving the Phelps problem.
The Keynesian self-confirming inflation rate is 10.
In the book’s simulation (\(\lambda = 0.99\), \(T_0 = 300\), Figures 8.3a–8.3d), the Keynesian system “spends much time away from the self-confirming equilibrium, and, like the classical system, recurrently escapes to the Ramsey outcome” [Sargent, 1999].
Its Jacobian has a repeated eigenvalue of \(-.2\), which makes the mean dynamics slow and, in the book’s words, “sustains long episodes near the Ramsey outcome”.
Solution
We count episodes with a small function and reuse the 24 runs with \(\lambda = 0.975\) from above.
def escape_episodes(sw, up=-0.1, down=-0.3):
    "Upcrossings of `up` by the sum of weights, re-armed only below `down`."
    count, armed = 0, True
    for v in sw:
        if armed and v > up:
            count, armed = count + 1, False
        elif not armed and v < down:
            armed = True
    return count


gain_runs = {0.975: cg_runs}
for λ in (0.99, 0.95):
    gain_runs[λ] = [simulate(model, λ=λ, T_prior=300, n=1000, seed=s)
                    for s in range(24)]

print(f"{'λ':>6} {'median first escape':>20} {'episodes per 1000':>18} "
      f"{'fraction y < 2':>15}")
for λ in (0.99, 0.975, 0.95):
    runs = gain_runs[λ]
    firsts = [first_escape(sim['y']) for sim in runs]
    episodes = [escape_episodes(sim['sumweights']) * 1000 / len(sim['y'])
                for sim in runs]
    print(f"{λ:>6} {np.median([t for t in firsts if t is not None]):20.0f} "
          f"{np.mean(episodes):18.2f} "
          f"{np.mean([(sim['y'] < 2).mean() for sim in runs]):15.2f}")
     λ  median first escape  episodes per 1000  fraction y < 2
  0.99                   90               1.00            0.89
 0.975                   56               2.62            0.83
  0.95                   38               6.08            0.85
A larger gain makes escapes come sooner and more often: the median first escape comes earlier, and the number of episodes per 1000 periods rises, as \(\lambda\) falls.
The fraction of periods with \(y_t < 2\) barely moves, and it need not move monotonically.
The reason is that a larger gain also speeds the return trip, since the clock of Least squares learning: a decreasing gain runs faster.
Each near-Ramsey spell is therefore shorter, and inflation within it is noisier.
The fraction of time spent near Ramsey mixes how often the government escapes with how long it stays, and as the gain rises those two move in opposite directions.
Exercise 103.2
Fig. 103.1 and Fig. 103.2 show that whether least squares escapes depends on the tightness of the prior.
Simulate the least squares system (\(\lambda = 1\)) for \(T_0 \in \{300, 800, 5000\}\), with 24 seeds and 1000 periods each.
For each \(T_0\), report how many paths escape, the median date of the first escape, and how many of the escaped paths return above 4.
For the paths that escape, compute the artificial time \(\tau = \log\left((T_0 + t)/T_0\right)\) at the first escape. Use the answer to explain why the tight prior rarely escapes within 1000 periods.
Explain why no escaped path returns, although least squares converges to the self-confirming equilibrium. Is the eigenvalue \(-\tfrac12\) of Mean dynamics near the self-confirming equilibrium, which sits at the boundary of \(\sqrt{t}\) convergence, the reason?
Solution
ls_prior_runs = {T0: [simulate(model, λ=1.0, T_prior=T0, n=1000, seed=s)
                      for s in range(24)]
                 for T0 in (300, 800, 5000)}

for T0, runs in ls_prior_runs.items():
    firsts = np.array([t for t in (first_escape(sim['y']) for sim in runs)
                       if t is not None])
    line = f"T_0 = {T0:>4}: {len(firsts):>2} of {len(runs)} escape"
    if len(firsts):
        τ = np.log((T0 + firsts) / T0)
        line += (f", median first escape t = {np.median(firsts):.0f} "
                 f"(τ = {np.median(τ):.2f}), "
                 f"{sum(returns_to_nash(sim['y']) for sim in runs)} return")
    else:
        line += f"; τ at t = 1000 is only {np.log((T0 + 1000) / T0):.2f}"
    print(line)
T_0 =  300: 21 of 24 escape, median first escape t = 132 (τ = 0.36), 0 return
T_0 =  800: 15 of 24 escape, median first escape t = 270 (τ = 0.29), 0 return
T_0 = 5000:  0 of 24 escape; τ at t = 1000 is only 0.18
A looser prior escapes more often and sooner, and no escaped path returns.
Measured in artificial time, first escapes under the two looser priors come after a few tenths of a unit.
With \(T_0 = 5000\), 1000 periods supply only \(\log(6000/5000) \approx 0.18\) units of artificial time, fewer than most escaping paths under the looser priors needed.
No escaped path returns because, as Least squares learning: a decreasing gain showed, the return needs many units of artificial time, and the least squares clock slows down exponentially.
The eigenvalue \(-\tfrac12\) is not the reason.
It governs how fast decreasing-gain estimates converge, and their asymptotic distribution, once they are near the self-confirming equilibrium.
It says nothing special about the probability of leaving the self-confirming equilibrium, which the large-deviation objects of the primer govern, or about the speed of the return from far away, which depends on the global mean dynamics; those are slow near the induction hypothesis.
Priors, Escapes, and Learning Cycles shows how, in a Kalman filter with a gain that does not vanish, the government’s prior produces escapes that stick, and the bullets on decreasing and constant gains in One recursion, many learners summarize the general theory.
Exercise 103.3
Mean dynamics near the self-confirming equilibrium computed the eigenvalues of \(DT - I\) at \(\theta = 1\).
Check that (103.19) is exact away from the self-confirming equilibrium. Freeze the government’s beliefs at those that one of the constant-gain runs holds at \(t = 1000\), simulate the economy for 50,000 periods under the frozen rule, regress \(U_t\) on \(X_{C,t}\), and compare the coefficients with
T_map.Compute the eigenvalues of \(DT - I\) at the self-confirming equilibrium for \(\theta \in \{0.5, 1, 2\}\), holding the other parameters fixed, and compare them with \(-1/(1+\theta^2)\).
For which of these \(\theta\) do least squares estimates converge at the usual \(\sqrt{t}\) rate? Compare with Least squares learning converges to Nash and Uniqueness and E-stability.
Solution
For the first part we freeze the rule and simulate.
γ_frozen = cg_runs[1]['γ']
h = model.phelps_h(γ_frozen)
rng = np.random.default_rng(0)
N = 50_000
v1 = model.σ1 * rng.standard_normal(N)
v2 = model.σ2 * rng.standard_normal(N)
U = model.U_star - model.θ * v2 + v1
y = np.zeros(N)
y[:2] = h[4]
for t in range(2, N):
    y[t] = h @ [U[t-1], U[t-2], y[t-1], y[t-2], 1.0] + v2[t]

X_C = np.column_stack([y[2:], U[1:-1], U[:-2], y[1:-1], y[:-2], np.ones(N - 2)])
coef = np.linalg.lstsq(X_C, U[2:], rcond=None)[0]
print("regression of U on X_C:", np.round(coef, 3))
print("T(γ) from the formula: ", np.round(T_map(model, γ_frozen), 3))
regression of U on X_C: [-0.998  0.007  0.056  0.044  0.124  6.186]
T(γ) from the formula:  [-1.     0.011  0.054  0.049  0.126  6.169]
The two agree up to sampling error, because \(v_{1t}\) is independent of every regressor.
Now the eigenvalues.
for θ in (0.5, 1.0, 2.0):
    m = AdaptivePhillips(θ=θ)
    eig = np.sort(np.linalg.eigvals(jacobian_T(m) - np.eye(6)).real)
    print(f"θ = {θ}: eig(DT - I) = {np.round(eig, 4)}, "
          f"-1/(1 + θ²) = {-1 / (1 + θ**2):.4f}")
θ = 0.5: eig(DT - I) = [-1.  -0.8 -0.8 -0.8 -0.8 -0.8], -1/(1 + θ²) = -0.8000
θ = 1.0: eig(DT - I) = [-1.  -0.5 -0.5 -0.5 -0.5 -0.5], -1/(1 + θ²) = -0.5000
θ = 2.0: eig(DT - I) = [-1.  -0.2 -0.2 -0.2 -0.2 -0.2], -1/(1 + θ²) = -0.2000
For every \(\theta\) the eigenvalues are \(-1\) once and \(-1/(1+\theta^2)\) five times.
The \(\sqrt{t}\) rate requires \(-1/(1+\theta^2) < -\tfrac12\), that is, \(\theta < 1\).
So least squares converges at the usual rate when \(\theta = 0.5\), sits on the boundary when \(\theta = 1\), and converges more slowly when \(\theta = 2\), with the slow mean dynamics of a repeated eigenvalue \(-0.2\).
These are the same numbers as the slope \(\mathcal{M} = -1/(1+\theta^2)\) of the scalar mean dynamics in Least squares learning converges to Nash and the classical E-stability eigenvalues of Uniqueness and E-stability.
A steeper Phillips curve makes the static Phelps rule respond more strongly to a believed coefficient on a lag, which pushes the diagonal of \(DT\), \(\theta^2/(1+\theta^2)\), toward one and weakens the pull of the mean dynamics.
Exercise 103.4
The conclusions claim that inflation is serially uncorrelated at the self-confirming equilibrium but persistent after a constant-gain escape.
Check the claim, measuring persistence by the slope coefficient in a least squares regression of \(y_t\) on a constant and \(y_{t-1}\).
For the least squares economy with \(T_0 = 5000\), which stays near the self-confirming equilibrium, compute it over the first 200 periods of each path of Exercise 103.2.
For the constant-gain economies of Exercise 103.1, compute it over the 200 periods that begin 20 periods after the first escape.
Do the same for the least squares paths with \(T_0 = 800\) that escape.
What relation between the level of inflation and its persistence does the model predict? Compare with Drifts and Volatilities.
Solution
def ar1(z):
    "Slope of a least squares regression of z_t on a constant and z_{t-1}."
    X = np.column_stack([np.ones(len(z) - 1), z[:-1]])
    return np.linalg.lstsq(X, z[1:], rcond=None)[0][1]


def after_escape(runs, start=20, length=200):
    "AR(1) coefficients over a window that starts `start` periods after the first escape."
    out = []
    for sim in runs:
        t = first_escape(sim['y'])
        if t is not None and t + start + length <= len(sim['y']):
            out.append(ar1(sim['y'][t + start:t + start + length]))
    return np.array(out)


def summarize(label, values):
    print(f"{label:28s} median {np.median(values):+.2f}, "
          f"range {values.min():+.2f} to {values.max():+.2f} ({len(values)} paths)")


summarize("least squares, T_0 = 5000:",
          np.array([ar1(sim['y'][:200]) for sim in ls_prior_runs[5000]]))
for λ in (0.99, 0.975, 0.95):
    summarize(f"constant gain, λ = {λ}:", after_escape(gain_runs[λ]))
summarize("least squares, T_0 = 800:", after_escape(ls_prior_runs[800]))
least squares, T_0 = 5000:   median +0.01, range -0.14 to +0.21 (24 paths)
constant gain, λ = 0.99:     median +0.10, range -0.11 to +0.29 (24 paths)
constant gain, λ = 0.975:    median +0.38, range +0.06 to +0.70 (24 paths)
constant gain, λ = 0.95:     median +0.73, range +0.58 to +0.88 (24 paths)
least squares, T_0 = 800:    median +0.06, range -0.02 to +0.21 (15 paths)
Near the self-confirming equilibrium the AR(1) coefficient is centered on zero.
After a constant-gain escape inflation is persistent, and more so the larger the gain; at \(\lambda = 0.99\) the effect is small.
After a least squares escape that sticks, persistence is small again.
So the persistence comes from the motion of the government’s beliefs, which a constant gain keeps alive, not from low inflation as such.
Under a constant gain the model therefore predicts that persistence should be high when inflation is low and low when inflation is high, with the transition from high to low inflation raising persistence.
Drifts and Volatilities (Inflation persistence) finds the reverse in U.S. data: persistence rose and fell with the level of inflation, and it fell during the Volcker disinflation.