105. Priors, Escapes, and Learning Cycles#
105.1. Overview#
The Bourbons remember everything and learn nothing.
– Charles Maurice de Talleyrand
This lecture is a sequel to Adaptive Learning and Escape Dynamics and Escaping Nash Inflation.
It follows Sargent and Williams [2005], which generalizes the adaptive model of chapter 8 of Sargent [1999] and of Cho et al. [2002] (CWS), whose escape dynamics we derived in Escaping Nash Inflation.
In Adaptive Learning and Escape Dynamics the government estimated its Phillips curve by constant-gain recursive least squares.
That is a very particular way to learn.
In large samples, a constant-gain least squares learner behaves as if it believed that the coefficients of its model follow a random walk with one specific innovation covariance matrix.
Here we free the government to hold any prior about how its coefficients drift, encoded in a covariance matrix \(V\), and we ask how that prior affects the two forces that drive the model:
the mean dynamics, which pull the government’s beliefs toward a self-confirming (Nash) equilibrium; and
the escape dynamics, which recurrently push beliefs away from it, toward the low-inflation Ramsey outcome.
We will find three things.
Some priors make the self-confirming equilibrium unstable, so that the mean dynamics themselves produce recurrent disinflations: a learning cycle, born in a Hopf bifurcation, rather than a stochastic escape.
The prior shapes the direction and the speed of escapes, but in every case we study an escape heads toward the Ramsey outcome.
The prior resolves a puzzle in the literature: why the simulated governments of Sims [1988] and Chung [1990] escape Nash inflation once and stay near Ramsey, apparently indefinitely, while those of Sargent [1999] and CWS escape only to be pulled back, again and again.
Throughout we work with the analytically tractable static model of Escaping Nash Inflation and A government learning the Phillips curve, in which the government regresses unemployment on inflation and a constant.
Let’s start with our imports:
import matplotlib.pyplot as plt
import numpy as np
from scipy.linalg import sqrtm
from scipy.integrate import solve_ivp
from scipy.optimize import brentq
105.2. The static model#
The true economy is a version of the natural-rate model of Kydland and Prescott [1977]:
where \(U_n\) is unemployment, \(\pi_n\) is inflation, \(x_n\) is the systematic part of inflation set by the government, \(\hat x_n\) is the public’s (rational) forecast, and \(W_n = (W_{1n}, W_{2n})^\top\) is IID standard Gaussian noise.
Since \(\pi_n - \hat x_n = \sigma_2 W_{2n}\), the true unemployment rate is \(U_n = u - \sigma_2 W_{2n} + \sigma_1 W_{1n}\) — it fluctuates around the natural rate \(u\) regardless of systematic policy.
The government does not know this.
In the static model it fits a non-expectational Phillips curve by regressing unemployment on current inflation and a constant,
with belief vector \(\gamma = (a, b)\) (intercept and slope), and it treats \(\eta_n\) as an exogenous shock.
Warning
Escaping Nash Inflation studies this same static model but orders the belief vector the other way round, as \(\gamma = (\gamma_1, \gamma_{-1})\) with the slope first and regressors \(\Phi = (\pi, 1)\), following Cho et al. [2002].
Here we put the intercept first, with \(\Phi = (1, \pi)\), following Sargent and Williams [2005], as A government learning the Phillips curve also does.
The two are the same model in different coordinates: \(a = \gamma_{-1}\) and \(b = \gamma_1\), so the self-confirming belief \((2u, -1)\) of this lecture is the \((-1, u(1+\theta^2))\) of the last one, with \(\theta = 1\).
Matrices such as \(M\), \(V\), and \(P\) have their rows and columns correspondingly transposed.
A government learning the Phillips curve uses our calibration but other letters, as the Bounded Rationality lectures do (Notation across the series): there the beliefs are \(\alpha\) and the gain is \(\gamma\).
Here, following Sargent and Williams [2005], the beliefs are \(\gamma\), the gain is \(\varepsilon\), and \(\alpha\) denotes the drifting coefficients that the government thinks generate its data.
Believing (105.2), the government solves the Phelps problem — minimize \(\hat{\mathbb{E}} \sum_n \delta^n (U_n^2 + \pi_n^2)\) — whose static best response sets inflation to the constant
class StaticPhillips:
    "The static Sargent-Williams model: government regresses U on (1, π)."

    def __init__(self, u=5.0, σ1=0.3, σ2=0.3):
        self.u, self.σ1, self.σ2 = u, σ1, σ2
        self.σ = σ1                       # govt regression error std = σ1

    def x(self, γ):
        "Government best response (systematic inflation) given beliefs γ."
        a, b = γ
        return -a * b / (1 + b**2)

    def M(self, γ):
        "Second moment matrix E[ΦΦ'] of regressors Φ = (1, π), given γ."
        x = self.x(γ)
        return np.array([[1.0, x], [x, x**2 + self.σ2**2]])

    def g_bar(self, γ):
        "Least squares moment E[Φ(U - Φ'γ)] under the data γ generates."
        u, σ2 = self.u, self.σ2
        x = self.x(γ)
        E_ΦU = np.array([u, x * u - σ2**2])
        return E_ΦU - self.M(γ) @ γ
Three belief vectors are worth naming.
Belief 1 (Nash): \(b = -1\) with an intercept that makes the government set \(x = u\), the time-consistent outcome of Kydland and Prescott [1977].
Belief 2 (Ramsey): \(b = 0\), so the government perceives no tradeoff and sets \(x = 0\).
Belief 3 (induction): in a dynamic version, coefficients on current and lagged inflation summing to zero, which for a patient government also sends inflation toward \(0\).
105.3. The self-confirming equilibrium#
A self-confirming equilibrium is a belief \(\bar\gamma\) that reproduces itself: the data generated when the government acts on \(\bar\gamma\) make the population regression coefficients equal \(\bar\gamma\), i.e. \(\bar g(\bar\gamma) = 0\).
For the static model this is easy to solve by hand.
The slope is \(b = \operatorname{cov}(U, \pi)/\mathbb{V}[\pi] = -\sigma_2^2/\sigma_2^2 = -1\), and matching means gives the intercept \(a = u + x(\bar\gamma)\).
Substituting the best response (105.3) with \(b = -1\) gives \(x = a/2\), so \(a = u + a/2\), i.e. \(a = 2u\).
model = StaticPhillips(u=5.0, σ1=0.3, σ2=0.3)
γ_sce = np.array([2 * model.u, -1.0])

print(f"self-confirming beliefs  γ = {γ_sce}  (intercept 2u, slope -1)")
print(f"self-confirming inflation x = {model.x(γ_sce):.2f}  (= Nash = u)")
print(f"check g_bar(γ_sce) = {model.g_bar(γ_sce)}")
self-confirming beliefs  γ = [10. -1.]  (intercept 2u, slope -1)
self-confirming inflation x = 5.00  (= Nash = u)
check g_bar(γ_sce) = [0. 0.]
The self-confirming equilibrium inflation rate equals the Nash (time-consistent) outcome \(u = 5\), even though the government’s model is misspecified (Why the classical equilibrium is Nash explains why).
The government’s non-expectational Phillips curve is observationally equivalent to the truth along the equilibrium path, but wrong off it — which is exactly what its adaptive behavior repeatedly probes.
105.4. Drifting beliefs and the Kalman filter#
We now make the government adaptive.
Following Sargent and Williams [2005], the government believes that its data come from a Phillips curve whose coefficients drift as a random walk,
with regressors \(\Phi_n = (1, \pi_n)^\top\) and IID shocks \(\eta_n\) and \(\Lambda_n\).
The covariance matrix \(V\) is the government’s prior about parameter drift, the object we set free, and \(\sigma^2\) is the variance that the government attributes to its regression error \(\eta_n\).
The government’s estimate \(\gamma_n\) is its best forecast of \(\alpha_n\) from data through \(n-1\), which it computes with the Kalman filter.
This is the linear state-space model of A First Look at the Kalman Filter, with hidden state \(\alpha_n\), transition matrix \(I\), state-noise covariance \(V\), a time-varying observation matrix \(\Phi_n^\top\), and measurement-noise variance \(\sigma^2\).
Following Sargent and Williams [2005], we measure the covariance of the estimation error in units of \(\sigma^2\), writing \(\operatorname{cov}(\alpha_n - \gamma_n) = \sigma^2 P_n\).
Then the Kalman filter is
The normalization is what puts a \(1\) in the denominators and the scaled drift \(\sigma^{-2} V\) in the update of \(P_n\).
For large \(n\), Benveniste et al. [1990] show that the filter is well approximated by
in which the second moment matrix \(M(\gamma_n)\) replaces \(\Phi_n \Phi_n^\top\) in the update of \(P_n\).
Sargent and Williams [2005] base their analysis on (105.6), and report that for the small drift they study it gives simulations nearly indistinguishable from those of (105.5).
We simulate with the exact filter (105.5) throughout, because the approximation can be unstable when the drift is large, as it is in Sims’s example below.
For a fixed \(\gamma\), the matrix \(P_n\) settles at the solution of the algebraic Riccati equation
the counterpart for this model of the algebraic Riccati equation in Convergence.
Following Sargent and Williams [2005], we index the size of the drift by a scalar \(\varepsilon\), writing \(V = \varepsilon^2 \hat V\) for a fixed matrix \(\hat V\).
Equation (105.7) then makes \(P\) proportional to \(\varepsilon / \sigma\), so \(\varepsilon\) plays the role of the constant gain of Adaptive Learning and Escape Dynamics.
Most of our calculations use \(\varepsilon = 0.05\), the largest gain in Tables 1 and 2 of Sargent and Williams [2005]; when we compare with constant-gain least squares we use the gain \(0.02\) of A government learning the Phillips curve, and Sims’s example carries its own, much larger, drift.
Constant-gain recursive least squares is a special case.
If the government’s prior is \(V = \varepsilon^2 V^*\), with \(V^* \equiv \sigma^2 M(\bar\gamma)^{-1}\), and \(\sigma = \sigma_1\), then (105.7) gives \(P = \varepsilon M(\bar\gamma)^{-1}\), and (105.6) becomes the constant-gain recursive least squares algorithm of Adaptive Learning and Escape Dynamics, with gain \(\varepsilon\) and with the estimated moment matrix replaced by its limit.
The connection is asymptotic, not exact.
In large samples the two algorithms merge, but their transient responses differ: Sargent and Williams [2005] (section 3.4) show that after an escape the Kalman filter returns to the self-confirming equilibrium much faster than recursive least squares does (Exercise 105.3).
def solve_riccati(V, M, σ):
    "Symmetric positive-definite P solving P M P = σ^{-2} V."
    W = V / σ**2
    Mh = sqrtm(M).real
    Mh_inv = np.linalg.inv(Mh)
    return Mh_inv @ sqrtm(Mh @ W @ Mh).real @ Mh_inv

M_sce = model.M(γ_sce)
V_star = model.σ**2 * np.linalg.inv(M_sce)      # the RLS prior (ε = 1)
P_star = solve_riccati(V_star, M_sce, model.σ)

print("RLS prior gives P = M^{-1}?", np.allclose(P_star, np.linalg.inv(M_sce)))
RLS prior gives P = M^{-1}? True
The next function simulates the economy when the government uses the exact filter (105.5).
def kalman_path(model, V, σ, T, seed, γ0=None):
    """
    Simulate T periods in which the government uses the exact Kalman filter
    with prior (V, σ), while the truth uses model.σ1.

    Beliefs start at γ0 (default: the self-confirming equilibrium), with P at
    its Riccati value.  Returns inflation π, unemployment U, systematic
    inflation x, and beliefs γ.
    """
    rng = np.random.default_rng(seed)
    u, σ1, σ2 = model.u, model.σ1, model.σ2
    γ = np.array([2 * u, -1.0]) if γ0 is None else np.array(γ0, dtype=float)
    P = solve_riccati(V, model.M(γ), σ)
    W = V / σ**2
    π, U, x = np.empty(T), np.empty(T), np.empty(T)
    beliefs = np.empty((T, 2))
    for n in range(T):
        beliefs[n] = γ
        x[n] = model.x(γ)
        w1, w2 = rng.standard_normal(2)
        π[n] = x[n] + σ2 * w2
        U[n] = u - σ2 * w2 + σ1 * w1                # truth uses σ1
        Φ = np.array([1.0, π[n]])
        PΦ = P @ Φ
        denom = 1 + Φ @ PΦ
        γ = γ + PΦ / denom * (U[n] - Φ @ γ)
        P = P - np.outer(PΦ, PΦ) / denom + W
    return π, U, x, beliefs
105.5. Mean dynamics and E-stability#
As in Adaptive Learning and Escape Dynamics, the beliefs are organized by mean dynamics, now a joint ordinary differential equation in \((\gamma, P)\), with time measured in periods:
A rest point of (105.8) has \(\bar g(\gamma) = 0\) and \(P = \) the Riccati solution — a self-confirming equilibrium.
Local stability turns on the Jacobian of \(\bar g\) at the self-confirming equilibrium.
For the static model this can be computed in closed form,
def jacobian(model, γ, h=1e-6):
    "Numerical Jacobian of g_bar at γ."
    J = np.zeros((2, 2))
    for j in range(2):
        gp, gm = γ.copy(), γ.copy()
        gp[j] += h; gm[j] -= h
        J[:, j] = (model.g_bar(gp) - model.g_bar(gm)) / (2 * h)
    return J

J = jacobian(model, γ_sce)
print("∂g/∂γ at SCE =\n", J.round(3))
∂g/∂γ at SCE =
 [[ -0.5   -5.  ]
 [ -2.5  -25.09]]
Under constant-gain recursive least squares the moment-matrix block of the corresponding differential equation decouples, and stability is governed by the eigenvalues of \(M^{-1}\,\partial\bar g/\partial\gamma\).
Writing \(\bar g(\gamma) = M(\gamma)\,[T(\gamma) - \gamma]\), where \(T(\gamma) = M(\gamma)^{-1}\, \mathbb{E}[\Phi U]\) maps the government’s perceived Phillips curve into the population regression that its policy generates, shows that at the self-confirming equilibrium \(M^{-1}\,\partial\bar g/\partial\gamma = DT - I\).
Negative real parts of these eigenvalues are the E-stability condition.
The idea goes back to DeCanio [1979] and Evans [1985], Evans [1989]; Marcet and Sargent [1989] and Woodford [1990] showed that it governs the convergence of least squares learning, and Evans and Honkapohja [2001] systematized the theory (One recursion, many learners).
eig_rls = np.linalg.eigvals(np.linalg.inv(M_sce) @ J)
print(f"E-stability eigenvalues (RLS): {eig_rls.round(3)}")
print("both negative ⇒ the SCE is E-stable")
E-stability eigenvalues (RLS): [-0.5 -1. ]
both negative ⇒ the SCE is E-stable
Both eigenvalues are negative: they are \(-1\) and \(-\tfrac12\).
They are the static model’s version of numbers met earlier in the suite.
With \(\theta = 1\), as here, \(-\tfrac12 = -1/(1+\theta^2)\) is the slope \(\mathcal M\) of the mean dynamics of expected inflation in Least squares learning converges to Nash, and Mean dynamics near the self-confirming equilibrium finds the eigenvalues \(-1\) and \(-1/(1+\theta^2)\) again in the dynamic model of Adaptive Learning and Escape Dynamics.
At \(\theta = 1\) the second eigenvalue sits exactly on the boundary \(\mathcal M = -\tfrac12\) that The Credibility Problem identifies for \(\sqrt{t}\) asymptotic normality of decreasing-gain least squares.
That boundary concerns the rate of convergence; how often beliefs escape is governed instead by the large-deviation rate discussed below.
With a decreasing gain, then, least squares beliefs converge to the Nash self-confirming equilibrium asymptotically [Marcet and Sargent, 1989], although in a finite sample a falling gain also slows the return, so that an early escape can stick (Least squares learning: a decreasing gain).
With a constant gain, beliefs hover near the self-confirming equilibrium and escape from it recurrently.
But the reduction to \(M^{-1}\,\partial\bar g/\partial\gamma\) relied on the special RLS prior.
Under a general prior \(V\), the \(P\) block of (105.8) does not decouple, and local stability is governed instead by the eigenvalues of \(\bar P\, \partial\bar g/\partial\gamma\) — where \(\bar P\) is the Riccati solution for that prior.
Prior beliefs about parameter drift now matter for whether the self-confirming equilibrium is even stable.
105.6. Learning cycles#
Here is the paper’s most striking result: some priors make the self-confirming equilibrium unstable, and the mean dynamics then cycle.
We illustrate it, as Sargent and Williams [2005] do, by tightening the government’s prior on the slope coefficient, starting from the RLS prior \(V^*\) and shrinking the slope-related entries by a factor \(\lambda \in [0, 1]\):
For each \(\lambda\) we solve the Riccati equation with \(\varepsilon = 0.05\) and look at the largest real part among the eigenvalues of \(\bar P(\lambda)\, \partial\bar g/\partial\gamma\): where it is positive, the self-confirming equilibrium is unstable.
def V_tighten_slope(λ, V_star):
    V = V_star.copy()
    V[0, 1] = V[1, 0] = np.sqrt(λ) * V_star[0, 1]
    V[1, 1] = λ * V_star[1, 1]
    return V

ε = 0.05                                   # gain (sets the timescale)

def eig_PJ(V, σ=model.σ):
    "Eigenvalues of P̄ ∂g/∂γ at the SCE for the prior (V, σ)."
    return np.linalg.eigvals(solve_riccati(V, M_sce, σ) @ J)

λ_grid = np.linspace(0.01, 0.999, 200)
max_re = np.array([eig_PJ(ε**2 * V_tighten_slope(λ, V_star)).real.max()
                   for λ in λ_grid])

fig, ax = plt.subplots(figsize=(8, 4.5))
ax.plot(λ_grid, max_re)
ax.axhline(0, color='k', lw=0.8)
ax.set_xlabel(r'prior-tightening parameter $\lambda$')
ax.set_ylabel('max real part of eigenvalue')
plt.show()
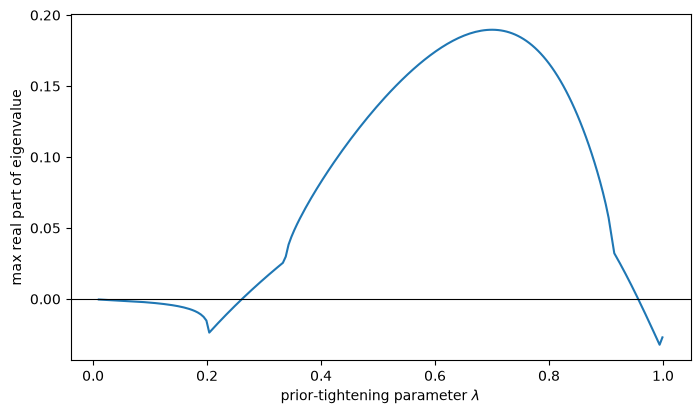
Fig. 105.1 Stability of the self-confirming equilibrium as the slope prior tightens#
Over an intermediate range of \(\lambda\) the maximum real part becomes positive: the self-confirming equilibrium loses stability.
The figure reproduces Fig. 4 of Sargent and Williams [2005].
Let’s locate the two points where stability changes, and look at the eigenvalues there and deep inside the unstable range.
def max_real(λ):
    return eig_PJ(ε**2 * V_tighten_slope(λ, V_star)).real.max()

sign_changes = np.where(np.diff(np.sign(max_re)) != 0)[0]
for i in sign_changes:
    λ_c = brentq(max_real, λ_grid[i], λ_grid[i + 1])
    eigs = eig_PJ(ε**2 * V_tighten_slope(λ_c, V_star))
    print(f"stability changes at λ = {λ_c:.3f}; eigenvalues there: {eigs.round(4)}")
print(f"eigenvalues at λ = 0.7: {eig_PJ(ε**2 * V_tighten_slope(0.7, V_star)).round(4)}")
stability changes at λ = 0.261; eigenvalues there: [-0.+0.0253j -0.-0.0253j]
stability changes at λ = 0.956; eigenvalues there: [0.+0.035j 0.-0.035j]
eigenvalues at λ = 0.7: [0.0055 0.1897]
At each end of the unstable range a complex pair of eigenvalues crosses the imaginary axis.
That is the situation the Hopf bifurcation theorem addresses (see Perko [1996]): a stable limit cycle bifurcates from the self-confirming equilibrium as the real parts cross zero (Theorem 4.1 of Sargent and Williams [2005]).
Bullard [1994] calls such a cycle a learning equilibrium: the underlying model has no cycles, and learning creates them.
Deep inside the unstable range, at \(\lambda = 0.7\), both eigenvalues are real and positive, so the self-confirming equilibrium is an unstable node.
The Hopf theorem describes cycles near the bifurcation points, so at \(\lambda = 0.7\) we find the cycle numerically, as Sargent and Williams [2005] do in their Fig. 5, by integrating the joint mean dynamics (105.8) for \((\gamma, P)\) from a point near the self-confirming equilibrium.
def mean_dynamics(t, z, V, σ):
    "The joint ODE pp_ode for (γ, P), stacked into one vector."
    γ, P = z[:2], z[2:].reshape(2, 2)
    γ_dot = P @ model.g_bar(γ)
    P_dot = V / σ**2 - P @ model.M(γ) @ P
    return np.concatenate([γ_dot, P_dot.ravel()])

λ = 0.7
V = ε**2 * V_tighten_slope(λ, V_star)
P_bar = solve_riccati(V, M_sce, model.σ)

z0 = np.concatenate([γ_sce + np.array([0.3, 0.05]), P_bar.ravel()])
sol = solve_ivp(mean_dynamics, [0, 3000], z0, args=(V, model.σ),
                max_step=1.0, rtol=1e-9, atol=1e-11)
t_path, a_path, b_path = sol.t, sol.y[0], sol.y[1]
x_path = model.x((a_path, b_path))

# period: time between upward crossings of x through u/2, once the cycle has settled
up = t_path[1:][(x_path[:-1] < model.u / 2) & (x_path[1:] >= model.u / 2)]
period = np.diff(up[up > 1000]).mean()
mask = t_path > t_path[-1] - 2 * period        # the last two cycles

print(f"period of the cycle ≈ {period:.0f} periods")
print(f"along the cycle: intercept in [{a_path[mask].min():.2f}, {a_path[mask].max():.2f}], "
      f"slope in [{b_path[mask].min():.2f}, {b_path[mask].max():.2f}], "
      f"inflation in [{x_path[mask].min():.2f}, {x_path[mask].max():.2f}]")
period of the cycle ≈ 391 periods
along the cycle: intercept in [5.03, 11.41], slope in [-1.16, -0.06], inflation in [0.28, 5.65]
Here are the last two cycles, in time and in belief space.
fig, axes = plt.subplots(1, 2, figsize=(12, 5))

axes[0].plot(t_path[mask], a_path[mask], label='intercept', lw=2)
axes[0].plot(t_path[mask], b_path[mask], label='slope', lw=2)
axes[0].set_xlabel('time (periods)')
axes[0].set_ylabel('coefficient')
axes[0].legend()

axes[1].plot(a_path[mask], b_path[mask], lw=2)
axes[1].plot(*γ_sce, 'kx', ms=10, label='SCE')
axes[1].set_xlabel('intercept')
axes[1].set_ylabel('slope')
axes[1].legend()

plt.tight_layout()
plt.show()
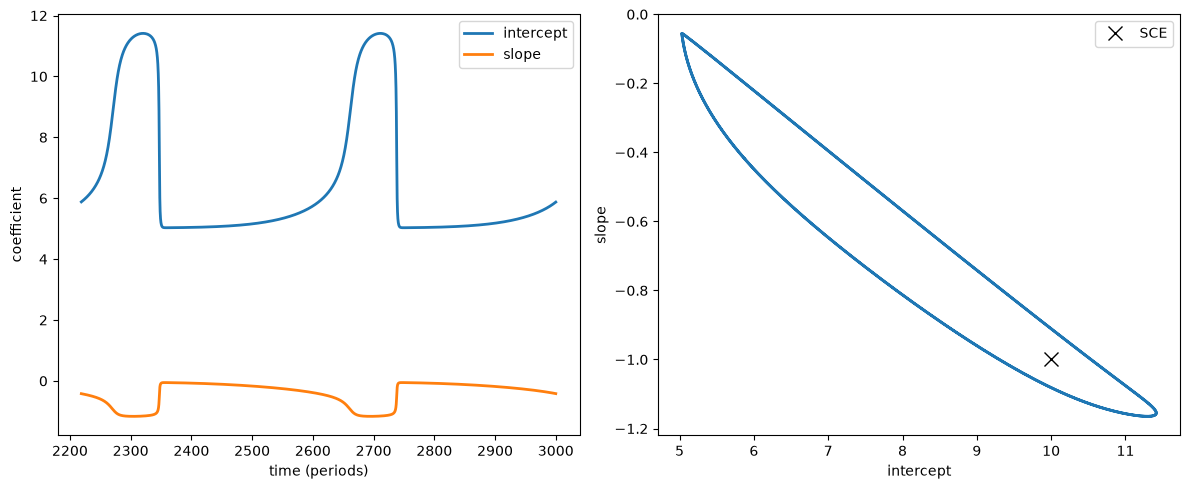
Fig. 105.2 Mean dynamics at λ = 0.7, the coefficients over two cycles (left) and the limit cycle in belief space (right)#
The beliefs settle into a closed orbit around the self-confirming equilibrium, which matches Fig. 5 of Sargent and Williams [2005].
The intercept falls from near \(2u\) to near \(u\) while the slope climbs from about \(-1\) toward \(0\), and then both snap back.
Because inflation is a function of the coefficients through the best response (105.3), the cycle in beliefs shows up as a cycle in inflation between the Nash and Ramsey outcomes.
fig, ax = plt.subplots(figsize=(9, 4.5))
ax.plot(t_path[mask], x_path[mask])
ax.axhline(model.u, color='k', ls='--', lw=1, label='Nash')
ax.axhline(0, color='C2', ls=':', lw=1, label='Ramsey')
ax.set_xlabel('time (periods)')
ax.set_ylabel('inflation $x$')
ax.legend()
plt.show()
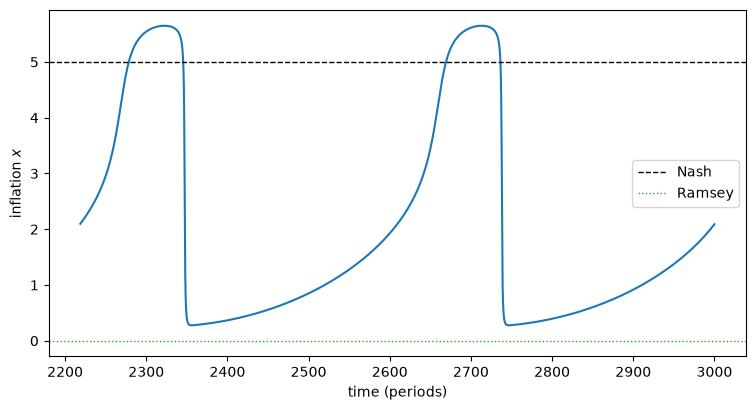
Fig. 105.3 Inflation oscillates between Nash and Ramsey along the learning cycle#
This is a different mechanism from the escapes of Adaptive Learning and Escape Dynamics and Escaping Nash Inflation.
There the self-confirming equilibrium is stable, and a disinflation needs an unusual run of shocks to push beliefs away from it; here the mean dynamics themselves carry beliefs from Nash toward Ramsey and back.
The difference is sharpest as the gain shrinks.
As \(\varepsilon \to 0\) the cycle persists, with a period proportional to \(1/\varepsilon\), while escapes from a stable self-confirming equilibrium become exponentially rare.
But “rare” is a statement about small gains.
For the baseline prior, Sargent and Williams [2005] compute a large-deviation rate \(\bar S \approx 3 \times 10^{-4}\) (their Table 1), so the factor \(\exp(\bar S/\varepsilon)\) that makes escapes rare is close to one at the gains of 0.02 to 0.05 used in this lecture and elsewhere in the suite, and escapes are frequent; Simulating escapes shows how escape times grow as the gain shrinks.
At those gains, escapes from a stable self-confirming equilibrium recur on the same time scale as this cycle turns over, and Exercise 105.4 shows that a simulated time series can hardly tell the two apart.
105.7. Escape dynamics and the direction of escape#
For priors that keep the self-confirming equilibrium stable, disinflations are escapes.
The theory of large deviations (A primer on recursive algorithms), in the form developed in Noah Williams’s dissertation [Williams, 2001], later published as Williams [2019], characterizes the most likely escape as the solution of a control problem: apply the least-cost perturbation to beliefs that pushes them a fixed distance from \(\bar\gamma\).
The minimized cost \(\bar S\) is the rate at which escapes become rare as the gain shrinks: if \(\tau\) is the time of the first escape, then \(\varepsilon \log \mathbb{E}\tau \to \bar S\) as \(\varepsilon \to 0\).
The instantaneous escape direction has a beautifully simple characterization: it is the eigenvector associated with the largest eigenvalue of the belief-innovation covariance \(Q(\bar\gamma, \bar P) = \hat V\) — the prior itself.
w, vecs = np.linalg.eigh(V_star)            # baseline prior V*
v_escape = vecs[:, np.argmax(w)]
v_escape = v_escape / np.linalg.norm(v_escape)

# scale the escape so the slope moves from -1 up to 0
t_star = 1.0 / v_escape[1]
terminal = γ_sce + t_star * v_escape

print(f"escape direction  ≈ {v_escape.round(3)}   (∝ [-u, 1])")
print(f"terminal beliefs  ≈ {terminal.round(2)}   (Belief 2 = [u, 0] = Ramsey)")
escape direction  ≈ [-0.981  0.195]   (∝ [-u, 1])
terminal beliefs  ≈ [4.98 0.  ]   (Belief 2 = [u, 0] = Ramsey)
For the baseline prior the escape direction is nearly proportional to \((-u, 1)\), exactly so in the limit \(\sigma \to 0\), and it carries beliefs from Nash \((2u, -1)\) toward \((u, 0)\) — Belief 2, which supports the Ramsey outcome.
So an escape, when it happens, is a movement toward zero inflation.
Different priors bend the path and change the rate of escape.
Tightening the slope prior can destabilize the equilibrium entirely (the cycles above).
Tightening the intercept prior keeps it stable but makes escapes much slower: in Table 2 of Sargent and Williams [2005] it raises \(\bar S\) from \(3.1 \times 10^{-4}\) to \(0.28\), and the mean escape time at \(\varepsilon = 0.05\) from 23 to 167 periods (Exercise 105.1).
Yet in every case that Sargent and Williams [2005] study, the escapes lead to zero inflation, by different routes and supported by different beliefs (Exercise 105.2).
105.8. Sims’s nonconvergence#
We can now resolve the puzzle described in The Rise and Fall of U.S. Inflation.
Sims [1988] and Chung [1990] gave their governments Kalman filters on drifting coefficients; Sims’s government fit a static Phillips curve like ours, and Chung’s a distributed lag.
In their simulations the government escapes from Nash inflation once and then stays near the Ramsey outcome, apparently indefinitely.
Sargent [1999] and CWS instead used constant-gain recursive least squares, and their governments escape and are pulled back, again and again, producing the sawtooth of A government learning the Phillips curve.
Sargent and Williams [2005] trace the difference to the government’s prior: the drift covariance \(V\) and the noise variance \(\sigma^2\) that its filter assumes.
105.8.1. The variance of the regression error#
So far, following CWS, the government’s \(\sigma\) has equaled the true \(\sigma_1\).
That is natural: in a self-confirming equilibrium the regression (105.2) and the truth (105.1) coincide, and with \(\sigma = \sigma_1\) the government correctly splits the variation it sees in unemployment between its regressors and the shocks.
Sims instead set \(\sigma\) well below \(\sigma_1\), and he did not let the drift in the coefficients shrink toward zero.
A government that attributes too little variance to its regression error must attribute the variation it sees to something else, and the only thing else available is drift in its own coefficients.
The Riccati equation (105.7) makes this precise: \(\bar P\) solves \(\bar P M \bar P = \sigma^{-2} V\), so \(\bar P\) is proportional to \(1/\sigma\).
Understating \(\sigma\) by some factor therefore raises the government’s gain by the same factor, exactly as raising \(\varepsilon\) would.
Φ_sce = np.array([1.0, model.x(γ_sce)])
P_by_σ = {}
for σ_govt in (model.σ1, model.σ1 / 3):
    P_by_σ[σ_govt] = solve_riccati(ε**2 * V_star, M_sce, σ_govt)
    P = P_by_σ[σ_govt]
    gain = (P @ Φ_sce)[0] / (1 + Φ_sce @ P @ Φ_sce)
    print(f"σ = {σ_govt:.2f}: steady-state weight on a forecast error "
          f"(intercept) = {gain:.4f}")

ratio = P_by_σ[model.σ1 / 3] / P_by_σ[model.σ1]
print(f"P(σ1/3) / P(σ1), element by element: {ratio.round(6).ravel()}")
σ = 0.30: steady-state weight on a forecast error (intercept) = 0.0476
σ = 0.10: steady-state weight on a forecast error (intercept) = 0.1304
P(σ1/3) / P(σ1), element by element: [3. 3. 3. 3.]
Cutting \(\sigma\) to a third of \(\sigma_1\) triples \(\bar P\) exactly.
The weight that the filter puts on each forecast error rises almost as much: the \(1\) in the denominator of (105.5) keeps the ratio a little below three at this gain, and the ratio tends to three as \(\varepsilon\) shrinks.
At small gains, a larger gain changes the speed of learning but not the local balance between the mean dynamics and the noise: Sargent and Williams [2005] (section 5) show that the local strength of the pull toward the self-confirming equilibrium, measured as drift per unit of standard deviation, does not depend on the prior.
What a large gain can change is whether the mean dynamics describe the beliefs at all, because they are a small-gain approximation.
105.8.2. Replicating Sims’s example#
Sargent and Williams [2005] simulate a specification analogous to one of Sims’s benchmark cases, his Chart 5, which in our notation has \(u = 6\), \(\sigma_1 = 0.5\), \(\sigma_2 = 0.4\), \(V = 0.01\, I\) and \(\sigma = 0.1\), so that \(\sigma_1\) is five times \(\sigma\); they treat it as a benchmark with \(\varepsilon = 1\).
We start the government at the self-confirming equilibrium \((2u, -1) = (12, -1)\), with \(P\) at its Riccati value, and run 10,000 periods, as Sims and Sargent–Williams did.
We compare it with the variation \(\sigma = \sigma_1\), holding \(V\) fixed.
This variation leaves \(\sigma^{-2} V = 0.04\, I\), the same as shrinking the drift by setting \(\varepsilon = 0.2\) with \(\sigma = 0.1\), so the two give identical paths, as Sargent and Williams [2005] note.
We also need a way to count escapes and returns along a path of inflation.
def escapes_and_returns(π, lo, hi, k=50):
    """
    Count escapes and returns along a path of inflation that starts near Nash.

    An escape is a fall of the k-period moving average of inflation below lo;
    a return is a later rise back above hi.  Also returns the period by which
    the first escape is complete (None if there is none).
    """
    ma = np.convolve(π, np.ones(k) / k, mode='valid')
    near_nash, n_esc, n_ret, first = True, 0, 0, None
    for n, m in enumerate(ma):
        if near_nash and m < lo:
            near_nash, n_esc = False, n_esc + 1
            if first is None:
                first = n + k - 1
        elif not near_nash and m > hi:
            near_nash, n_ret = True, n_ret + 1
    return n_esc, n_ret, first
Now we simulate ten paths of Sims’s specification and of the variation, counting an escape when the 50-period average of inflation falls below \(u/3 = 2\) and a return when it climbs back above \(5u/6 = 5\).
sims = StaticPhillips(u=6.0, σ1=0.5, σ2=0.4)
V_sims, σ_sims = 0.01 * np.eye(2), 0.1
T_sims, seeds = 10_000, range(10)
lo, hi = sims.u / 3, 5 * sims.u / 6

runs = {s: kalman_path(sims, V_sims, σ_sims, T_sims, s) for s in seeds}
runs_σ1 = {s: kalman_path(sims, V_sims, sims.σ1, T_sims, s) for s in seeds}

same = all(np.allclose(kalman_path(sims, 0.04 * V_sims, σ_sims, T_sims, s)[0],
                       runs_σ1[s][0]) for s in (0, 1))
print(f"σ = σ1 and ε = 0.2 give identical paths: {same}\n")

print(f"{'':6}{'Sims: σ = 0.1':^42}| {'σ = σ1':^24}")
print(f"{'seed':>4} {'escapes':>8} {'by period':>10} {'returns':>8} "
      f"{'mean π after':>13} | {'escapes':>8} {'mean π':>8}")
first_escape = {}
for s in seeds:
    π = runs[s][0]
    n_esc, n_ret, first = escapes_and_returns(π, lo, hi)
    first_escape[s] = first
    after = π[first:].mean() if first is not None else np.nan
    n_esc1 = escapes_and_returns(runs_σ1[s][0], lo, hi)[0]
    print(f"{s:>4} {n_esc:>8} {str(first):>10} {n_ret:>8} {after:>13.2f} | "
          f"{n_esc1:>8} {runs_σ1[s][0].mean():>8.2f}")
σ = σ1 and ε = 0.2 give identical paths: True

                    Sims: σ = 0.1               |          σ = σ1
seed  escapes  by period  returns  mean π after |  escapes   mean π
   0        1       4807        0          0.61 |        0     6.14
   1        1       3488        0          0.57 |        0     6.15
   2        1        307        0          0.59 |        0     5.83
   3        1        417        0          0.65 |        0     5.89
   4        1        598        0          0.63 |        0     5.52
   5        1       4509        0          0.60 |        0     6.07
   6        1       1289        0          0.67 |        0     5.94
   7        1       1284        0          0.59 |        0     5.82
   8        1       1133        0          0.59 |        0     6.03
   9        1       1433        0          0.57 |        0     5.61
Every one of Sims’s paths escapes, at very different dates, and none returns: after its escape each path settles into a noisy regime with mean inflation close to the \(0.61\) that Sargent and Williams [2005] report.
With \(\sigma = \sigma_1\), or equivalently \(\varepsilon = 0.2\), no path escapes, and inflation stays near the self-confirming value \(u = 6\).
The next figure shows the first 1,000 periods of the path whose escape comes earliest, the analog of Fig. 14 of Sargent and Williams [2005].
s_show = min(seeds, key=lambda s: first_escape[s])

fig, ax = plt.subplots(figsize=(9.5, 4.5))
ax.plot(runs[s_show][0][:1000], lw=0.8, label=r"Sims: $\sigma = 0.1$")
ax.plot(runs_σ1[s_show][0][:1000], lw=0.8, ls='--',
        label=r"$\sigma = \sigma_1$ or $\varepsilon = 0.2$")
ax.axhline(sims.u, color='k', ls='--', lw=1)
ax.axhline(0, color='C2', ls=':', lw=1)
ax.set_xlabel('$n$')
ax.set_ylabel('inflation')
ax.legend(frameon=False, loc='lower right')
plt.show()
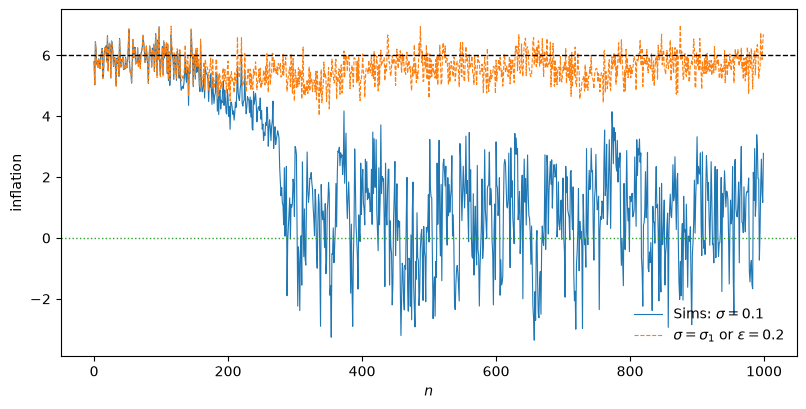
Fig. 105.4 Inflation under Sims’s specification and under σ = σ1 (equivalently ε = 0.2), first 1,000 periods#
105.8.3. Why the mean dynamics do not reassert themselves#
The mean dynamics (105.8) average the data over many periods while holding beliefs, and hence the government’s policy \(x(\gamma)\), fixed.
That is a good approximation when beliefs move slowly, but not under Sims’s prior, which lets beliefs move a lot from one period to the next.
Then the government’s own policy injects variation into inflation, and that variation does not move unemployment, because only surprises do.
The regression of \(U\) on \(\pi\) then reads the induced variation as evidence of a nearly vertical Phillips curve: with policy variance \(\mathbb{V}[x]\), the population slope is \(-\sigma_2^2 / (\sigma_2^2 + \mathbb{V}[x])\) rather than \(-1\).
A flat perceived curve supports low inflation, so the low-inflation regime sustains itself.
Let’s check this on the simulated paths after their escapes.
var_x, slope, theory = [], [], []
for s in seeds:
    π, U, x, _ = runs[s]
    n0 = first_escape[s] + 200                  # well after the escape
    var_x.append(x[n0:].var())
    slope.append(np.cov(U[n0:], π[n0:])[0, 1] / π[n0:].var())
    theory.append(-sims.σ2**2 / (sims.σ2**2 + var_x[-1]))

print(f"variance of systematic inflation x after the escape: "
      f"{min(var_x):.2f} to {max(var_x):.2f}")
print(f"sample slope of U on π after the escape:  {min(slope):.3f} to {max(slope):.3f}")
print(f"-σ2²/(σ2² + var x):                       {min(theory):.3f} to {max(theory):.3f}")
variance of systematic inflation x after the escape: 2.10 to 2.21
sample slope of U on π after the escape:  -0.073 to -0.062
-σ2²/(σ2² + var x):                       -0.071 to -0.068
The government’s beliefs, and therefore its policy, keep moving after the escape, and the data it generates confirm a Phillips curve whose slope is close to zero, the Ramsey belief.
That is the sense in which Sargent and Williams [2005] say that the results about mean and escape dynamics are “approximations for small parameter drift”: with drift as large as Sims’s, the mean dynamics fail to reassert themselves.
105.8.4. Constant gains and the sawtooth#
Now give the government of the same economy constant-gain recursive least squares instead, with the gain \(0.02\) of A government learning the Phillips curve (the economy of that section has the calibration of the rest of this lecture).
def rls_path(model, gain, T, seed):
    "Constant-gain recursive least squares, as in olg_phillips, from the SCE."
    rng = np.random.default_rng(seed)
    u, σ1, σ2 = model.u, model.σ1, model.σ2
    γ = np.array([2 * u, -1.0])
    R = model.M(γ)
    π = np.empty(T)
    for n in range(T):
        w1, w2 = rng.standard_normal(2)
        π[n] = model.x(γ) + σ2 * w2
        U = u - σ2 * w2 + σ1 * w1
        Φ = np.array([1.0, π[n]])
        R = R + gain * (np.outer(Φ, Φ) - R)
        γ = γ + gain * np.linalg.solve(R, Φ * (U - Φ @ γ))
    return π

runs_cg = {s: rls_path(sims, 0.02, T_sims, s) for s in seeds}
counts_cg = [escapes_and_returns(runs_cg[s], lo, hi)[:2] for s in seeds]
print("constant gain 0.02, (escapes, returns) by seed:", counts_cg)
constant gain 0.02, (escapes, returns) by seed: [(4, 3), (4, 3), (6, 5), (3, 2), (2, 1), (6, 5), (3, 2), (3, 2), (5, 4), (3, 2)]
Under constant-gain least squares every path escapes and returns, most of them several times.
The count of returns is conservative: many climbs back toward Nash turn into new escapes before the 50-period average reaches 5.
The figure compares 50-period moving averages of inflation under the two learning rules.
def moving_average(π, k=50):
    return np.convolve(π, np.ones(k) / k, mode='valid')

fig, axes = plt.subplots(2, 1, figsize=(9.5, 7), sharex=True, sharey=True)
for s in seeds:
    axes[0].plot(moving_average(runs[s][0]), lw=0.6)
for s in (0, 1, 2):
    axes[1].plot(moving_average(runs_cg[s]), lw=0.8, label=f'seed {s}')
titles = [r"Sims's Kalman filter ($\sigma = 0.1$), ten seeds",
          'constant-gain least squares (gain 0.02), three seeds']
for ax, title in zip(axes, titles):
    ax.axhline(sims.u, color='k', ls='--', lw=1)
    ax.axhline(0, color='C2', ls=':', lw=1)
    ax.set_ylabel('inflation, 50-period average')
    ax.set_title(title)
axes[1].legend(frameon=False, fontsize=8, ncol=3, loc='lower right')
axes[1].set_xlabel('$n$')
plt.tight_layout()
plt.show()
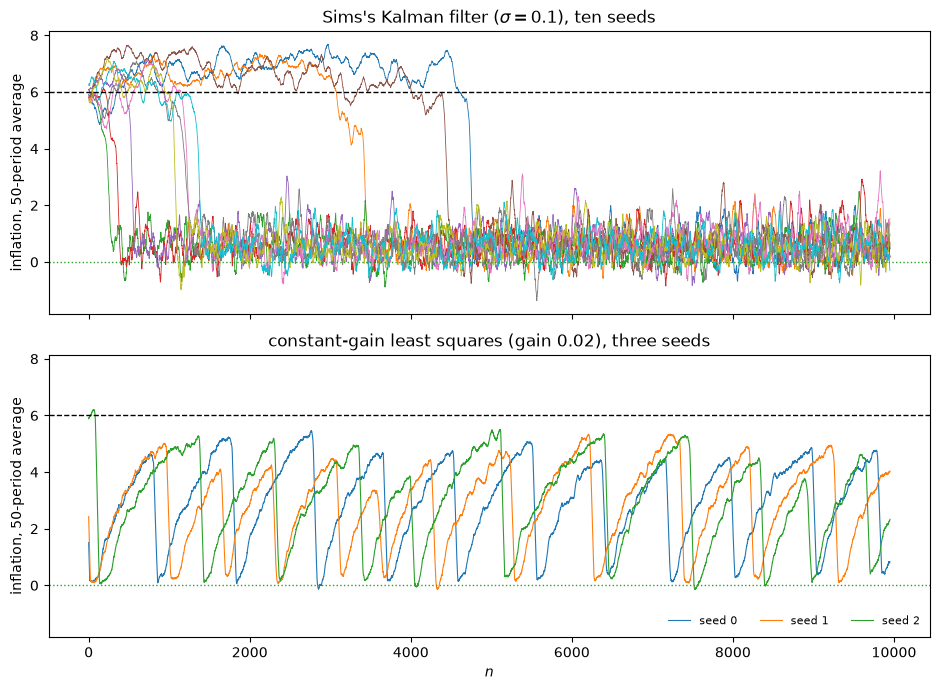
Fig. 105.5 One escape under Sims’s Kalman filter, recurrent escapes under constant-gain least squares (50-period moving averages)#
The same economy produces both of the histories in the literature.
With Sims’s prior the government escapes once and stays near Ramsey; with constant-gain least squares the mean dynamics pull it back toward Nash after every escape, the sawtooth of Sargent [1999] and CWS.
With Sims’s prior and \(\sigma = \sigma_1\), the government never escapes in 10,000 periods.
A decreasing gain gives a third route to an escape that sticks, for a different reason: least squares then converges to the self-confirming equilibrium asymptotically, but in a finite sample the falling gain slows the return (Least squares learning: a decreasing gain).
As Sargent and Williams [2005] put it, one can read the difference between Sims’s results and theirs in two equivalent ways: either Sims allowed too much parameter drift to permit convergence, or he did not let the government attribute enough variation to its regression error.
Here the two readings are exactly equivalent, because the filter (105.5) depends on \(\varepsilon\) and \(\sigma\) only through \(\varepsilon / \sigma\); Exercise 105.6 draws the econometric implication.
105.9. Conclusion#
Free parameters are dangerous, as Arthur Goldberger and Robert Lucas warned.
This lecture’s government carries free parameters in the covariance matrix \(V\) of the drift in its beliefs.
But those parameters buy something.
The empirical sequel Sargent et al. [2006] gives the government the Kalman filter of this lecture, estimates \(V\) from post-war U.S. data, and so reverse-engineers a sequence of policy makers’ evolving subjective models of the Phillips curve that rationalize the actual rise and fall of American inflation — the vindication story of The Rise and Fall of U.S. Inflation, made quantitative.
Its authors draw a guarded lesson, though: their estimates “teach us to deemphasize the empirical relevance of both the mean dynamics and the escape dynamics” and to focus instead on the short-term impact of shocks on government beliefs, and their estimated gap between Nash and Ramsey inflation is small, which supports Alan Blinder’s skepticism about whether that gap matters much for policy.
Related evidence that the reduced-form coefficients and the shock volatilities both drifted appears in Cogley and Sargent [2005] (Drifts and Volatilities), whose model holds the covariance of the coefficient drift constant.
Estimating \(V\) is possible because a Kalman filter with a fixed prior has a gain that never vanishes, so the drift parameters stay identified by the whole sample; The econometricians did return the compliment tells how econometricians came to exploit this, and Exercise 91.7 and Exercise 105.6 pose stripped-down versions of the estimation problem that Chung [1990] first solved.
105.9.1. Are the estimated beliefs realistic?#
That empirical success came with a challenge that is really a challenge about the prior.
To fit the data, Sargent et al. [2006] estimated a large drift covariance \(V\) — a government so open to new data that its beliefs about the monetary transmission mechanism lurch from month to month.
Primiceri [2006], Sims [2007], and, candidly, Sargent [2008] in his presidential address objected that such volatile beliefs are unrealistic: the imputed government forecasts unemployment poorly and holds views no real central bank would.
Carboni and Ellison [2009] answer the objection by disciplining the prior with data the Federal Reserve actually produced.
They re-estimate the model subject to the requirement that its beliefs reproduce the unemployment forecasts published in the Fed’s Greenbook — imposing on the learning model a cross-equation restriction of the kind familiar from rational-expectations econometrics.
Imposing it shrinks the estimated drift variance of the constant term about fiftyfold, from 30.57 to 0.63, and removes the wild belief swings, yet leaves the low-frequency conquest story intact: a stable evolution of Federal Reserve beliefs still explains the rise and fall of inflation.
The volatile beliefs, they conclude, “appear to matter only for ‘overfitting’ high frequency inflation movements”, which Sargent [1999] never set out to explain.
The restricted model’s perceived tradeoff peaks at about a tenth of its unrestricted size, so the Greenbook evidence supports the account of Sargent [1999] more than the estimates of Sargent et al. [2006].
The moral for this lecture is direct: the prior \(V\) is not a nuisance parameter to be maximized over freely — it is an economic object, and pinning it down with independent evidence on what policy makers actually believed is what makes the vindication story credible.
The broader message is that how an adaptive government learns — the prior it brings to the drift in its own beliefs — is not a technical detail.
It determines whether the economy hovers near Nash with recurrent escapes, cycles between Nash and Ramsey, or escapes to Ramsey and stays there.
The next lecture, Econometric Policy Evaluation, takes the adaptive models to data, as chapter 9 of Sargent [1999] did following Chung [1990], by estimating them by maximum likelihood on U.S. data.
Drifts and Volatilities and Drifts and Volatilities after 2000 then fit a drifting-coefficient, stochastic-volatility VAR to post-war data and ask how much of the Great Inflation was drifting beliefs and how much was simply bad luck, and The Lost Conquest: Fed Policy in the 2020s closes the suite by carrying these tools into the present, to rationalize the Federal Reserve’s response to the inflation of the 2020s.
105.10. Exercises#
Exercise 105.1
The learning cycle above tightened the prior on the slope coefficient.
Tightening the prior on the intercept coefficient instead — using
— does not destabilize the self-confirming equilibrium.
Verify this by plotting the maximum real part of the eigenvalues of \(\bar P(\lambda)\,\partial\bar g/\partial\gamma\) against \(\lambda\) for this intercept-tightening family, and confirm it stays negative.
Sargent and Williams [2005] find that this prior nonetheless changes the speed of escapes. With \(\varepsilon = 0.05\), simulate 100 paths from the self-confirming equilibrium under the baseline prior and under their intercept-tightened prior with \(\lambda = 0.63\). For each path, record the first period in which beliefs are farther from \(\bar\gamma\) than \(\sqrt{26}\), the distance from the self-confirming equilibrium to Belief 2. Are escapes faster or slower under the tighter prior?
Solution
Here is the stability calculation.
def V_tighten_intercept(λ, V_star):
    V = V_star.copy()
    V[0, 0] = λ * V_star[0, 0]
    V[0, 1] = V[1, 0] = np.sqrt(λ) * V_star[0, 1]
    return V

max_re_int = [eig_PJ(ε**2 * V_tighten_intercept(λ, V_star)).real.max()
              for λ in λ_grid]

fig, ax = plt.subplots(figsize=(8, 4.5))
ax.plot(λ_grid, max_re_int, label='tighten intercept')
ax.plot(λ_grid, max_re, ls='--', label='tighten slope (for comparison)')
ax.axhline(0, color='k', lw=0.8)
ax.set_xlabel(r'$\lambda$')
ax.set_ylabel('max real part of eigenvalue')
ax.set_title('Stability under a tighter intercept prior')
ax.legend()
plt.show()

print(f"largest value over the grid: {max(max_re_int):.2e}")
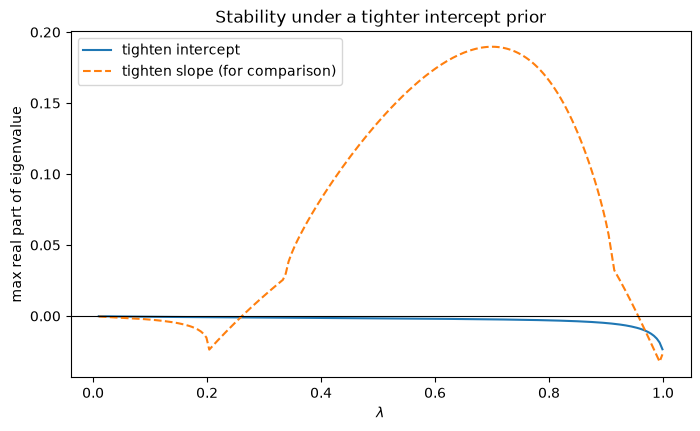
largest value over the grid: -1.58e-04
Tightening the intercept prior keeps the maximum real part negative for all \(\lambda\): the self-confirming equilibrium stays stable, so there is no learning cycle.
Now the escape times.
The function below stops each path as soon as beliefs leave the ball.
def first_exit(model, V, σ, radius, seed, T_max=50_000):
    "First period in which |γ - γ_sce| > radius under the exact Kalman filter."
    rng = np.random.default_rng(seed)
    u, σ1, σ2 = model.u, model.σ1, model.σ2
    γ_bar = np.array([2 * u, -1.0])
    γ, P, W = γ_bar.copy(), solve_riccati(V, model.M(γ_bar), σ), V / σ**2
    for n in range(T_max):
        w1, w2 = rng.standard_normal(2)
        π = model.x(γ) + σ2 * w2
        U = u - σ2 * w2 + σ1 * w1
        Φ = np.array([1.0, π])
        PΦ = P @ Φ
        denom = 1 + Φ @ PΦ
        γ = γ + PΦ / denom * (U - Φ @ γ)
        P = P - np.outer(PΦ, PΦ) / denom + W
        if np.linalg.norm(γ - γ_bar) > radius:
            return n + 1
    return np.nan

radius = np.sqrt(26)
for name, V_hat in [("baseline V*", V_star),
                    ("tighter intercept, λ = 0.63", V_tighten_intercept(0.63, V_star))]:
    times = np.array([first_exit(model, ε**2 * V_hat, model.σ, radius, s)
                      for s in range(100)])
    print(f"{name:28s}: mean escape time {np.nanmean(times):6.1f} periods "
          f"(median {np.nanmedian(times):.0f}, censored {np.isnan(times).sum()})")
baseline V*                 : mean escape time   23.0 periods (median 20, censored 0)
tighter intercept, λ = 0.63 : mean escape time  259.5 periods (median 220, censored 0)
Escapes are much slower under the tighter intercept prior.
The baseline time is close to the 22.9 periods that Sargent and Williams [2005] report in their Table 2 at this gain; the intercept-tightened time is of the same order as their 167.3 periods, many times the baseline.
A government that is surer that its intercept is not drifting puts less weight on the forecast errors that would carry its beliefs along the escape route, and Sargent and Williams [2005] (section 6.3) show that priors that make \(\bar P^{-1}\) larger raise the rate \(\bar S\) that governs how rare escapes are.
So this prior changes the escape dynamics substantially, without overturning the mean dynamics.
Exercise 105.2
The instantaneous escape direction is the dominant eigenvector of the prior covariance \(\hat V\).
Compute the escape direction, and the terminal beliefs implied by following it in a straight line until the slope reaches \(0\), for the baseline prior \(V^*\) and for the intercept-tightened prior of Exercise 105.1 with \(\lambda = 0.63\), the case of Fig. 9 of Sargent and Williams [2005]. Why would the slope-tightened prior \(V(0.5)\) be a poor choice for this comparison?
With \(\varepsilon = 0.05\), simulate five escapes under each prior, stopping each path when the slope first reaches \(0\), and plot the belief paths in the (intercept, slope) plane together with the two instantaneous directions.
Where do the escapes end, and how well does the instantaneous direction predict their route?
Solution
The slope-tightened prior \(V(0.5)\) lies inside the unstable range of Fig. 105.1, so it has no stable self-confirming equilibrium to escape from.
The intercept-tightened prior keeps the equilibrium stable (Exercise 105.1).
def escape_direction(V):
    "Dominant eigenvector of V, oriented toward a higher slope, and its terminal point."
    w, vecs = np.linalg.eigh(V)
    v = vecs[:, np.argmax(w)]
    v = v / np.linalg.norm(v)
    if v[1] < 0:
        v = -v
    return v, γ_sce + v / v[1]

priors = {"baseline": V_star,
          "tighter intercept (λ = 0.63)": V_tighten_intercept(0.63, V_star)}
for name, V_hat in priors.items():
    v, term = escape_direction(V_hat)
    stable = eig_PJ(ε**2 * V_hat).real.max() < 0
    print(f"{name:30s}: direction {v.round(3)}, straight-line terminal "
          f"{term.round(2)}, SCE stable: {stable}")
baseline                      : direction [-0.981  0.195], straight-line terminal [4.98 0.  ], SCE stable: True
tighter intercept (λ = 0.63)  : direction [-0.97   0.244], straight-line terminal [6.02 0.  ], SCE stable: True
The directions differ only by a few degrees, but because the escape covers a long distance, the straight-line terminal intercepts differ by about one unit.
Now the simulated escapes.
fig, ax = plt.subplots(figsize=(8, 6))
for (name, V_hat), color in zip(priors.items(), ('C0', 'C1')):
    v, term = escape_direction(V_hat)
    ax.plot([γ_sce[0], term[0]], [γ_sce[1], term[1]], color=color, lw=2,
            label=f'{name}: instantaneous direction')
    ends = []
    for s in range(5):
        _, _, _, beliefs = kalman_path(model, ε**2 * V_hat, model.σ, 5_000, s)
        n_end = np.argmax(beliefs[:, 1] >= 0)
        ax.plot(beliefs[:n_end + 1, 0], beliefs[:n_end + 1, 1], color=color,
                lw=0.6, alpha=0.7)
        ends.append((n_end, beliefs[n_end, 0]))
    print(f"{name:30s}: (period, intercept) when the slope reaches 0: "
          f"{[(int(n), round(a, 2)) for n, a in ends]}")
ax.plot(*γ_sce, 'kx', ms=10)
ax.set_xlabel('intercept')
ax.set_ylabel('slope')
ax.legend(frameon=False, fontsize=9)
plt.show()
baseline                      : (period, intercept) when the slope reaches 0: [(10, np.float64(4.87)), (35, np.float64(4.66)), (13, np.float64(4.82)), (33, np.float64(4.97)), (8, np.float64(4.19))]
tighter intercept (λ = 0.63)  : (period, intercept) when the slope reaches 0: [(142, np.float64(5.19)), (767, np.float64(4.92)), (193, np.float64(5.04)), (287, np.float64(5.12)), (267, np.float64(4.9))]
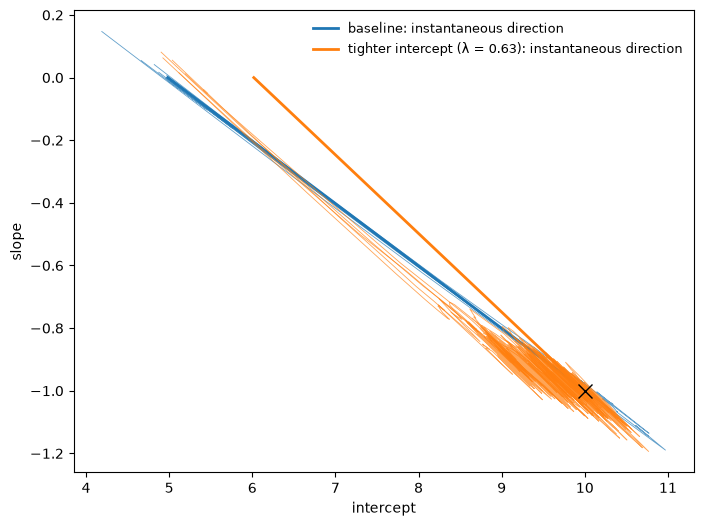
Under the baseline prior the simulated escapes run close to the straight line, as in Fig. 7 of Sargent and Williams [2005], and end near Belief 2, \((u, 0)\).
Under the tighter intercept prior the escapes take much longer to start: beliefs first wander around the self-confirming equilibrium, and when they do escape they run along a line close to the baseline’s, not along their own instantaneous direction, ending at slope \(0\) with an intercept close to the baseline’s rather than at the straight-line terminal point.
So the instantaneous direction predicts the route well only in the baseline case, where, as \(\sigma \to 0\), the mean dynamics themselves keep pushing beliefs along it once an escape has started (section 6.2 of Sargent and Williams [2005]); for other priors the whole dynamic control problem matters.
In both cases the escape ends at a slope of \(0\), where the government perceives no exploitable tradeoff and (105.3) sets inflation to zero whatever the intercept.
The destination is robust; the route and its timing depend on the shape of the prior.
Exercise 105.3
Sargent and Williams [2005] (section 3.4) stress that constant-gain recursive least squares is only asymptotically a special case of the Kalman filter with \(V = \varepsilon^2 V^*\).
With \(\varepsilon = 0.05\) and \(V = \varepsilon^2 V^*\), start both algorithms’ mean dynamics at the Ramsey belief \(\gamma_0 = (u, 0)\), with the Kalman \(P\) at its Riccati value for \(M(\gamma_0)\) and the RLS moment matrix at \(R = M(\gamma_0)\).
The RLS mean dynamics are
Integrate both systems for 800 periods and plot the intercept, the slope, and inflation \(x(\gamma)\).
Which algorithm returns to the self-confirming equilibrium faster, and do they end at the same place?
Solution
The Kalman mean dynamics are the function mean_dynamics from the lecture.
def rls_mean_dynamics(t, z):
    "Mean dynamics of constant-gain RLS for (γ, R), stacked into one vector."
    γ, R = z[:2], z[2:].reshape(2, 2)
    γ_dot = ε * np.linalg.solve(R, model.g_bar(γ))
    R_dot = ε * (model.M(γ) - R)
    return np.concatenate([γ_dot, R_dot.ravel()])

γ0 = np.array([model.u, 0.0])                   # Belief 2 (Ramsey)
M0 = model.M(γ0)
V = ε**2 * V_star
t_eval = np.linspace(0, 800, 801)

kal = solve_ivp(mean_dynamics, [0, 800],
                np.concatenate([γ0, solve_riccati(V, M0, model.σ).ravel()]),
                args=(V, model.σ), t_eval=t_eval, rtol=1e-8, atol=1e-10)
rls = solve_ivp(rls_mean_dynamics, [0, 800], np.concatenate([γ0, M0.ravel()]),
                t_eval=t_eval, rtol=1e-8, atol=1e-10)

fig, axes = plt.subplots(1, 3, figsize=(13, 4))
for out, label, ls in [(kal, 'Kalman filter', '-'), (rls, 'constant-gain RLS', '--')]:
    a, b = out.y[0], out.y[1]
    for ax, series in zip(axes, (a, b, model.x((a, b)))):
        ax.plot(out.t, series, ls=ls, label=label)
for ax, title in zip(axes, ('intercept', 'slope', 'inflation $x$')):
    ax.set_title(title)
    ax.set_xlabel('time (periods)')
axes[0].legend(frameon=False)
plt.tight_layout()
plt.show()

for out, label in [(kal, 'Kalman filter'), (rls, 'constant-gain RLS')]:
    x = model.x((out.y[0], out.y[1]))
    print(f"{label:18s}: x first exceeds 0.8u at period {out.t[np.argmax(x > 0.8 * model.u)]:.0f}; "
          f"beliefs at period 800 = {out.y[:2, -1].round(3)}")
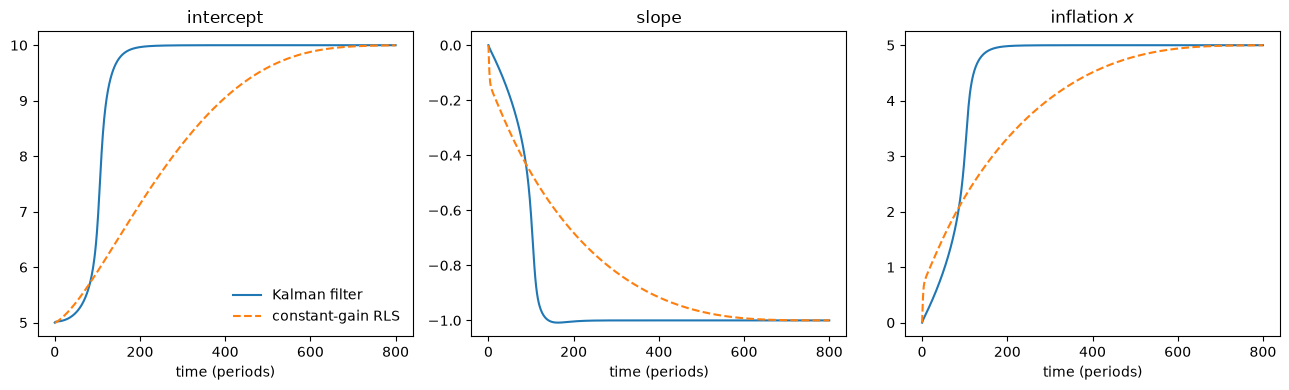
Kalman filter     : x first exceeds 0.8u at period 111; beliefs at period 800 = [10. -1.]
constant-gain RLS : x first exceeds 0.8u at period 294; beliefs at period 800 = [ 9.998 -1.   ]
Both algorithms end at the self-confirming equilibrium \((2u, -1)\), but the Kalman filter gets there much faster, with an abrupt reversal of the slope rather than a gradual one, as in Figs. 1 and 2 of Sargent and Williams [2005].
The difference comes from how the gain matrices respond to the changing moments of the data: in the Kalman filter \(P\) responds through the term \(P M(\gamma) P\), while the RLS moment matrix \(R\) only follows \(M(\gamma)\) with a lag.
Because the two algorithms share their rest point and its local stability, they agree asymptotically; their transient responses, which matter after every escape, differ.
Exercise 105.4
This exercise compares the learning cycle with recurrent escapes, as Sargent and Williams [2005] do in their Fig. 6.
With \(\varepsilon = 0.05\), simulate 2,000 periods of the exact Kalman filter from the self-confirming equilibrium with the slope-tightened prior \(V(0.7)\), and plot inflation together with the mean-dynamics path \(x(t)\) computed in the lecture. Repeat the simulation with the baseline prior \(V^*\), under which the self-confirming equilibrium is stable.
For \(\varepsilon \in \{0.05, 0.02, 0.005\}\) and both priors, count disinflations (the 20-period average of inflation falling below 1, after having been above 4) per 100 units of \(\varepsilon n\), averaging over three seeds.
What distinguishes the learning cycle from recurrent escapes at these gains? What would distinguish them as \(\varepsilon \to 0\)?
Solution
Here are the two simulations.
priors = {"slope-tightened V(0.7): unstable SCE": V_tighten_slope(0.7, V_star),
          "baseline V*: stable SCE": V_star}

fig, axes = plt.subplots(2, 1, figsize=(9.5, 7), sharex=True, sharey=True)
for ax, (name, V_hat) in zip(axes, priors.items()):
    π = kalman_path(model, ε**2 * V_hat, model.σ, 2_000, 0)[0]
    ax.plot(π, lw=0.5, label='simulated inflation')
    ax.set_title(name)
    ax.set_ylabel('inflation')
keep = t_path <= 2_000
axes[0].plot(t_path[keep], x_path[keep], lw=2, label='mean dynamics')
axes[0].legend(frameon=False, loc='lower right', fontsize=8)
axes[1].set_xlabel('$n$')
plt.tight_layout()
plt.show()
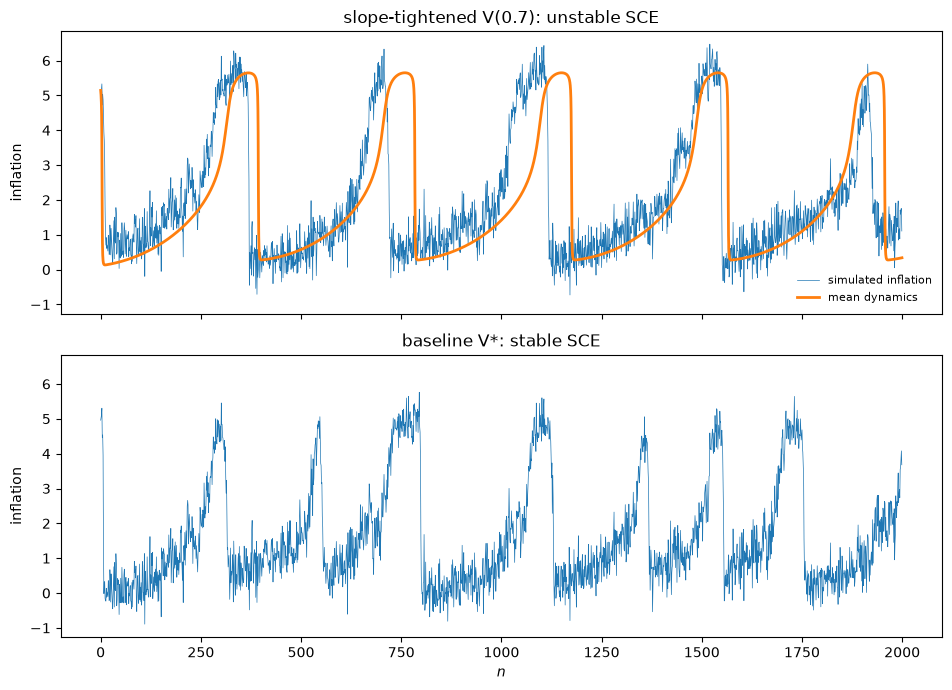
Both simulated series show recurrent disinflations.
Under the slope-tightened prior the simulation tracks the deterministic cycle of the mean dynamics closely; under the baseline prior the disinflations are escapes, but they come about as often.
Now the counts.
def disinflations_per_100(V_hat, ε_, seeds=range(3)):
    "Disinflations per 100 units of εn under the exact Kalman filter."
    T = int(100 / ε_)
    counts = [escapes_and_returns(kalman_path(model, ε_**2 * V_hat, model.σ, T, s)[0],
                                  lo=1.0, hi=4.0, k=20)[0] for s in seeds]
    return np.mean(counts)

print(f"{'ε':>6} | {'V(0.7): cycle':>14} | {'V*: escapes':>12}")
for ε_ in (0.05, 0.02, 0.005):
    print(f"{ε_:>6} | {disinflations_per_100(priors['slope-tightened V(0.7): unstable SCE'], ε_):>14.1f}"
          f" | {disinflations_per_100(V_star, ε_):>12.1f}")
     ε |  V(0.7): cycle |  V*: escapes
  0.05 |            5.3 |          7.7
  0.02 |            6.0 |          7.0
 0.005 |            6.0 |          6.7
At every gain in the table, both priors produce disinflations at a similar rate per unit of \(\varepsilon n\), so the stable prior’s escapes are not rare at these gains.
For the cycle that is expected: its period is proportional to \(1/\varepsilon\), about 20 units of \(\varepsilon n\).
For the stable prior it reflects the small large-deviation rate \(\bar S \approx 3 \times 10^{-4}\) that Sargent and Williams [2005] compute: the mean time to escape grows like \(\exp(\bar S/\varepsilon)\) only once \(\varepsilon\) is small relative to \(\bar S\), and until then it scales roughly like \(1/\varepsilon\), just as the period of the cycle does.
The stable prior’s rate per unit of \(\varepsilon n\) does fall as \(\varepsilon\) shrinks, but slowly.
A simulated time series at these gains therefore cannot easily tell a learning cycle from recurrent escapes.
The distinction is asymptotic: as \(\varepsilon \to 0\) the cycle’s rate per unit of \(\varepsilon n\) stays put, while the stable prior’s escapes eventually become exponentially rare.
Exercise 105.5
This exercise varies the replication of Sims’s example in Sims’s nonconvergence.
The time series in Fig. 14 of Sargent and Williams [2005] appear to start away from the self-confirming equilibrium, at low inflation. Start Sims’s specification and the \(\sigma = \sigma_1\) variation at the Ramsey belief \((u, 0)\) instead, with \(P\) at its Riccati value, and report mean inflation over the first 1,000 and the last 2,000 of 10,000 periods for five seeds.
Starting from the self-confirming equilibrium, scale Sims’s drift covariance to \(V = \varepsilon^2 \times 0.01\, I\) for \(\varepsilon \in \{0.2, 0.3, 0.4, 0.6\}\), keeping \(\sigma = 0.1\). For each \(\varepsilon\), count escapes and returns over ten seeds of 10,000 periods, as in the lecture. How does the history change as the drift grows?
Solution
First, the paths that start at the Ramsey belief.
γ_ramsey = np.array([sims.u, 0.0])
for name, σ_govt in [("Sims, σ = 0.1", σ_sims), ("σ = σ1", sims.σ1)]:
    early, late = [], []
    for s in range(5):
        π = kalman_path(sims, V_sims, σ_govt, T_sims, s, γ0=γ_ramsey)[0]
        early.append(π[:1000].mean())
        late.append(π[-2000:].mean())
    print(f"{name:14s}: mean π, first 1,000 periods {np.round(early, 2)}")
    print(f"{'':14s}  mean π, last 2,000 periods  {np.round(late, 2)}")
Sims, σ = 0.1 : mean π, first 1,000 periods [0.87 0.62 0.58 0.55 0.51]
                mean π, last 2,000 periods  [0.5  0.65 0.69 0.8  0.62]
σ = σ1        : mean π, first 1,000 periods [4.45 4.77 3.16 2.73 3.08]
                mean π, last 2,000 periods  [5.96 6.09 5.45 5.66 5.74]
Started at low inflation, Sims’s government never converges to the self-confirming equilibrium: inflation stays low throughout.
With \(\sigma = \sigma_1\), inflation climbs toward the self-confirming value \(u = 6\) during the first thousand periods and then stays near it, which is what Fig. 14 of Sargent and Williams [2005] shows.
Now the scan over the size of the drift.
for ε_ in (0.2, 0.3, 0.4, 0.6):
    counts = [escapes_and_returns(
                  kalman_path(sims, ε_**2 * V_sims, σ_sims, T_sims, s)[0], lo, hi)[:2]
              for s in seeds]
    n_escape = sum(c[0] > 0 for c in counts)
    n_return = sum(c[1] > 0 for c in counts)
    print(f"ε = {ε_}: paths that escape {n_escape}/10, paths that return {n_return}/10, "
          f"(escapes, returns) by seed {counts}")
ε = 0.2: paths that escape 0/10, paths that return 0/10, (escapes, returns) by seed [(0, 0), (0, 0), (0, 0), (0, 0), (0, 0), (0, 0), (0, 0), (0, 0), (0, 0), (0, 0)]
ε = 0.3: paths that escape 8/10, paths that return 5/10, (escapes, returns) by seed [(1, 1), (0, 0), (2, 2), (2, 1), (1, 0), (1, 0), (1, 0), (2, 1), (0, 0), (3, 3)]
ε = 0.4: paths that escape 10/10, paths that return 1/10, (escapes, returns) by seed [(1, 0), (1, 0), (1, 0), (1, 0), (1, 0), (1, 0), (2, 1), (1, 0), (1, 0), (1, 0)]
ε = 0.6: paths that escape 10/10, paths that return 0/10, (escapes, returns) by seed [(1, 0), (1, 0), (1, 0), (1, 0), (1, 0), (1, 0), (1, 0), (1, 0), (1, 0), (1, 0)]
The history changes with the size of the drift.
With the smallest drift no path escapes in 10,000 periods: the mean dynamics hold beliefs near the self-confirming equilibrium.
With somewhat larger drift, paths escape and some return, the beginnings of a sawtooth.
With larger drift still, almost every path escapes once and never returns, as in Sims’s own case \(\varepsilon = 1\) in the lecture.
The two kinds of history in the literature are two ends of a continuum indexed by the drift that the government entertains, relative to the noise it attributes to its regression.
Exercise 105.6
Exercise 91.7 asked an econometrician to estimate the gain of a constant-gain government from the data that its policy generates.
Here the government runs the exact Kalman filter of this lecture with prior \(V = \varepsilon^2 V^*\), \(\varepsilon = 0.02\), and \(\sigma = \sigma_1\).
Simulate 5,000 periods from the self-confirming equilibrium.
Suppose an econometrician knows everything about the economy and the government except \(\varepsilon\) and the government’s \(\sigma\).
Show that the candidate pairs \((\varepsilon, \sigma)\) and \((c\varepsilon, c\sigma)\) imply exactly the same history of targets \(x_n\) for any \(c > 0\).
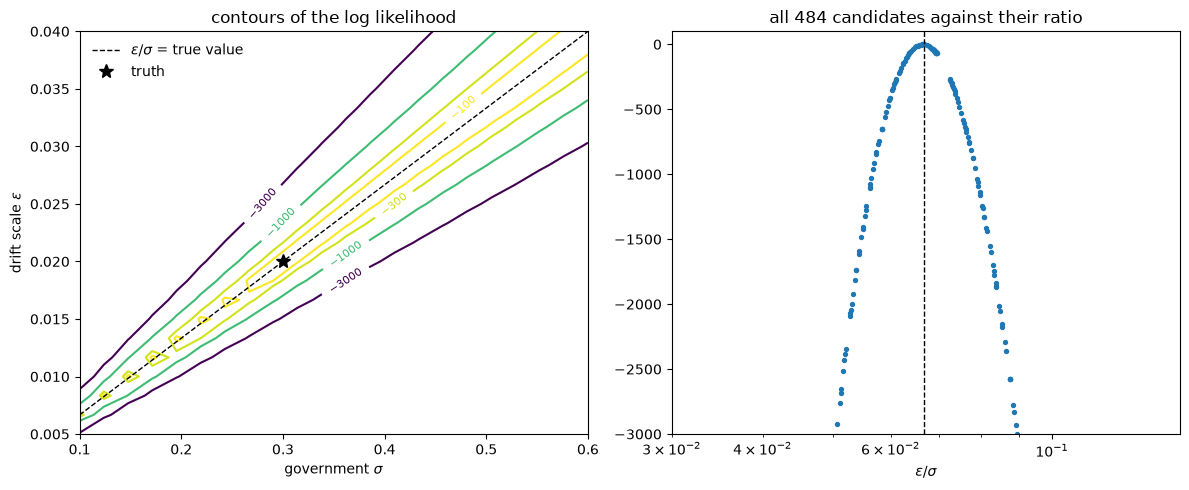
Compute the Gaussian log likelihood of inflation, \(\ell(\varepsilon, \sigma) = -\sum_n (\pi_n - x_n(\varepsilon, \sigma))^2 / (2 \sigma_2^2)\) up to a constant, on a grid of \((\varepsilon, \sigma)\), and plot its contours.
What do the data identify? Relate your answer to the two equivalent interpretations of Sims’s example in Sims’s nonconvergence.
Solution
The government’s beliefs are a deterministic function of the data and of the filter’s parameters, so the econometrician can rerun the filter for each candidate pair, as in Exercise 91.7.
The function below does this for many candidates at once.
def reconstruct_targets(π, U, ε_vals, σ_vals):
    """
    Targets x_n implied by the exact Kalman filter with prior (ε² V*, σ),
    reconstructed from data (π, U), for each candidate pair (ε, σ).
    """
    K = len(ε_vals)
    γ = np.tile(γ_sce, (K, 1))
    P = np.array([solve_riccati(e**2 * V_star, M_sce, s)
                  for e, s in zip(ε_vals, σ_vals)])
    W = np.array([e**2 * V_star / s**2 for e, s in zip(ε_vals, σ_vals)])
    targets = np.empty((len(π), K))
    for n in range(len(π)):
        targets[n] = -γ[:, 0] * γ[:, 1] / (1 + γ[:, 1]**2)
        Φ = np.array([1.0, π[n]])
        PΦ = P @ Φ
        denom = 1 + PΦ @ Φ
        γ = γ + PΦ / denom[:, None] * (U[n] - γ @ Φ)[:, None]
        P = P - PΦ[:, :, None] * PΦ[:, None, :] / denom[:, None, None] + W
    return targets

ε_true, σ_true = 0.02, model.σ1
π_data, U_data, x_data, _ = kalman_path(model, ε_true**2 * V_star, σ_true, 5_000, 1)

check = reconstruct_targets(π_data, U_data, [ε_true, 2 * ε_true, ε_true],
                            [σ_true, 2 * σ_true, σ_true / 2])
print(f"largest error at the true (ε, σ):          {np.max(np.abs(check[:, 0] - x_data)):.1e}")
print(f"largest difference, (2ε, 2σ) vs (ε, σ):    {np.max(np.abs(check[:, 1] - check[:, 0])):.1e}")
print(f"largest difference, (ε, σ/2) vs (ε, σ):    {np.max(np.abs(check[:, 2] - check[:, 0])):.1e}")
largest error at the true (ε, σ):          0.0e+00
largest difference, (2ε, 2σ) vs (ε, σ):    0.0e+00
largest difference, (ε, σ/2) vs (ε, σ):    1.5e+00
Doubling both \(\varepsilon\) and \(\sigma\) leaves the targets unchanged, while changing \(\sigma\) alone does not.
The reason is that the filter (105.5) uses \(V\) and \(\sigma\) only through \(\sigma^{-2} V = (\varepsilon/\sigma)^2 V^*\), and the Riccati value of \(P_0\) depends on them in the same way.
Now the likelihood on a grid.
ε_grid = np.linspace(0.005, 0.04, 22)
σ_grid = np.linspace(0.1, 0.6, 22)
EE, SS = np.meshgrid(ε_grid, σ_grid)
targets = reconstruct_targets(π_data, U_data, EE.ravel(), SS.ravel())
loglik = -np.sum((π_data[:, None] - targets)**2, axis=0) / (2 * model.σ2**2)
loglik = (loglik - loglik.max()).reshape(EE.shape)

fig, axes = plt.subplots(1, 2, figsize=(12, 5))
cs = axes[0].contour(SS, EE, loglik, levels=[-3000, -1000, -300, -100])
axes[0].clabel(cs, fontsize=8)
s_line = np.linspace(0.1, 0.6, 2)
axes[0].plot(s_line, (ε_true / σ_true) * s_line, 'k--', lw=1,
             label=r'$\varepsilon / \sigma$ = true value')
axes[0].plot(σ_true, ε_true, 'k*', ms=10, label='truth')
axes[0].set_xlabel(r'government $\sigma$')
axes[0].set_ylabel(r'drift scale $\varepsilon$')
axes[0].set_title('contours of the log likelihood')
axes[0].legend(frameon=False, loc='upper left')

axes[1].scatter((EE / SS).ravel(), loglik.ravel(), s=8)
axes[1].axvline(ε_true / σ_true, color='k', ls='--', lw=1)
axes[1].set_xscale('log')
axes[1].set_xlim(0.03, 0.15)
axes[1].set_ylim(-3000, 100)
axes[1].set_xlabel(r'$\varepsilon / \sigma$')
axes[1].set_title(f'all {loglik.size} candidates against their ratio')
plt.tight_layout()
plt.show()

ratio_hat = (EE.ravel() / SS.ravel())[np.argmax(loglik)]
print(f"true ε/σ = {ε_true / σ_true:.4f}; ratio at the grid maximum = {ratio_hat:.4f}")
true ε/σ = 0.0667; ratio at the grid maximum = 0.0664
The contours of the likelihood are rays through the origin, and plotted against \(\varepsilon/\sigma\) the log likelihoods of all the candidates fall on a single curve: the data pin down \(\varepsilon/\sigma\), the government’s effective gain, but say nothing about \(\varepsilon\) and \(\sigma\) separately.
That is the econometric counterpart of the two equivalent interpretations of Sims’s example: “too much drift” and “too little error variance” are observationally equivalent descriptions of the same learning rule.
Separating them would require evidence on how uncertain the government says it is, for example its predictive variance \(\sigma^2 (1 + \Phi_n^\top P_n \Phi_n)\), and not only on what it does or forecasts.
What the data do identify, they keep identifying as the sample grows, because the filter’s gain never vanishes and so keeps shaping beliefs (The econometricians did return the compliment).