23. Heterogeneous Beliefs and Financial Markets#
23.1. Overview#
A likelihood ratio process lies behind Lawrence Blume and David Easley’s answer to their question “If you’re so smart, why aren’t you rich?” [Blume and Easley, 2006].
Blume and Easley constructed formal models to study how differences of opinions about probabilities governing risky income processes would influence outcomes and be reflected in prices of stocks, bonds, and insurance policies that individuals use to share and hedge risks.
Note
[Alchian, 1950] and [Friedman, 1953] conjectured that, by rewarding traders with more realistic probability models, competitive markets in financial securities put wealth in the hands of better informed traders and help make prices of risky assets reflect realistic probability assessments.
Here we’ll provide an example that illustrates basic components of Blume and Easley’s analysis.
Our main tools are the likelihood ratio processes and Kullback–Leibler divergences studied in Likelihood Ratio Processes.
We’ll focus only on their analysis of an environment with complete markets in which trades in all conceivable risky securities are possible.
We’ll study two alternative arrangements:
perfect socialism in which individuals surrender their endowments of consumption goods each period to a central planner who then dictatorially allocates those goods
a decentralized system of competitive markets in which selfish price-taking individuals voluntarily trade with each other in competitive markets
The fundamental theorems of welfare economics will apply and assure us that these two arrangements end up producing exactly the same allocation of consumption goods to individuals provided that the social planner assigns an appropriate set of Pareto weights.
Note
You can learn about how the two welfare theorems are applied in modern macroeconomic models in this lecture on a planning problem and this lecture on a related competitive equilibrium. This quantecon lecture presents a recursive formulation of complete markets models with homogeneous beliefs.
Let’s start by importing some Python tools.
import matplotlib.pyplot as plt
import numpy as np
from numba import vectorize, jit
from math import gamma
from scipy.integrate import quad
from scipy.special import expit

rng = np.random.default_rng()
23.2. Review: likelihood ratio processes#
Likelihood Ratio Processes studies likelihood ratio processes in detail.
We recall the facts that we use here.
A nonnegative random variable \(W\) has one of two probability density functions, either \(f\) or \(g\).
We assume that \(f\) and \(g\) both put positive probabilities on the same intervals of possible realizations of the random variable \(W\).
For a sequence \(\{w_t\}_{t=1}^\infty\) of IID draws, the time \(t\) likelihood ratio is
and the likelihood ratio process is
where \(w^t=\{ w_1,\dots,w_t\}\) is a history of observations up to and including time \(t\).
We write \(L_t = L(w^t)\).
The likelihood ratio process satisfies the recursion \(L(w^t) = \ell (w_t) L (w^{t-1})\).
Suppose that a density \(h\) generates the data.
Let \(K_f = KL(h, f)\) and \(K_g = KL(h, g)\) be the Kullback–Leibler divergences of \(f\) and \(g\) from \(h\).
The strong law of large numbers applied to \(\log L_t = \sum_{i=1}^t \log \ell(w_i)\) implies
A helpful formula in Likelihood Ratio Processes derives the corresponding formula for \(\frac{1}{t} E_h [\log L_t]\).
When \(K_f < K_g\), \(L_t \rightarrow +\infty\); when \(K_f > K_g\), \(L_t \rightarrow 0\).
When \(h = f\), the drift of \(\log L_t\) is \(KL(f, g) > 0\); when \(h = g\), it is \(-KL(g, f) < 0\).
The following Python code defines \(f\) and \(g\) as two Beta densities.
# Parameters in the two Beta distributions.
F_a, F_b = 1, 1
G_a, G_b = 3, 1.2

@vectorize
def p(x, a, b):
    r = gamma(a + b) / (gamma(a) * gamma(b))
    return r * x** (a-1) * (1 - x) ** (b-1)

# The two density functions.
f = jit(lambda x: p(x, F_a, F_b))
g = jit(lambda x: p(x, G_a, G_b))
23.3. Blume and Easley’s setting#
Let the random variable \(s_t \in (0,1)\) at time \(t =0, 1, 2, \ldots\) be distributed according to the same Beta distribution with parameters \(\theta = \{\theta_1, \theta_2\}\).
We’ll denote this probability density as
Below, we’ll often just write \(\pi(s_t)\) instead of \(\pi(s_t|\theta)\) to save space.
Let \(s_t \equiv y_t^1\) be the endowment of a nonstorable consumption good that a person we’ll call “agent 1” receives at time \(t\).
Let a history \(s^t = [s_t, s_{t-1}, \ldots, s_0]\) be a sequence of i.i.d. random variables with joint distribution
So in our example, the history \(s^t\) is a comprehensive record of agent \(1\)’s endowments of the consumption good from time \(0\) up to time \(t\).
If agent \(1\) were to live on an island by himself, agent \(1\)’s consumption \(c^1(s_t)\) at time \(t\) is
But in our model, agent 1 is not alone.
23.4. Nature and agents’ beliefs#
Nature draws i.i.d. sequences \(\{s_t\}_{t=0}^\infty\) from \(\pi_t(s^t)\).
so \(\pi\) without a superscript is nature’s model
but in addition to nature, there are other entities inside our model – artificial people that we call “agents”
each agent has a sequence of probability distributions over \(s^t\) for \(t=0, \ldots\)
agent \(i\) thinks that nature draws i.i.d. sequences \(\{s_t\}_{t=0}^\infty\) from \(\{\pi_t^i(s^t)\}_{t=0}^\infty\)
agent \(i\) is mistaken unless \(\pi_t^i(s^t) = \pi_t(s^t)\)
Note
A rational expectations model would set \(\pi_t^i(s^t) = \pi_t(s^t)\) for all agents \(i\).
There are two agents named \(i=1\) and \(i=2\).
At time \(t\), agent \(1\) receives an endowment
of a nonstorable consumption good, while agent \(2\) receives an endowment of
The aggregate endowment of the consumption good is
at each date \(t \geq 0\).
At date \(t\) agent \(i\) consumes \(c_t^i(s^t)\) of the good.
A (non wasteful) feasible allocation of the aggregate endowment of \(1\) each period satisfies
23.7. If you’re so smart, \(\ldots\)#
Let’s compute some values of limiting allocations (23.6) for some interesting possible limiting values of the likelihood ratio process \(l_t(s^t)\).
As our first case, let’s suppose that the two agents have identical beliefs, \(\pi^1 = \pi^2\), so that
In this case, the consumption allocation stays put at a \(\lambda, 1 - \lambda\) split between the two agents.
As our second case, let’s suppose that
In this case, agent 2 is “smarter” than agent 1, and agent 1’s share of the aggregate endowment converges to zero.
As our third case, let’s suppose that
In this case, agent 1 is smarter than agent 2, and agent 1’s share of the aggregate endowment converges to 1.
Kullback–Leibler divergences of the agents’ beliefs from nature’s density determine which case occurs.
Let
When nature draws \(s_t\) IID from \(\pi\), \(\log l_t(s^t) = \sum_{j=0}^t \log [\pi^1(s_j)/\pi^2(s_j)]\) is a sum of IID random variables with mean
The strong law of large numbers implies
Formula (23.8) is the formula in A helpful formula of Likelihood Ratio Processes with \(h = \pi\), \(f = \pi^1\), and \(g = \pi^2\).
It implies:
if \(KL(\pi, \pi^1) < KL(\pi, \pi^2)\), then \(l_t \rightarrow +\infty\) and \(c_t^1 \rightarrow 1\)
if \(KL(\pi, \pi^1) > KL(\pi, \pi^2)\), then \(l_t \rightarrow 0\) and \(c_t^1 \rightarrow 0\)
if \(KL(\pi, \pi^1) = KL(\pi, \pi^2)\) and \(\pi^1 \neq \pi^2\), then \(\log l_t\) is a random walk with zero drift and positive variance; its \(\limsup\) is \(+\infty\) and its \(\liminf\) is \(-\infty\), so \(c_t^1\) swings between values near \(0\) and values near \(1\) and never settles down
Exercise 23.3 studies the third case.
“Smarter” means closer to nature’s \(\pi\) in Kullback–Leibler divergence.
An agent with correct beliefs, \(\pi^i = \pi\), has \(KL(\pi, \pi^i) = 0\) and drives out any agent whose beliefs differ.
Sandroni [2000] and Blume and Easley [2006] prove market selection results of this kind for more general economies.
Note
These three cases are somehow telling us about how relative wealths of the agents evolve as time passes.
when the two agents have identical beliefs and \(\lambda \in (0,1)\), agent 1’s wealth share stays at \(\lambda\) perpetually.
when agent 1 is smarter and \(\lambda \in (0,1)\), agent 1 eventually “owns” the entire continuation endowment and agent 2 eventually “owns” nothing.
when agent 2 is smarter and \(\lambda \in (0,1)\), agent 2 eventually “owns” the entire continuation endowment and agent 1 eventually “owns” nothing.
We define continuation wealths precisely after we construct a competitive equilibrium price system below.
Soon we’ll do some simulations that will shed further light on possible outcomes.
But before we do that, let’s take a detour and study the “shadow prices” \(\theta_t(s^t)\) in (23.7) for the social planning problem.
We shall soon see that these shadow prices can readily be converted to “equilibrium prices” for a competitive equilibrium.
Doing this will allow us to connect our analysis with claims by [Alchian, 1950] and [Friedman, 1953] that transfers of wealth coming from trades in competitive asset markets eventually make prices of risky assets reflect realistic probability assessments.
23.8. Competitive equilibrium prices#
Two fundamental welfare theorems for general equilibrium models lead us to anticipate that there is a connection between the allocation that solves the social planning problem we have been studying and the allocation in a competitive equilibrium with complete markets in contingent claims to time- and history-dependent consumption goods.
Note
For the two welfare theorems and their history, see https://en.wikipedia.org/wiki/Fundamental_theorems_of_welfare_economics. Again, for applications to a classic macroeconomic growth model, see this lecture on a planning problem and this lecture on a related competitive equilibrium
Such a connection prevails for our model.
We’ll sketch it now.
In a competitive equilibrium, no social planner dictatorially collects everybody’s endowments and then reallocates them.
Instead, there is a comprehensive centralized market that meets at one point in time.
There are prices at which price-taking agents can buy or sell whatever goods that they want.
Trade is multilateral in the sense that a “Walrasian auctioneer” who lives outside the model finds prices at which supply equals demand for every good.
Each agent faces a budget constraint.
That budget constraint requires that the total value of the agent’s endowment stream be at least as large as the total value of its consumption stream.
These values are computed at price vectors that the agents take as given – the agents are “price-takers” who assume that they can buy or sell whatever quantities that they want at those prices.
Suppose that at time \(-1\), before time \(0\) starts, agent \(i\) can purchase one unit \(c_t(s^t)\) of consumption at time \(t\) after history \(s^t\) at price \(p_t(s^t)\).
The price vector is very long:
there is one price \(p_t(s^t)\) for each history \(s^t\) at every date \(t = 0, 1, \ldots, \).
so there are as many prices as there are histories and dates.
The auctioneer sets these prices at time \(-1\), before the economy starts.
The market meets once at time \(-1\).
At times \(t =0, 1, 2, \ldots\) trades made at time \(-1\) are simply executed, i.e., the promised deliveries are made.
in the background, there is an “enforcement” procedure that forces agents to carry out the exchanges or “deliveries” that they agreed to at time \(-1\).
We want to study how agents’ probability models influence equilibrium prices.
Agent \(i\) faces a single intertemporal budget constraint
Because \(s_t\) has a density, \(p_t(s^t)\) is a price density: \(p_t(s^t) \, ds^t\) is the time \(-1\) price of one unit of consumption at date \(t\) delivered if the history lands in a small set \(ds^t\) around \(s^t\).
According to budget constraint (23.9), trade is multilateral in the following sense
imagine that agent \(i\) first sells his random endowment stream \(\{y_t^i (s^t)\}\) and then uses the proceeds (i.e., his “wealth”) to purchase a random consumption stream \(\{c_t^i (s^t)\}\).
Agent \(i\) attaches a Lagrange multiplier \(\mu_i\) to budget constraint (23.9) and once-and-for-all chooses a consumption plan \(\{c^i_t(s^t)\}_{t=0}^\infty\) that maximizes criterion (23.2) subject to budget constraint (23.9).
This means that the agent \(i\) chooses many objects, namely, \(c_t^i(s^t)\) for all \(s^t\) for \(t = 0, 1, 2, \ldots\).
For convenience, let’s remind ourselves of criterion \(V^i\) defined in (23.2):
First-order necessary conditions for maximizing objective \(V^i\) defined in (23.2) with respect to \(c_t^i(s^t)\) are
which we can rearrange to obtain
for \(i=1,2\).
If we divide equation (23.10) for agent \(1\) by the appropriate version of equation (23.10) for agent 2, impose the feasibility condition \(c^2_t(s^t) = 1 - c^1_t(s^t)\), and do some algebra, we’ll obtain
We now embark on an extended “guess-and-verify” exercise that involves matching objects in our competitive equilibrium with objects in our social planning problem.
we’ll match consumption allocations in the planning problem with equilibrium consumption allocations in the competitive equilibrium
we’ll match “shadow” prices in the planning problem with competitive equilibrium prices.
Formula (23.11) has the same form as formula (23.6) with \(\lambda/(1-\lambda) = \mu_2/\mu_1\).
Setting \(\mu_1 = 1-\lambda\) and \(\mu_2 = \lambda\) makes the two formulas agree.
Only the ratio \(\mu_2/\mu_1\) matters for the allocation.
multiplying \(\mu_1\) and \(\mu_2\) by a positive constant and dividing all prices \(p_t(s^t)\) by the same constant leaves budget constraints and first-order conditions unchanged
choosing that constant amounts to choosing a numeraire or normalization for the price system \(\{p_t(s^t)\}_{t=0}^\infty\)
Note
For information about how a numeraire must be chosen to pin down the absolute price level in a model like ours that determines only relative prices, see https://en.wikipedia.org/wiki/Numéraire.
The ratio \(\mu_2/\mu_1\) is not a normalization.
Budget constraints (23.9) pin it down, and with it the Pareto weight \(\lambda\), as we show below.
If we set \(\mu_1 = 1-\lambda\) and \(\mu_2 = \lambda\), substitute formula (23.11) for \(c_t^1(s^t)\) into formula (23.10), and rearrange, we obtain
or
Comparing (23.12) with (23.7) shows that \(p_t(s^t) = \theta_t(s^t)/(\lambda(1-\lambda))\).
Competitive equilibrium prices are proportional to the planner’s shadow prices.
The normalization \(\mu_1 = 1/\lambda\) and \(\mu_2 = 1/(1-\lambda)\) makes them equal: \(p_t(s^t) = \theta_t(s^t)\).
According to formula (23.12), we have the following possible limiting cases:
when \(l_\infty = 0\), \(c_\infty^1 = 0 \) and tails of competitive equilibrium prices reflect agent \(2\)’s probability model \(\pi_t^2(s^t)\) according to \(p_t(s^t) \propto \delta^t \pi_t^2(s^t) \)
when \(l_\infty = \infty\), \(c_\infty^1 = 1 \) and tails of competitive equilibrium prices reflect agent \(1\)’s probability model \(\pi_t^1(s^t)\) according to \(p_t(s^t) \propto \delta^t \pi_t^1(s^t) \)
for small \(t\)’s, competitive equilibrium prices reflect both agents’ probability models.
23.8.1. The competitive equilibrium Pareto weight#
Let \(E^i[s] = \int s \, \pi^i(s) \, ds\) be agent \(i\)’s expected value of \(s_t\).
Substituting allocation (23.6) and prices (23.12) into agent 1’s budget constraint (23.9) with \(y_t^1 = s_t\) and imposing equality gives
or
Exercise 23.1 asks you to verify this.
Agent 2’s budget constraint then holds by Walras’ law.
Finding Pareto weights at which the planner’s allocation satisfies every agent’s budget constraint is the method of Negishi [1960].
The left side of the first equation is agent 1’s share of total wealth at time \(-1\).
The right side is the market value of agent 1’s endowment stream divided by the market value of the aggregate endowment stream.
For \(\pi^1 = f = \text{Beta}(1, 1)\) and \(\pi^2 = g = \text{Beta}(3, 1.2)\), \(E^1[s] = 1/2\), \(E^2[s] = 5/7\), and \(\lambda = 10/17 \approx 0.588\).
Agent 2 expects agent 1’s endowment to be high.
Agent 2’s beliefs raise the price of claims on agent 1’s endowment and make agent 1 rich.
The simulations below set \(\lambda = 0.5\).
By the second welfare theorem, that allocation is a competitive equilibrium after a time \(-1\) transfer of wealth from agent 1 to agent 2.
23.8.2. Wealth#
Agent \(i\)’s continuation wealth at history \(s^t\) is the value of its continuation consumption plan in units of date \(t\) consumption:
With logarithmic utility, first-order condition (23.10) implies
Total wealth \(W_t^1(s^t) + W_t^2(s^t) = 1/(1-\delta)\) is the value of a claim to the aggregate endowment.
Agent 1’s wealth share equals its consumption share \(c_t^1(s^t) = \lambda_t(s^t)\).
The limiting cases above describe wealth shares as well as consumption shares.
23.8.3. Arrow prices and market selection#
Let \(q(s_{t+1}|s^t) = p_{t+1}(s^{t+1})/p_t(s^t)\) be the Arrow price density at history \(s^t\) of claims to consumption at \(t+1\) contingent on \(s_{t+1}\), measured in units of date \(t\) consumption.
Formula (23.12) and \(\pi_{t+1}^i(s^{t+1}) = \pi^i(s_{t+1}) \pi_t^i(s^t)\) imply
Arrow prices equal \(\delta\) times a mixture of the two agents’ one-period densities.
Wealth shares are the mixing weights.
Integrating (23.15) over \(s_{t+1}\) shows that a one-period riskless bond costs \(\delta\) at every history.
The continuation Pareto weight
is the posterior probability on model \(\pi^1\) of a Bayesian who puts prior probability \(\lambda\) on model \(\pi^1\) and \(1-\lambda\) on model \(\pi^2\) and then observes \(s^t\), as in Likelihood Ratio Processes and Bayesian Learning.
The bracketed term in (23.15) is that Bayesian’s predictive density of \(s_{t+1}\).
Competitive markets price risks as if such a Bayesian set prices.
Formula (23.15) makes the Alchian–Friedman conjecture precise.
When agent 1’s beliefs are correct, \(\pi^1 = \pi\), formula (23.8) implies \(\lambda_t \rightarrow 1\).
Arrow prices then converge to \(\delta \pi(s_{t+1})\) and reflect true probabilities.
When neither agent’s beliefs are correct and \(KL(\pi, \pi^1) \neq KL(\pi, \pi^2)\), Arrow prices converge to \(\delta\) times the one-period density of the agent whose beliefs are closer to \(\pi\) in Kullback–Leibler divergence.
Markets then select the less wrong model, and prices do not converge to the truth.
23.9. Simulations#
Now let’s implement some simulations when agent \(1\) believes marginal density
and agent \(2\) believes marginal density
where \(f\) and \(g\) are Beta distributions like ones that we used in earlier sections of this lecture.
Meanwhile, we’ll assume that nature believes a marginal density
where \(h(s_t)\) is perhaps a mixture of \(f\) and \(g\).
First, we write a function to compute the likelihood ratio process
def compute_likelihood_ratios(sequences, f, g):
    """Compute likelihood ratios and cumulative products."""
    l_ratios = f(sequences) / g(sequences)
    L_cumulative = np.cumprod(l_ratios, axis=1)
    return l_ratios, L_cumulative
Let’s compute the Kullback–Leibler discrepancies by quadrature integration.
def compute_KL(f, g):
    """
    Compute KL divergence KL(f, g)
    """
    integrand = lambda w: f(w) * np.log(f(w) / g(w))
    val, _ = quad(integrand, 1e-5, 1-1e-5)
    return val
We also create a helper function to compute KL divergence with respect to a reference distribution \(h\)
def compute_KL_h(h, f, g):
    """
    Compute KL divergence with reference distribution h
    """

    Kf = compute_KL(h, f)
    Kg = compute_KL(h, g)

    return Kf, Kg
Let’s write a Python function that computes agent 1’s consumption share
def simulate_blume_easley(sequences, f_belief=f, g_belief=g, λ=0.5):
    """Simulate Blume-Easley model consumption shares."""
    l_ratios, l_cumulative = compute_likelihood_ratios(sequences, f_belief, g_belief)
    c1_share = λ * l_cumulative / (1 - λ + λ * l_cumulative)
    return l_cumulative, c1_share
Now let’s use this function to generate sequences in which
nature draws from \(f\) each period, or
nature draws from \(g\) each period, or
nature flips a fair coin each period to decide whether to draw from \(f\) or \(g\)
λ = 0.5
T = 100
N = 10000

# Nature follows f, g, or mixture
s_seq_f = rng.beta(F_a, F_b, (N, T))
s_seq_g = rng.beta(G_a, G_b, (N, T))

h = jit(lambda x: 0.5 * f(x) + 0.5 * g(x))
model_choices = rng.random((N, T)) < 0.5
s_seq_h = np.empty((N, T))
s_seq_h[model_choices] = rng.beta(F_a, F_b, size=model_choices.sum())
s_seq_h[~model_choices] = rng.beta(G_a, G_b, size=(~model_choices).sum())

l_cum_f, c1_f = simulate_blume_easley(s_seq_f)
l_cum_g, c1_g = simulate_blume_easley(s_seq_g)
l_cum_h, c1_h = simulate_blume_easley(s_seq_h)
Before looking at the figure below, have some fun by guessing whether agent 1 or agent 2 will have a larger and larger consumption share as time passes in our three cases.
To make better guesses, let’s visualize instances of the likelihood ratio processes in the three cases.
fig, axes = plt.subplots(2, 3, figsize=(15, 10))

titles = ["Nature = f", "Nature = g", "Nature = mixture"]
data_pairs = [(l_cum_f, c1_f), (l_cum_g, c1_g), (l_cum_h, c1_h)]

for i, ((l_cum, c1), title) in enumerate(zip(data_pairs, titles)):
    # Likelihood ratios
    ax = axes[0, i]
    for j in range(min(50, l_cum.shape[0])):
        ax.plot(l_cum[j, :], alpha=0.3, color='blue')
    ax.set_yscale('log')
    ax.set_xlabel('time')
    ax.set_ylabel('Likelihood ratio $l_t$')
    ax.set_title(title)
    ax.axhline(y=1, color='red', linestyle='--', alpha=0.5)

    # Consumption shares
    ax = axes[1, i]
    for j in range(min(50, c1.shape[0])):
        ax.plot(c1[j, :], alpha=0.3, color='green')
    ax.set_xlabel('time')
    ax.set_ylabel("Agent 1's consumption share")
    ax.set_ylim([0, 1])
    ax.axhline(y=λ, color='red', linestyle='--', alpha=0.5)

plt.tight_layout()
plt.show()
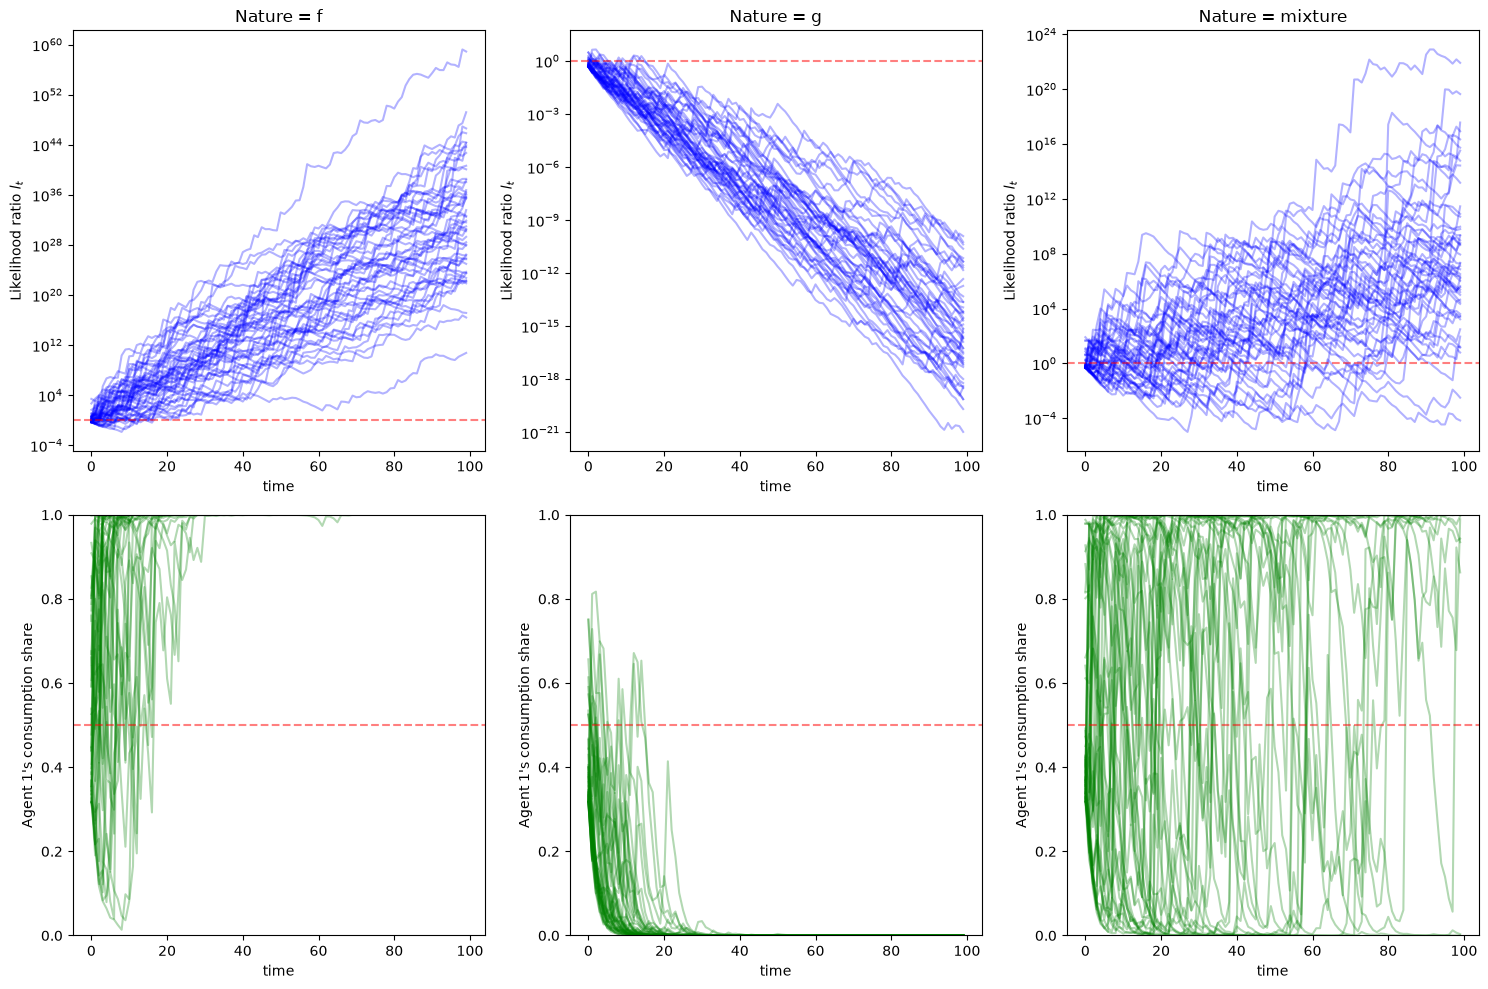
In the left panel, nature chooses \(f\). Agent 1’s consumption reaches \(1\) very quickly.
In the middle panel, nature chooses \(g\). Agent 1’s consumption ratio tends to move towards \(0\) but not as fast as in the first case.
In the right panel, nature flips coins each period. Agent 1’s consumption share again moves toward \(1\), more slowly than in the left panel.
The figures in the top panel remind us of the discussion in this section of Likelihood Ratio Processes.
We invite readers to revisit that section and try to infer the relationships among \(D_{KL}(f\|g)\), \(D_{KL}(g\|f)\), \(D_{KL}(h\|f)\), and \(D_{KL}(h\|g)\).
Let’s compute values of KL divergence
shares = [np.mean(c1_f[:, -1]), np.mean(c1_g[:, -1]), np.mean(c1_h[:, -1])]
Kf_g, Kg_f = compute_KL(f, g), compute_KL(g, f)
Kf_h, Kg_h = compute_KL_h(h, f, g)

print(f"Final shares: f={shares[0]:.3f}, g={shares[1]:.3f}, mix={shares[2]:.3f}")
print(f"KL divergences: \nKL(f,g)={Kf_g:.3f}, KL(g,f)={Kg_f:.3f}")
print(f"KL(h,f)={Kf_h:.3f}, KL(h,g)={Kg_h:.3f}")
Final shares: f=1.000, g=0.000, mix=0.923
KL divergences:
KL(f,g)=0.759, KL(g,f)=0.344
KL(h,f)=0.073, KL(h,g)=0.281
We find that \(KL(f,g) > KL(g,f)\) and \(KL(h,g) > KL(h,f)\).
The first inequality tells us that the average “surprise” from having belief \(g\) when nature chooses \(f\) is greater than the “surprise” from having belief \(f\) when nature chooses \(g\).
This explains the difference between the first two panels we noted above.
The second inequality tells us that agent 1’s belief distribution \(f\) is closer to nature’s pick than agent 2’s belief \(g\).
By formula (23.8), \(\log l_t\) drifts upward at rate \(KL(f,g) = 0.759\) per period when nature draws from \(f\) and at rate \(KL(h,g) - KL(h,f) = 0.208\) per period when nature draws from the mixture \(h\).
The drift has the same sign in the left and right panels and is about 3.6 times smaller in the right panel.
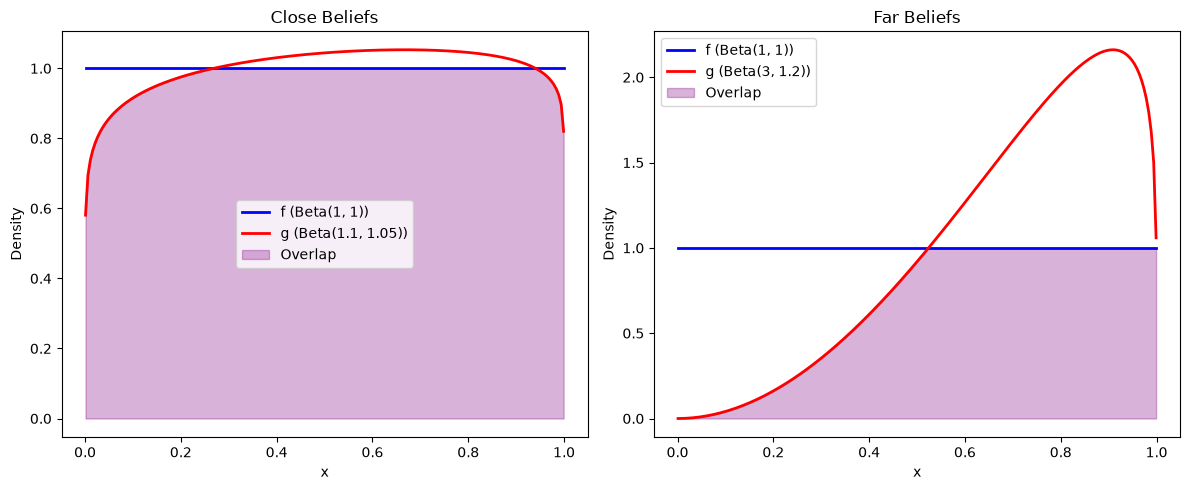
To make this idea more concrete, let’s compare two cases:
agent 1’s belief distribution \(f\) is close to agent 2’s belief distribution \(g\);
agent 1’s belief distribution \(f\) is far from agent 2’s belief distribution \(g\).
We use the two distributions visualized below
def plot_distribution_overlap(ax, x_range, f_vals, g_vals,
                            f_label='f', g_label='g',
                            f_color='blue', g_color='red'):
    """Plot two distributions with their overlap region."""
    ax.plot(x_range, f_vals, color=f_color, linewidth=2, label=f_label)
    ax.plot(x_range, g_vals, color=g_color, linewidth=2, label=g_label)

    overlap = np.minimum(f_vals, g_vals)
    ax.fill_between(x_range, 0, overlap, alpha=0.3, color='purple', label='Overlap')
    ax.set_xlabel('x')
    ax.set_ylabel('Density')
    ax.legend()

# Define close and far belief distributions
f_close = jit(lambda x: p(x, 1, 1))
g_close = jit(lambda x: p(x, 1.1, 1.05))

f_far = jit(lambda x: p(x, 1, 1))
g_far = jit(lambda x: p(x, 3, 1.2))

# Visualize the belief distributions
fig, (ax1, ax2) = plt.subplots(1, 2, figsize=(12, 5))

x_range = np.linspace(0.001, 0.999, 200)

# Close beliefs
f_close_vals = [f_close(x) for x in x_range]
g_close_vals = [g_close(x) for x in x_range]
plot_distribution_overlap(ax1, x_range, f_close_vals, g_close_vals,
                         f_label='f (Beta(1, 1))', g_label='g (Beta(1.1, 1.05))')
ax1.set_title(f'Close Beliefs')

# Far beliefs
f_far_vals = [f_far(x) for x in x_range]
g_far_vals = [g_far(x) for x in x_range]
plot_distribution_overlap(ax2, x_range, f_far_vals, g_far_vals,
                         f_label='f (Beta(1, 1))', g_label='g (Beta(3, 1.2))')
ax2.set_title(f'Far Beliefs')

plt.tight_layout()
plt.show()
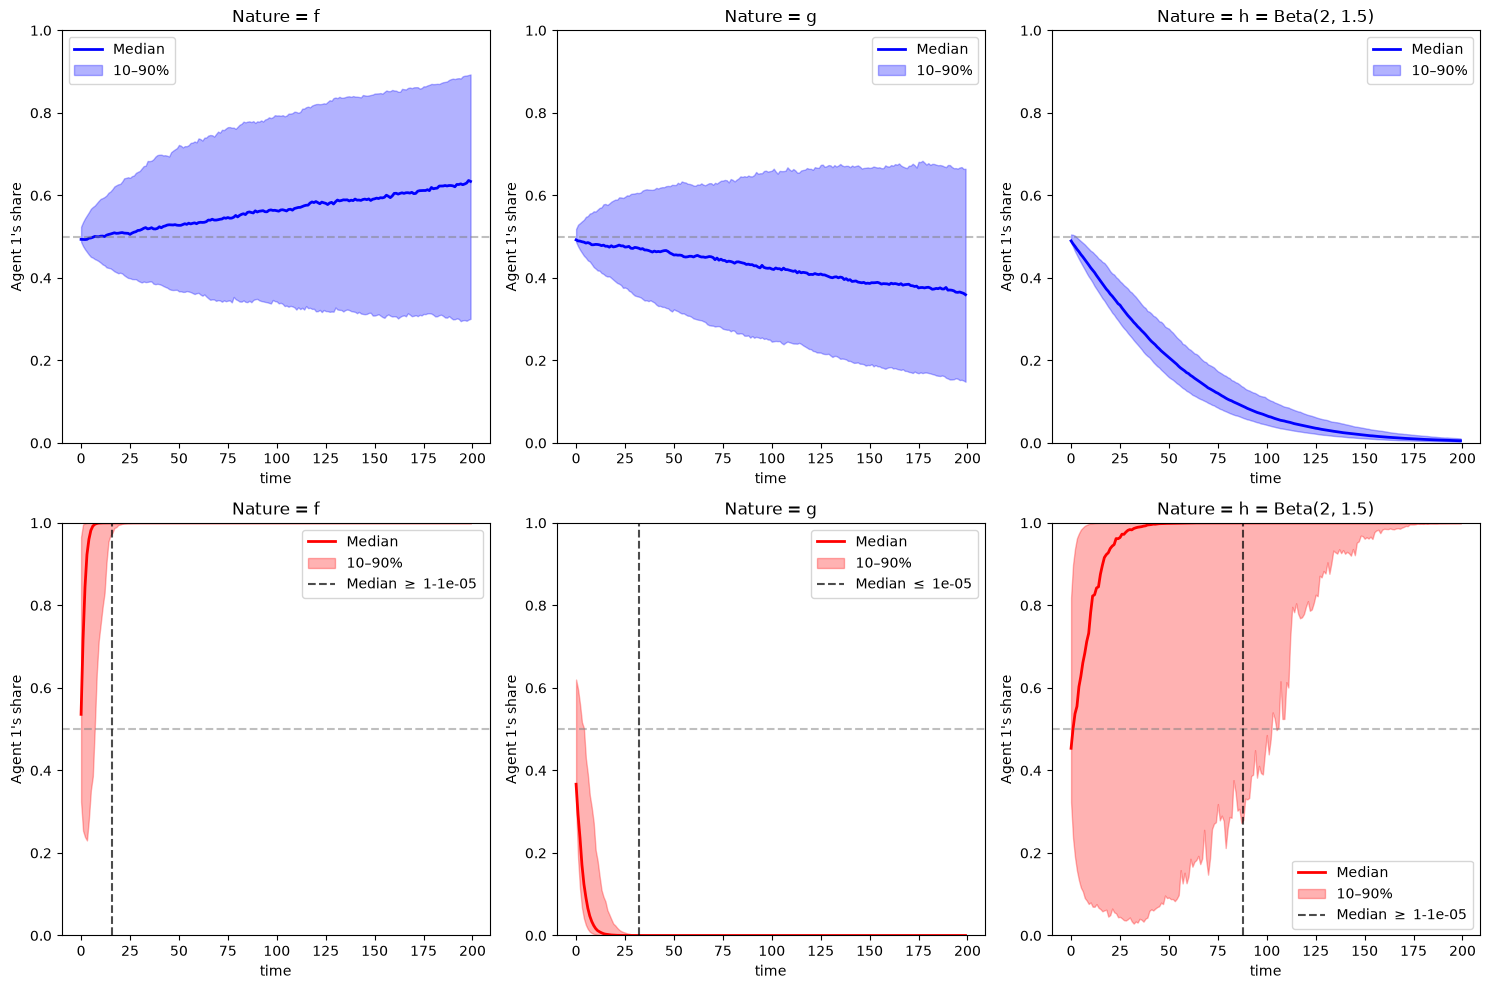
Let’s draw the same consumption ratio plots as above for agent 1.
We replace the simulation paths with median and percentiles to make the figure cleaner.
In the third column, nature draws from \(h = \text{Beta}(2, 1.5)\), a different \(h\) from the mixture used above.
Staring at the figure below, can we infer the relation between \(KL(f,g)\) and \(KL(g,f)\)?
From the right panel, can we infer the relation between \(KL(h,g)\) and \(KL(h,f)\)?
fig, axes = plt.subplots(2, 3, figsize=(15, 10))
nature_params = {'close': [(1, 1), (1.1, 1.05), (2, 1.5)],
                 'far':   [(1, 1), (3, 1.2),   (2, 1.5)]}
nature_labels = ["Nature = f", "Nature = g", "Nature = h = Beta(2, 1.5)"]
colors = {'close': 'blue', 'far': 'red'}

threshold = 1e-5  # "close to zero" cutoff

for row, (f_belief, g_belief, label) in enumerate([
                        (f_close, g_close, 'close'),
                        (f_far, g_far, 'far')]):

    for col, nature_label in enumerate(nature_labels):
        params = nature_params[label][col]
        s_seq = rng.beta(params[0], params[1], (1000, 200))
        _, c1 = simulate_blume_easley(s_seq, f_belief, g_belief, λ)

        median_c1 = np.median(c1, axis=0)
        p10, p90 = np.percentile(c1, [10, 90], axis=0)

        ax = axes[row, col]
        color = colors[label]
        ax.plot(median_c1, color=color, linewidth=2, label='Median')
        ax.fill_between(range(len(median_c1)), p10, p90, alpha=0.3, color=color, label='10–90%')
        ax.set_xlabel('time')
        ax.set_ylabel("Agent 1's share")
        ax.set_ylim([0, 1])
        ax.set_title(nature_label)
        ax.axhline(y=λ, color='gray', linestyle='--', alpha=0.5)
        below = np.where(median_c1 < threshold)[0]
        above = np.where(median_c1 > 1-threshold)[0]
        if below.size > 0: first_zero = (below[0], True)
        elif above.size > 0: first_zero = (above[0], False)
        else: first_zero = None
        if first_zero is not None:
            ax.axvline(x=first_zero[0], color='black', linestyle='--',
                       alpha=0.7,
                       label=fr'Median $\leq$ {threshold}' if first_zero[1]
                       else fr'Median $\geq$ 1-{threshold}')
        ax.legend()

plt.tight_layout()
plt.show()
Holding to our guesses, let’s calculate the four values
# Nature's density in the third column
h_beta = jit(lambda x: p(x, 2, 1.5))

# Close case
Kf_g, Kg_f = compute_KL(f_close, g_close), compute_KL(g_close, f_close)
Kf_h, Kg_h = compute_KL_h(h_beta, f_close, g_close)

print(f"KL divergences (close): \nKL(f,g)={Kf_g:.3f}, KL(g,f)={Kg_f:.3f}")
print(f"KL(h,f)={Kf_h:.3f}, KL(h,g)={Kg_h:.3f}")

# Far case
Kf_g, Kg_f = compute_KL(f_far, g_far), compute_KL(g_far, f_far)
Kf_h, Kg_h = compute_KL_h(h_beta, f_far, g_far)

print(f"KL divergences (far): \nKL(f,g)={Kf_g:.3f}, KL(g,f)={Kg_f:.3f}")
print(f"KL(h,f)={Kf_h:.3f}, KL(h,g)={Kg_h:.3f}")
KL divergences (close):
KL(f,g)=0.003, KL(g,f)=0.003
KL(h,f)=0.108, KL(h,g)=0.082
KL divergences (far):
KL(f,g)=0.759, KL(g,f)=0.344
KL(h,f)=0.108, KL(h,g)=0.241
We find that in the first case, \(KL(f,g) \approx KL(g,f)\) and both are relatively small, so although either agent 1 or agent 2 will eventually consume everything, convergence displayed in the first two panels on the top is pretty slow.
In the first two panels at the bottom, we see convergence occurring faster (as indicated by the black dashed line) because the divergence gaps \(KL(f, g)\) and \(KL(g, f)\) are larger.
Since \(KL(f,g) > KL(g,f)\), we see faster convergence in the first panel at the bottom when nature chooses \(f\) than in the second panel where nature chooses \(g\).
The third column holds nature’s \(h\) and agent 1’s \(f\) fixed and changes agent 2’s \(g\).
In both rows, \(KL(h,f) = 0.108\).
The close \(g\) has \(KL(h,g) = 0.082 < KL(h,f)\), so agent 1’s consumption share drifts toward \(0\).
The far \(g\) has \(KL(h,g) = 0.241 > KL(h,f)\), so agent 1’s consumption share goes to \(1\).
Agent 1 loses to the close \(g\) and wins against the far \(g\).
In each case the winner is the agent whose beliefs have the smaller KL divergence from \(h\).
These outcomes agree with formula (23.8) and with A helpful formula in Likelihood Ratio Processes.
23.11. Exercises#
Exercise 23.1
Agent 1’s endowment is \(y_t^1 = s_t\) and agent 2’s endowment is \(y_t^2 = 1 - s_t\).
Let \(E^i[s] = \int s \, \pi^i(s) \, ds\).
Take prices (23.12) and allocation (23.6) as given.
Show that agent 1’s budget constraint (23.9) holds with equality if and only if \(\lambda\) satisfies (23.13).
Show that \(\lambda\) is agent 1’s share of total wealth at time \(-1\).
Show that continuation wealth satisfies (23.14).
Derive Arrow-price formula (23.15).
Set \(\pi^1 = f = \text{Beta}(1, 1)\), \(\pi^2 = g = \text{Beta}(3, 1.2)\), and \(\delta = 0.9\). Compute \(\lambda\) from (23.13). Use Monte Carlo simulation to compute the values of agent 1’s consumption and endowment streams when \(\lambda\) satisfies (23.13) and when \(\lambda = 0.5\).
Solution
Part 1. Allocation (23.6) is
Multiplying by prices (23.12) gives
Because \(\int \pi_t^1(s^t) \, ds^t = 1\), the value of agent 1’s consumption stream is
Integrating over all dates except \(t\) gives \(\int \pi_t^i(s^t) s_t \, ds^t = E^i[s]\).
The value of agent 1’s endowment stream is
Equating the two values gives \(\lambda = \lambda E^1[s] + (1-\lambda) E^2[s]\).
Solving for \(\lambda\) gives (23.13).
Part 2. The value of the aggregate endowment stream is
Dividing the value of agent 1’s consumption stream by this value gives \(\lambda\).
Part 3. First-order condition (23.10) gives \(p_\tau(s^\tau) c_\tau^i(s^\tau) = \delta^\tau \pi_\tau^i(s^\tau)/\mu_i\).
Integrating over \(s_{t+1}, \ldots, s_\tau\) gives \(\delta^\tau \pi_t^i(s^t)/\mu_i\).
Summing over \(\tau \geq t\) gives \(\delta^t \pi_t^i(s^t)/(\mu_i (1-\delta))\).
Dividing by \(p_t(s^t) = \delta^t \pi_t^i(s^t)/(\mu_i c_t^i(s^t))\) gives \(W_t^i(s^t) = c_t^i(s^t)/(1-\delta)\).
Part 4. Using \(\pi_{t+1}^i(s^{t+1}) = \pi_t^i(s^t) \pi^i(s_{t+1})\) in (23.12),
where the last line uses \(\lambda_t(s^t) = \lambda \pi_t^1(s^t)/[\lambda \pi_t^1(s^t) + (1-\lambda) \pi_t^2(s^t)]\).
Arrow prices from \(s^t\) onward have the same form as prices at time \(-1\), with \(\lambda_t(s^t)\) in place of \(\lambda\).
Part 2 applied at \(s^t\) gives agent 1’s wealth share \(\lambda_t(s^t)\), which agrees with part 3.
Part 5. Prices (23.12) turn the value of any stream \(x_t(s^t)\) into a mixture of expectations under the two agents’ models:
We estimate \(E^i[x_t]\) by averaging over histories drawn from \(\pi^i\).
We report values as shares of the value of the aggregate endowment, which removes the factor \(1/(\lambda(1-\lambda))\).
f = jit(lambda x: p(x, 1, 1))
g = jit(lambda x: p(x, 3, 1.2))

E1 = quad(lambda s: s * f(s), 0, 1)[0]
E2 = quad(lambda s: s * g(s), 0, 1)[0]
λ_ce = E2 / (1 - E1 + E2)

print(f"E^1[s] = {E1:.4f}, E^2[s] = {E2:.4f}, λ = {λ_ce:.4f}")
E^1[s] = 0.5000, E^2[s] = 0.7143, λ = 0.5882
def value_shares(λ, δ=0.9, T=200, N=10_000):
    """
    Monte Carlo values of agent 1's consumption and endowment streams,
    as shares of the value of the aggregate endowment stream.
    """
    discount = δ ** np.arange(T)
    value_c, value_y = 0.0, 0.0

    # Histories drawn from agent 1's model f and agent 2's model g
    for (a, b), weight in [((1, 1), λ), ((3, 1.2), 1 - λ)]:
        s = rng.beta(a, b, (N, T))
        _, l = compute_likelihood_ratios(s, f, g)
        c1 = λ * l / (1 - λ + λ * l)
        value_c += weight * discount @ c1.mean(axis=0)
        value_y += weight * discount @ s.mean(axis=0)

    return value_c / discount.sum(), value_y / discount.sum()


for λ_val in [λ_ce, 0.5]:
    share_c, share_y = value_shares(λ_val)
    exact_y = λ_val * E1 + (1 - λ_val) * E2
    print(f"λ = {λ_val:.3f}: value of c^1 = {share_c:.3f} (exact {λ_val:.3f}), "
          f"value of y^1 = {share_y:.3f} (exact {exact_y:.3f})")
λ = 0.588: value of c^1 = 0.588 (exact 0.588), value of y^1 = 0.588 (exact 0.588)
λ = 0.500: value of c^1 = 0.500 (exact 0.500), value of y^1 = 0.607 (exact 0.607)
At \(\lambda = 10/17\), the values of agent 1’s consumption and endowment streams agree.
At \(\lambda = 0.5\), agent 1’s endowment stream is worth more than its consumption stream.
Agent 1 can then afford more consumption, so \(\lambda = 0.5\) is not a competitive equilibrium Pareto weight without a transfer.
Exercise 23.2
Suppose that agent \(i\) has its own discount factor \(\delta_i\), so that
Keep all other assumptions of the planning problem.
Show that the planner’s allocation satisfies
\[ \frac{c_t^1(s^t)}{c_t^2(s^t)} = \frac{\lambda}{1-\lambda} \left(\frac{\delta_1}{\delta_2}\right)^t l_t(s^t) . \]Show that when nature draws \(s_t\) IID from \(\pi\),
\[ \frac{1}{t} \log \frac{c_t^1(s^t)}{c_t^2(s^t)} \rightarrow \bigl[\log \delta_1 - KL(\pi, \pi^1)\bigr] - \bigl[\log \delta_2 - KL(\pi, \pi^2)\bigr] \quad \text{almost surely}. \]The quantity \(\log \delta_i - KL(\pi, \pi^i)\) is agent \(i\)’s survival index.
Let nature draw from the mixture \(h = 0.5 f + 0.5 g\) with \(f = \text{Beta}(1, 1)\) and \(g = \text{Beta}(3, 1.2)\), as in the right panels of our first figure. Agent 1 believes \(f\) and agent 2 believes \(g\). For which values of \(\delta_1/\delta_2\) does agent 1’s consumption share converge to \(1\)?
Set \(\delta_2 = 0.99\) and \(\lambda = 0.5\). Simulate agent 1’s consumption share for values of \(\delta_1\) on both sides of the threshold you found.
Solution
Part 1. The planner’s first-order conditions become
Equating the first and third expressions and rearranging gives the result.
Part 2. Taking logarithms gives
Dividing by \(t\) and applying (23.8) gives the result.
Part 3. Agent 1’s consumption share converges to \(1\) when its survival index exceeds agent 2’s:
or
f = jit(lambda x: p(x, 1, 1))
g = jit(lambda x: p(x, 3, 1.2))
h = jit(lambda x: 0.5 * f(x) + 0.5 * g(x))

Kh_f, Kh_g = compute_KL_h(h, f, g)
ratio_threshold = np.exp(-(Kh_g - Kh_f))

print(f"KL(h,g) - KL(h,f) = {Kh_g - Kh_f:.3f}")
print(f"agent 1's share converges to 1 if δ_1/δ_2 > {ratio_threshold:.3f}")
KL(h,g) - KL(h,f) = 0.208
agent 1's share converges to 1 if δ_1/δ_2 > 0.812
Agent 1 has better beliefs.
A more patient agent 2 drives agent 1 out when \(\delta_1/\delta_2 < 0.81\).
An agent can make up for worse beliefs by saving more.
Part 4. With \(\delta_2 = 0.99\), the threshold is \(\delta_1 = 0.99 \times 0.81 \approx 0.80\).
We simulate \(\delta_1 = 0.95\) and \(\delta_1 = 0.85\) above the threshold and \(\delta_1 = 0.75\) below it.
def simulate_patience(sequences, δ_1, δ_2, λ=0.5):
    """Agent 1's consumption share when agents discount at δ_1 and δ_2."""
    log_l = np.cumsum(np.log(f(sequences) / g(sequences)), axis=1)
    t = np.arange(sequences.shape[1])
    return expit(np.log(λ / (1 - λ)) + t * np.log(δ_1 / δ_2) + log_l)


T, N = 2000, 1000
δ_2 = 0.99

# Nature draws from the mixture h
draw_f = rng.random((N, T)) < 0.5
s_seq_h = np.where(draw_f, rng.beta(1, 1, (N, T)), rng.beta(3, 1.2, (N, T)))

fig, axes = plt.subplots(1, 3, figsize=(15, 4))
for ax, δ_1 in zip(axes, [0.95, 0.85, 0.75]):
    c1 = simulate_patience(s_seq_h, δ_1, δ_2)
    gap = np.log(δ_1 / δ_2) + Kh_g - Kh_f
    p10, p50, p90 = np.percentile(c1, [10, 50, 90], axis=0)
    ax.plot(p50, color='C0', linewidth=2, label='median')
    ax.fill_between(range(T), p10, p90, color='C0', alpha=0.2, label='10–90%')
    ax.set_title(rf'$\delta_1 = {δ_1}$, index gap = {gap:.3f}')
    ax.set_xlabel('$t$')
    ax.set_ylabel("agent 1's consumption share")
    ax.set_ylim([-0.02, 1.02])
    ax.legend()

plt.tight_layout()
plt.show()
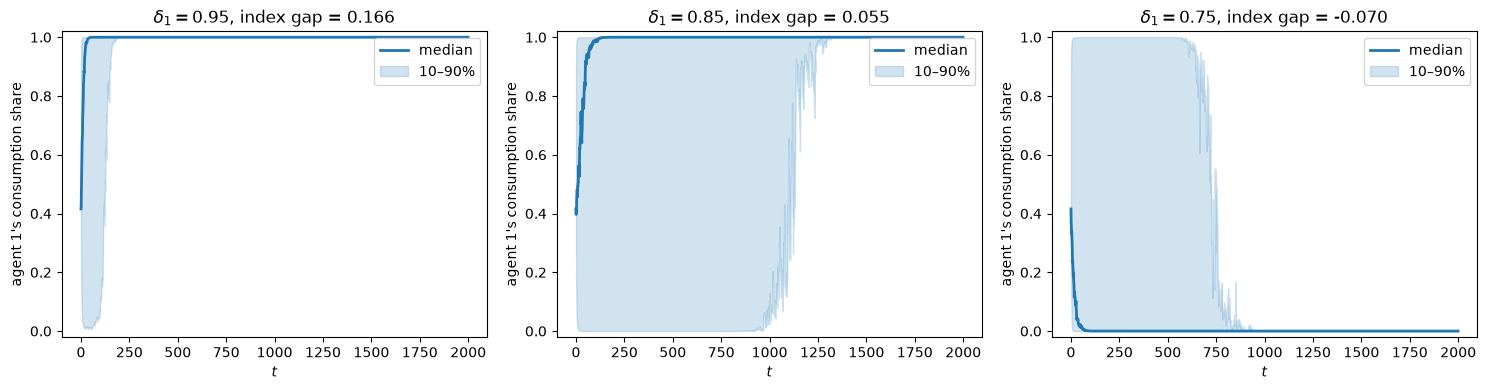
The panel titles report the difference between agent 1’s and agent 2’s survival indexes.
When the difference is positive, agent 1’s consumption share goes to \(1\).
When it is negative, agent 1’s consumption share goes to \(0\) even though agent 1 has better beliefs.
Exercise 23.3
Let nature draw \(s_t\) IID from \(\pi = \text{Beta}(2, 2)\), let agent 1 believe \(\pi^1 = \text{Beta}(2, 3)\), and let agent 2 believe \(\pi^2 = \text{Beta}(3, 2)\).
Set \(\lambda = 0.5\).
Show that \(KL(\pi, \pi^1) = KL(\pi, \pi^2)\).
Show that agent 1’s consumption share \(c_t^1\) does not converge.
Simulate many paths and plot histograms of \(c_t^1\) at \(t = 10, 100, 2000\).
Solution
Part 1. The densities satisfy \(\pi^1(s) = \pi^2(1-s)\) and \(\pi(s) = \pi(1-s)\).
The change of variables \(s \mapsto 1-s\) maps \(KL(\pi, \pi^1)\) into \(KL(\pi, \pi^2)\).
Part 2. Both densities have normalizing constant \(12\), so
Under \(\pi\), this random variable has mean \(0\) by symmetry and variance \(\sigma^2 > 0\).
The log likelihood ratio \(\log l_t\) is a random walk with zero drift and increment variance \(\sigma^2\).
The law of the iterated logarithm implies \(\limsup_t \log l_t = +\infty\) and \(\liminf_t \log l_t = -\infty\) almost surely.
With \(\lambda = 0.5\), \(c_t^1 = l_t/(1 + l_t)\), so \(\limsup_t c_t^1 = 1\) and \(\liminf_t c_t^1 = 0\).
By the central limit theorem, \(\log l_t\) is approximately normal with mean \(0\) and variance \((t+1)\sigma^2\).
The probability that \(c_t^1\) lies near \(0.5\) shrinks at rate \(1/\sqrt{t}\), and the distribution of \(c_t^1\) piles up near \(0\) and \(1\).
Part 3.
rng = np.random.default_rng(1234)

nature = jit(lambda x: p(x, 2, 2))
f = jit(lambda x: p(x, 2, 3))
g = jit(lambda x: p(x, 3, 2))

K1, K2 = compute_KL_h(nature, f, g)
σ2 = quad(lambda s: nature(s) * np.log((1 - s) / s)**2, 0, 1)[0]
print(f"KL(π, π^1) = {K1:.4f}, KL(π, π^2) = {K2:.4f}, σ^2 = {σ2:.3f}")
KL(π, π^1) = 0.1402, KL(π, π^2) = 0.1402, σ^2 = 1.290
N, T = 2000, 2001
s_seq = rng.beta(2, 2, (N, T))
log_l = np.cumsum(np.log(f(s_seq) / g(s_seq)), axis=1)
c1 = expit(log_l)     # λ = 0.5

fig, axes = plt.subplots(1, 3, figsize=(15, 4))
for ax, t in zip(axes, [10, 100, 2000]):
    ax.hist(c1[:, t], bins=40, range=(0, 1), density=True, alpha=0.7)
    ax.set_title(f'$t = {t}$')
    ax.set_xlabel("agent 1's consumption share")
plt.tight_layout()
plt.show()

for t in [10, 100, 2000]:
    near_half = np.mean(np.abs(c1[:, t] - 0.5) < 0.05)
    extreme = np.mean((c1[:, t] < 0.05) | (c1[:, t] > 0.95))
    print(f"t = {t:4d}: P(|c1 - 0.5| < 0.05) = {near_half:.3f}, "
          f"P(c1 < 0.05 or c1 > 0.95) = {extreme:.3f}")
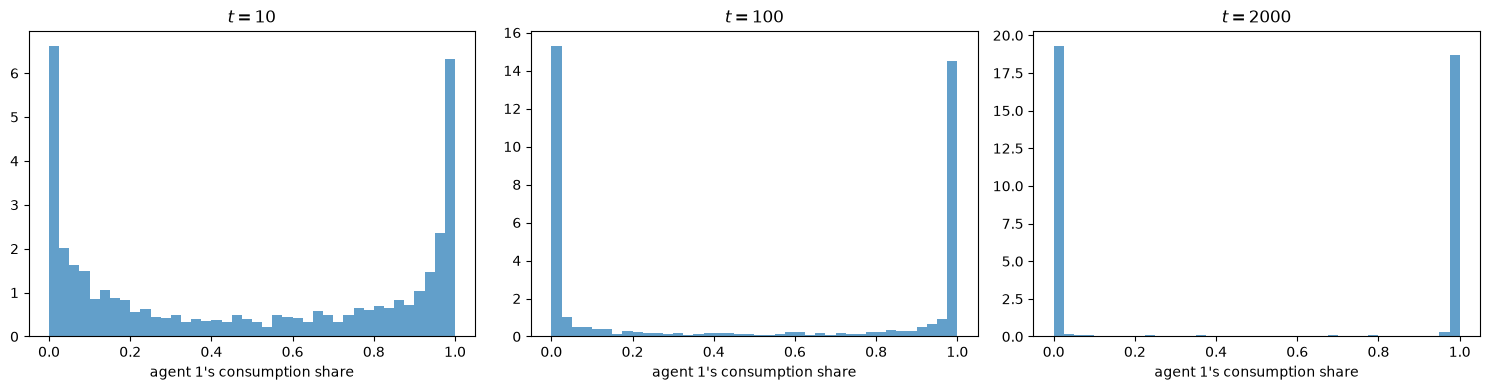
t =   10: P(|c1 - 0.5| < 0.05) = 0.035, P(c1 < 0.05 or c1 > 0.95) = 0.433
t =  100: P(|c1 - 0.5| < 0.05) = 0.011, P(c1 < 0.05 or c1 > 0.95) = 0.794
t = 2000: P(|c1 - 0.5| < 0.05) = 0.003, P(c1 < 0.05 or c1 > 0.95) = 0.961
As \(t\) grows, the histograms put more mass near \(0\) and \(1\) and less near \(0.5\).
The next figure shows five sample paths.
fig, ax = plt.subplots(figsize=(10, 4))
for j in range(5):
    ax.plot(c1[j, :], linewidth=1)
ax.axhline(y=0.5, color='gray', linestyle='--', alpha=0.5)
ax.set_xlabel('$t$')
ax.set_ylabel("agent 1's consumption share")
ax.set_ylim([0, 1])
plt.show()
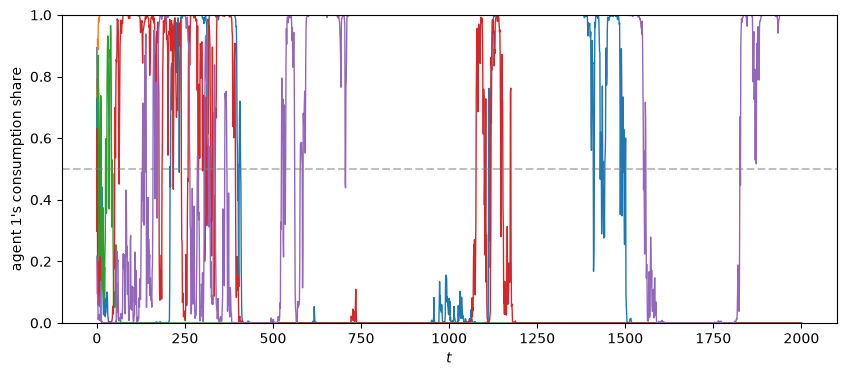
Each path keeps crossing \(0.5\) and spends long spells near \(0\) or near \(1\).
Neither agent is driven out, and neither agent’s share settles down.
Exercise 23.4
In this exercise, each of our two agents is a Bayesian who does not know whether nature draws from \(f\) or from \(g\).
In this exercise and the following ones, dates start at \(t = 1\): the history is \(s^t = (s_1, \ldots, s_t)\).
The following two models are on the table
and
as is an associated likelihood ratio process
The two agents share \(f\) and \(g\) but have different prior probabilities \(\pi^1_0, \pi^2_0 \in (0,1)\) on model \(f\).
Agent \(i\)’s joint density of \(s^t\) is the prior-weighted mixture
As in Likelihood Ratio Processes and Bayesian Learning, Bayes’ law implies that agent \(i\)’s posterior probability on model \(f\) after observing \(s^t\) is
Joint density (23.16) is a product of one-step-ahead predictive densities:
The predictive density of \(s_j\) uses the posterior \(\pi^i_{j-1}\) that agent \(i\) forms before observing \(s_j\).
We now hand probability models (23.16) for \(i=1,2\) to the social planner.
Show that the likelihood ratio \(l_t(s^t) = m^1(s^t)/m^2(s^t)\) satisfies
\[ l_t(s^t) = \frac{\pi^1_0 L(s^t) + 1-\pi^1_0}{\pi^2_0 L(s^t) + 1-\pi^2_0} , \]and find the limits of agent 1’s consumption share when nature draws from \(f\) and when nature draws from \(g\).
Set \(f \sim \text{Beta}(1.5, 1)\), \(g \sim \text{Beta}(1, 1.5)\), and \(\lambda = 0.5\). Write Python code that simulates posteriors and consumption shares for prior pairs \((\pi^1_0, \pi^2_0) = (0.3, 0.7), (0.7, 0.3), (0.1, 0.9)\) when nature draws from \(f\) and when nature draws from \(g\).
Does either agent’s consumption share converge to zero? How do the priors \(\pi^1_0\) and \(\pi^2_0\) affect outcomes?
Solution
Part 1. Dividing the numerator and the denominator of \(m^1(s^t)/m^2(s^t)\) by \(g(s^t)\) gives the formula for \(l_t(s^t)\).
When nature draws from \(f\), \(L(s^t) \rightarrow +\infty\) and \(l_t \rightarrow \pi^1_0/\pi^2_0\), so
When nature draws from \(g\), \(L(s^t) \rightarrow 0\) and \(l_t \rightarrow (1-\pi^1_0)/(1-\pi^2_0)\), so
Both limits lie strictly between \(0\) and \(1\).
Both agents survive.
Part 2. The following function computes posteriors, the likelihood ratio \(l_t\), and agent 1’s consumption share.
It builds \(l_t\) from one-step-ahead predictive densities that use posteriors formed before \(s_t\) is observed.
def simulate_learning_blume_easley(sequences, f_belief, g_belief,
                                   π_0_1, π_0_2, λ=0.5):
    """
    Simulate the Blume-Easley model with two Bayesian agents.

    Column t-1 of `sequences` holds s_t.
    """
    N, T = sequences.shape
    f_vals = f_belief(sequences)
    g_vals = g_belief(sequences)

    π_1_seq = np.empty((N, T))
    π_2_seq = np.empty((N, T))
    l_agents_seq = np.empty((N, T))

    # Priors and l_0 = 1
    π_1 = np.full(N, π_0_1)
    π_2 = np.full(N, π_0_2)
    l_agents = np.ones(N)

    for t in range(T):
        # Predictive densities of s_{t+1} use posteriors given s^t
        m1 = π_1 * f_vals[:, t] + (1 - π_1) * g_vals[:, t]
        m2 = π_2 * f_vals[:, t] + (1 - π_2) * g_vals[:, t]
        l_agents = l_agents * m1 / m2

        # Bayes' law after observing s_{t+1}
        π_1 = π_1 * f_vals[:, t] / m1
        π_2 = π_2 * f_vals[:, t] / m2

        π_1_seq[:, t] = π_1
        π_2_seq[:, t] = π_2
        l_agents_seq[:, t] = l_agents

    c1_share = λ * l_agents_seq / (1 - λ + λ * l_agents_seq)

    return {
        'π_1': π_1_seq,
        'π_2': π_2_seq,
        'c1_share': c1_share,
        'l_agents': l_agents_seq
    }
The next function computes the limits of agent 1’s consumption share from part 1.
def c1_limit(π_0_1, π_0_2, nature_type, λ=0.5):
    """Limit of agent 1's consumption share."""
    if nature_type == 'f':
        w_1, w_2 = π_0_1, π_0_2
    else:
        w_1, w_2 = 1 - π_0_1, 1 - π_0_2
    return λ * w_1 / (λ * w_1 + (1 - λ) * w_2)
Let’s run simulations for different scenarios.
We use \(\lambda = 0.5\), \(T=40\), and \(N=1000\).
λ = 0.5
T = 40
N = 1000

F_a, F_b = 1.5, 1
G_a, G_b = 1, 1.5

f = jit(lambda x: p(x, F_a, F_b))
g = jit(lambda x: p(x, G_a, G_b))
We’ll start with different initial priors \(\pi^i_0 \in (0, 1)\) and widen the gap between them.
# Different initial priors
π_0_scenarios = [
    (0.3, 0.7),
    (0.7, 0.3),
    (0.1, 0.9),
]
Now we can run simulations for different scenarios
rng = np.random.default_rng()

# Nature follows f
s_seq_f = rng.beta(F_a, F_b, (N, T))

# Nature follows g
s_seq_g = rng.beta(G_a, G_b, (N, T))

results_f = {}
results_g = {}

for i, (π_0_1, π_0_2) in enumerate(π_0_scenarios):
    # When nature follows f
    results_f[i] = simulate_learning_blume_easley(
            s_seq_f, f, g, π_0_1, π_0_2, λ)
    # When nature follows g
    results_g[i] = simulate_learning_blume_easley(
            s_seq_g, f, g, π_0_1, π_0_2, λ)
The recursion reproduces the closed form for \(l_t\) in part 1
_, L = compute_likelihood_ratios(s_seq_f, f, g)
π_0_1, π_0_2 = π_0_scenarios[0]
l_closed = (π_0_1 * L + 1 - π_0_1) / (π_0_2 * L + 1 - π_0_2)
print(np.max(np.abs(results_f[0]['l_agents'] / l_closed - 1)))
6.873390745454344e-13
Let’s visualize the results
def plot_learning_results(results, π_0_scenarios, nature_type, λ=0.5):
    """
    Plot median posteriors and consumption shares for learning agents.
    """
    fig, axes = plt.subplots(3, 2, figsize=(10, 15))
    truth = 1.0 if nature_type == 'f' else 0.0

    for row, (π_0_1, π_0_2) in enumerate(π_0_scenarios):
        res = results[row]
        t_grid = np.arange(1, res['c1_share'].shape[1] + 1)
        scenario_label = rf'$\pi_0^1 = {π_0_1}, \pi_0^2 = {π_0_2}$'

        # Posterior probabilities on f
        ax = axes[row, 0]
        ax.plot(t_grid, np.median(res['π_1'], axis=0), 'C0',
                label='agent 1', linewidth=2)
        ax.plot(t_grid, np.median(res['π_2'], axis=0), 'C1',
                label='agent 2', linewidth=2)
        ax.axhline(y=truth, color='gray', linestyle='--',
                   alpha=0.5, label=f'truth ({nature_type})')
        ax.set_title(f'Beliefs when nature = {nature_type}\n{scenario_label}')
        ax.set_ylabel(r'median $\pi^i_t$')
        ax.set_ylim([-0.05, 1.05])
        ax.legend()

        # Consumption shares and their limit
        ax = axes[row, 1]
        ax.plot(t_grid, np.median(res['c1_share'], axis=0), 'g-',
                linewidth=2, label='median')
        ax.axhline(y=c1_limit(π_0_1, π_0_2, nature_type, λ),
                   color='k', linestyle='--', alpha=0.7, label='limit')
        ax.set_title(f'Agent 1 consumption share (Nature = {nature_type})')
        ax.set_ylabel('consumption share')
        ax.set_ylim([0, 1])
        ax.legend()

        for col in range(2):
            axes[row, col].set_xlabel('$t$')

    plt.tight_layout()
    return fig, axes


def print_limits(results, π_0_scenarios, nature_type, λ=0.5):
    """Compare median final consumption shares with their limits."""
    for i, (π_0_1, π_0_2) in enumerate(π_0_scenarios):
        c1_T = np.median(results[i]['c1_share'][:, -1])
        limit = c1_limit(π_0_1, π_0_2, nature_type, λ)
        print(f"nature = {nature_type}, priors = ({π_0_1}, {π_0_2}): "
              f"median c1 at T = {c1_T:.3f}, limit = {limit:.3f}")
Now we’ll plot outcomes when nature follows \(f\):
fig_f, axes_f = plot_learning_results(results_f, π_0_scenarios, 'f', λ)
plt.show()
print_limits(results_f, π_0_scenarios, 'f', λ)
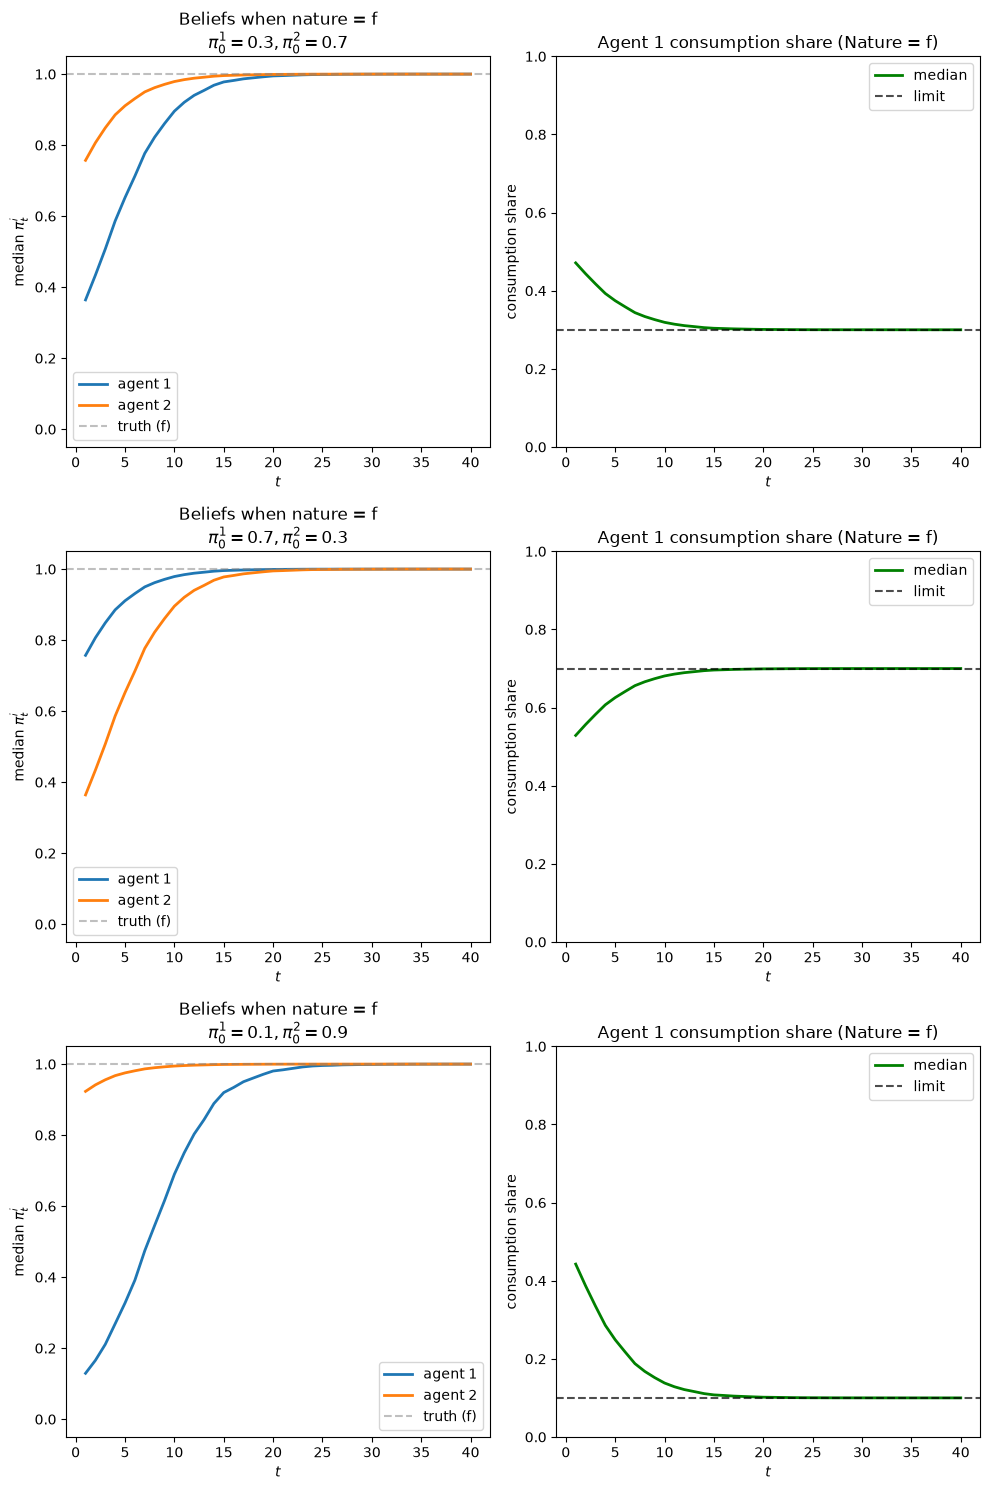
nature = f, priors = (0.3, 0.7): median c1 at T = 0.300, limit = 0.300
nature = f, priors = (0.7, 0.3): median c1 at T = 0.700, limit = 0.700
nature = f, priors = (0.1, 0.9): median c1 at T = 0.100, limit = 0.100
Agent 1’s median consumption share settles at the limit from part 1 in each scenario.
Neither agent’s consumption share goes to zero.
Both agents learn that nature draws from \(f\).
Their posterior log odds \(\log[\pi^i_t/(1-\pi^i_t)] = \log[\pi^i_0/(1-\pi^i_0)] + \log L(s^t)\) move in parallel.
The agent with the larger prior on \(f\) has the larger posterior on \(f\) at every date.
Once both agents have learned, their predictive densities agree and \(l_t\) stops moving.
The agent who puts more prior probability on the true model keeps the larger consumption share.
Now let’s plot outcomes when nature follows \(g\):
fig_g, axes_g = plot_learning_results(results_g, π_0_scenarios, 'g', λ)
plt.show()
print_limits(results_g, π_0_scenarios, 'g', λ)
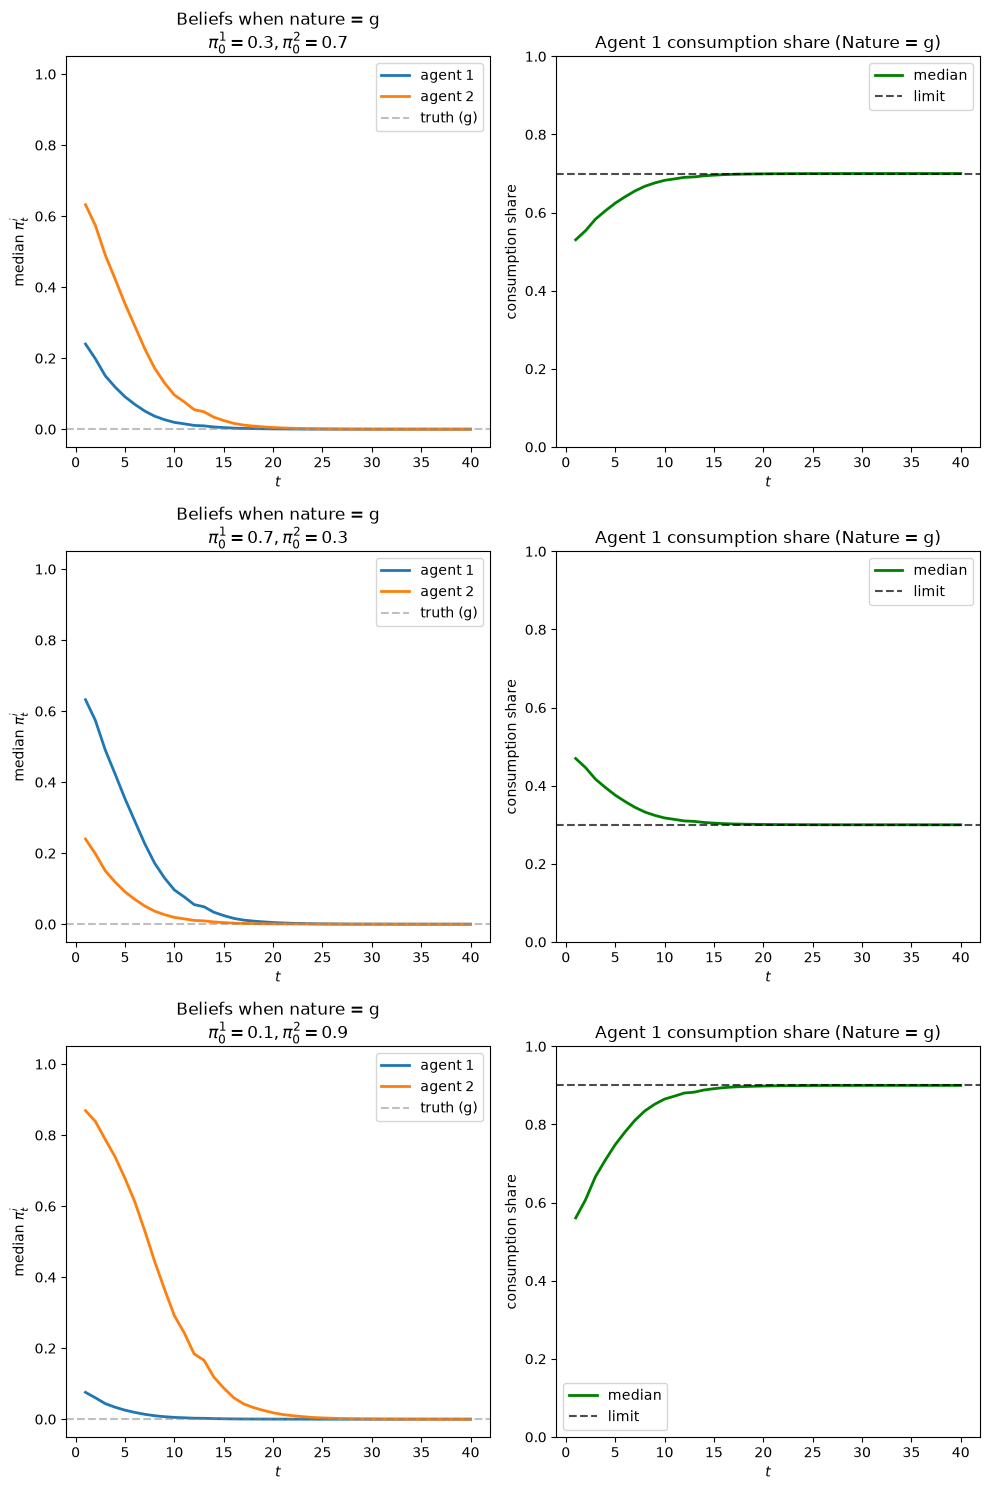
nature = g, priors = (0.3, 0.7): median c1 at T = 0.700, limit = 0.700
nature = g, priors = (0.7, 0.3): median c1 at T = 0.300, limit = 0.300
nature = g, priors = (0.1, 0.9): median c1 at T = 0.900, limit = 0.900
We observe symmetrical outcomes.
Bayesian learners who put positive prior probability on the true model all survive.
Nature’s probability law \(f(s^t)\) or \(g(s^t)\) is absolutely continuous with respect to each agent’s joint density \(m^i(s^t)\).
As Merging of Opinions: The Blackwell–Dubins Theorem explains, each agent’s predictions then merge with the truth.
Exercise 23.5
In the previous exercise, we purposefully set the two beta distributions to be relatively close to each other.
That made it challenging to distinguish the distributions.
Now let’s study outcomes when the distributions are further apart.
Let’s set \(f \sim \text{Beta}(2, 5)\) and \(g \sim \text{Beta}(5, 2)\).
Please use the Python code you have written to study outcomes.
Solution
Here is one solution
λ = 0.5
T = 40
N = 1000

rng = np.random.default_rng()

F_a, F_b = 2, 5
G_a, G_b = 5, 2

f = jit(lambda x: p(x, F_a, F_b))
g = jit(lambda x: p(x, G_a, G_b))

π_0_scenarios = [
    (0.3, 0.7),
    (0.7, 0.3),
    (0.1, 0.9),
]

s_seq_f = rng.beta(F_a, F_b, (N, T))
s_seq_g = rng.beta(G_a, G_b, (N, T))

results_f = {}
results_g = {}

for i, (π_0_1, π_0_2) in enumerate(π_0_scenarios):
    # When nature follows f
    results_f[i] = simulate_learning_blume_easley(
            s_seq_f, f, g, π_0_1, π_0_2, λ)
    # When nature follows g
    results_g[i] = simulate_learning_blume_easley(
            s_seq_g, f, g, π_0_1, π_0_2, λ)
Now let’s visualize the results
fig_f, axes_f = plot_learning_results(results_f, π_0_scenarios, 'f', λ)
plt.show()
print_limits(results_f, π_0_scenarios, 'f', λ)
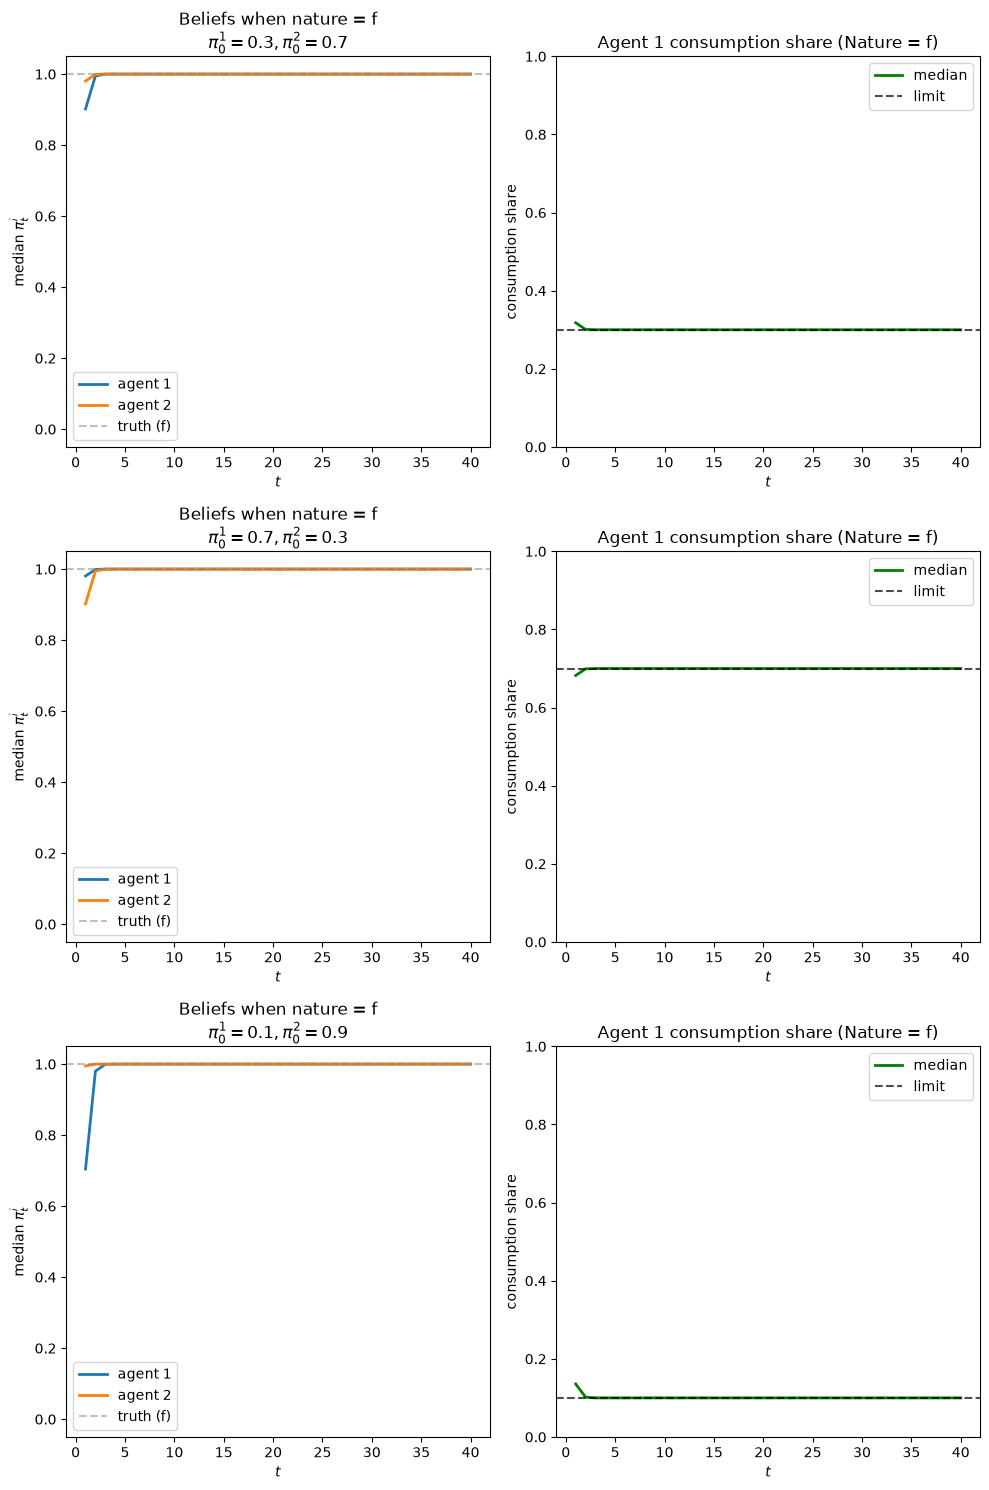
nature = f, priors = (0.3, 0.7): median c1 at T = 0.300, limit = 0.300
nature = f, priors = (0.7, 0.3): median c1 at T = 0.700, limit = 0.700
nature = f, priors = (0.1, 0.9): median c1 at T = 0.100, limit = 0.100
fig_g, axes_g = plot_learning_results(results_g, π_0_scenarios, 'g', λ)
plt.show()
print_limits(results_g, π_0_scenarios, 'g', λ)
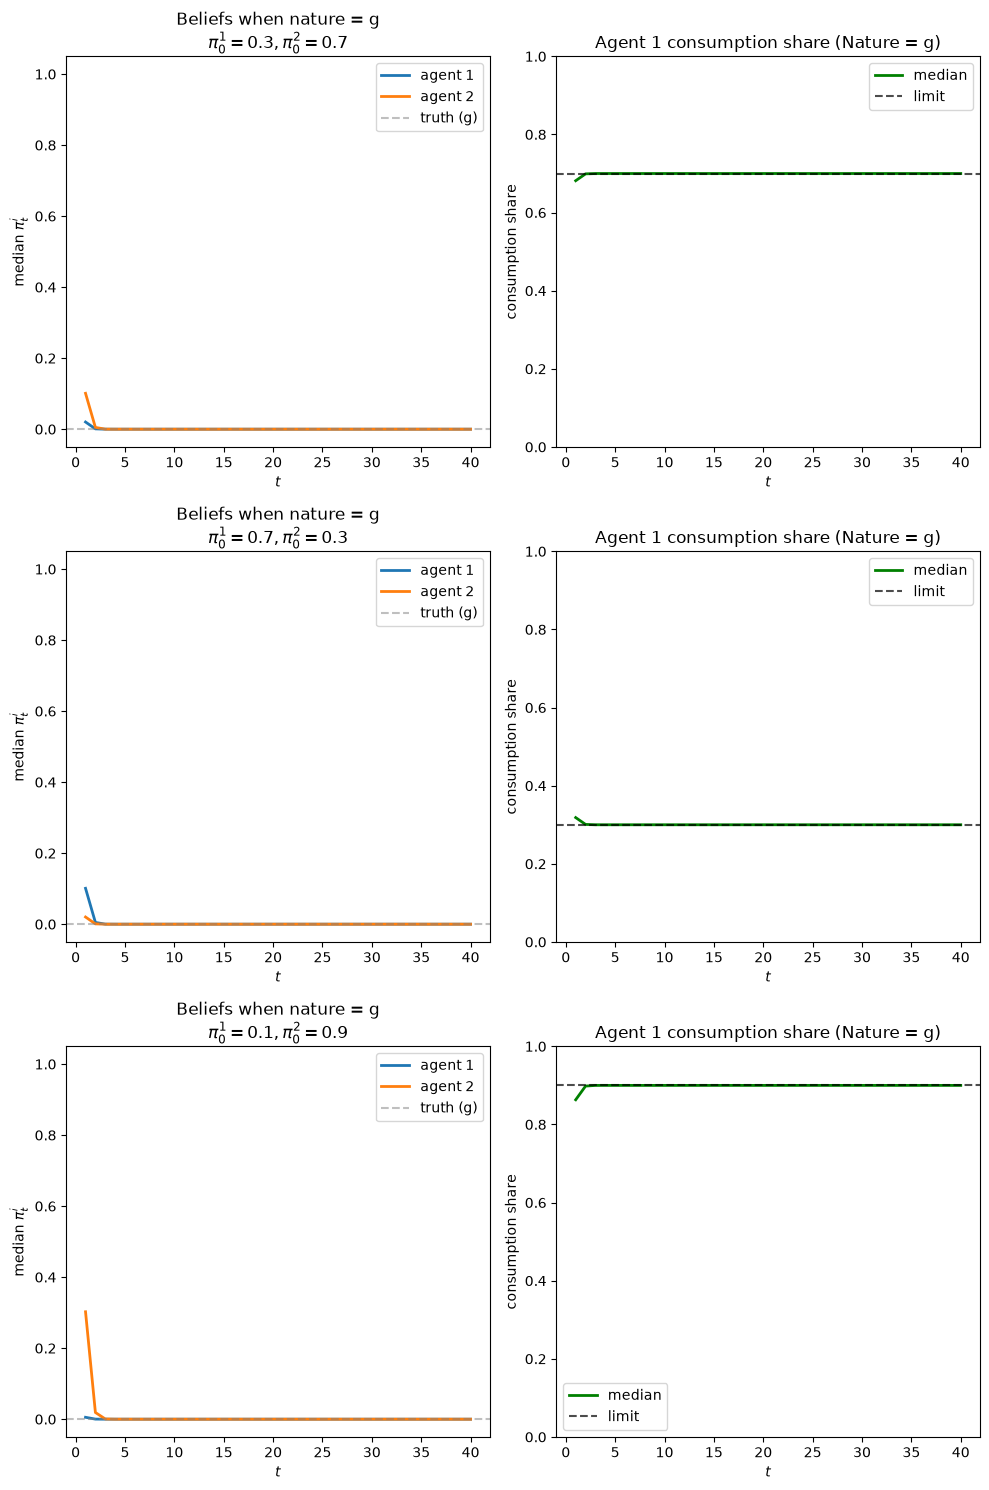
nature = g, priors = (0.3, 0.7): median c1 at T = 0.700, limit = 0.700
nature = g, priors = (0.7, 0.3): median c1 at T = 0.300, limit = 0.300
nature = g, priors = (0.1, 0.9): median c1 at T = 0.900, limit = 0.900
Evidently, because the two distributions are further apart, it is easier to distinguish them.
So learning occurs more quickly.
So does convergence of consumption shares.
The limits are the same as in Exercise 23.4 because they depend only on \(\lambda\) and the priors.
Exercise 23.6
Two agents have different beliefs about three possible models.
Assume \(f(x) \geq 0\), \(g(x) \geq 0\), and \(h(x) \geq 0\) for \(x \in X\) with:
\(\int_X f(x) dx = 1\)
\(\int_X g(x) dx = 1\)
\(\int_X h(x) dx = 1\)
Each model asserts that \(s_t\) is IID, so that \(f(s^t) = f(s_1) \cdots f(s_t)\), and similarly for \(g\) and \(h\).
Let \(\pi^{f,i}_0\), \(\pi^{g,i}_0\), and \(\pi^{h,i}_0\) be agent \(i\)’s prior probabilities on models \(f\), \(g\), and \(h\).
We’ll consider two agents:
Agent 1: \(\pi^{f,1}_0 = \pi^{g,1}_0 = 1/2\), \(\pi^{h,1}_0 = 0\) (attaches positive probability only to models \(f\) and \(g\))
Agent 2: \(\pi^{f,2}_0 = \pi^{g,2}_0 = \pi^{h,2}_0 = 1/3\) (attaches equal weights to all three models)
Let \(f\) and \(g\) be two beta distributions with \(f \sim \text{Beta}(3, 2)\) and \(g \sim \text{Beta}(2, 3)\), and set \(h = x f + (1-x) g\) with \(x = 0.5\).
Agent \(i\)’s joint density of \(s^t\) is
Bayes’ Law tells us that agent \(i\)’s posterior probabilities on models \(f\) and \(g\) are
and
Please simulate and visualize evolutions of posterior probabilities and consumption allocations when:
Nature permanently draws from \(f\)
Nature permanently draws from \(g\)
Solution
Let’s implement this three-model case with two agents having different beliefs.
Let’s define \(f\) and \(g\) far apart, with \(h\) being a mixture of \(f\) and \(g\).
F_a, F_b = 3, 2
G_a, G_b = 2, 3
λ = 0.5
x = 0.5     # weight on f in the mixture h

f = jit(lambda s: p(s, F_a, F_b))
g = jit(lambda s: p(s, G_a, G_b))
h = jit(lambda s: x * f(s) + (1 - x) * g(s))
The following function computes each agent’s joint density \(m^i(s^t)\), posterior probabilities, and agent 1’s consumption share.
It works with logarithms of joint densities to avoid overflow and underflow over long histories.
def simulate_three_model_allocation(sequences, f_func, g_func, h_func,
                                    priors_1, priors_2, λ=0.5):
    """
    Simulate the Blume-Easley model with two Bayesian agents
    whose prior probabilities on models (f, g, h) are priors_1 and priors_2.

    Column t-1 of `sequences` holds s_t.
    """
    # log f(s^t), log g(s^t), log h(s^t), with shape (3, N, T)
    log_dens = np.stack([np.cumsum(np.log(dens(sequences)), axis=1)
                         for dens in (f_func, g_func, h_func)])

    results = {}
    log_m = []
    for i, priors in enumerate((priors_1, priors_2), start=1):
        # log of prior × joint density; a zero prior gives -inf
        with np.errstate(divide='ignore'):
            log_w = np.log(np.asarray(priors))[:, None, None] + log_dens
        w_max = log_w.max(axis=0)
        log_m_i = w_max + np.log(np.exp(log_w - w_max).sum(axis=0))

        # Posterior probabilities after observing s^t
        posteriors = np.exp(log_w - log_m_i)
        for k, model in enumerate(['f', 'g', 'h']):
            results[f'π_{model}_{i}'] = posteriors[k]
        log_m.append(log_m_i)

    # log l_t = log m^1(s^t) - log m^2(s^t)
    log_l = log_m[0] - log_m[1]
    results['c1_share'] = expit(np.log(λ / (1 - λ)) + log_l)
    return results
The following code cell defines a plotting function to show evolutions of beliefs and consumption ratios
Now let’s run the simulation.
In the simulation below, agent 1 assigns positive probabilities only to \(f\) and \(g\), while agent 2 puts equal weights on all three models.
T = 100
N = 1000

rng = np.random.default_rng()

# Generate sequences for nature f and g
s_seq_f = rng.beta(F_a, F_b, (N, T))
s_seq_g = rng.beta(G_a, G_b, (N, T))

priors_1 = (0.5, 0.5, 0.0)
priors_2 = (1/3, 1/3, 1/3)

# Run simulations
results_f = simulate_three_model_allocation(s_seq_f, f, g, h,
                                            priors_1, priors_2, λ)
results_g = simulate_three_model_allocation(s_seq_g, f, g, h,
                                            priors_1, priors_2, λ)
Plots below show the evolution of beliefs for each model (f, g, h) separately.
First we show the figure when nature chooses \(f\)
plot_belief_evolution(results_f, nature='f', figsize=(15, 5))
plt.show()
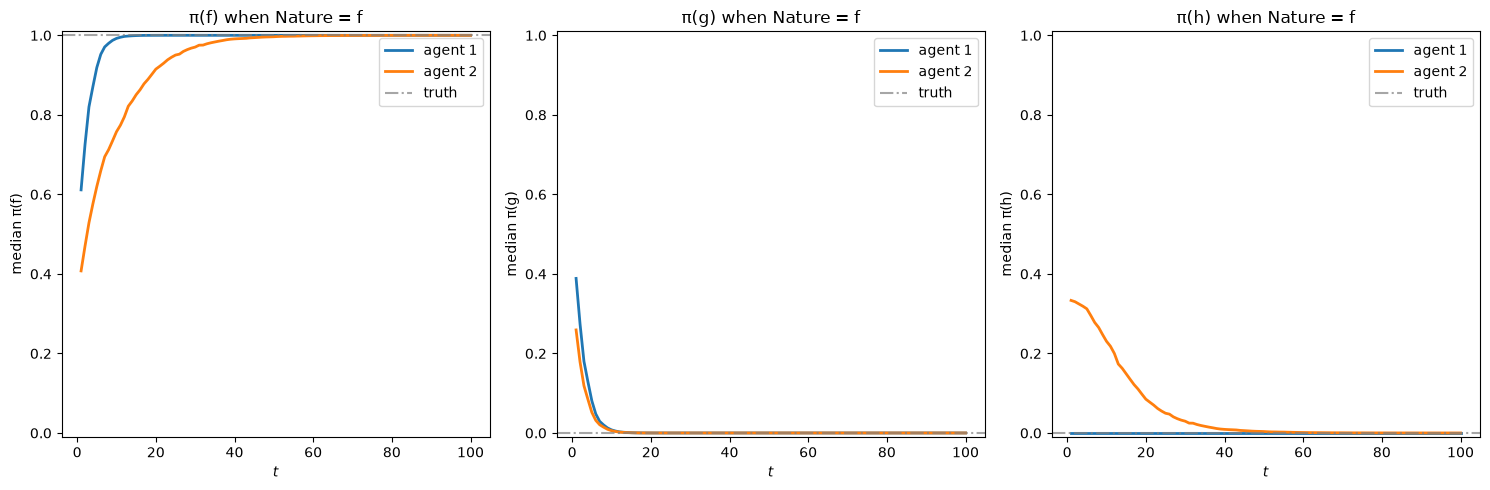
Agent 1’s posterior beliefs are depicted in blue and agent 2’s posterior beliefs are depicted in orange.
Evidently, when nature draws from \(f\), agent 1 learns faster than agent 2, who, unlike agent 1, attaches a positive prior probability to model \(h\):
In the leftmost panel, both agents’ beliefs for \(\pi(f)\) converge toward 1 (the truth)
Agent 2’s belief in model \(h\) (rightmost panel) equals \(1/3\) after the first draw and then falls toward 0
Agent 2’s posterior on \(h\) after one draw is \(h(s_1)/[f(s_1) + g(s_1) + h(s_1)] = 1/3\) because \(f + g = 2h\).
Now let’s plot the belief evolution when nature chooses \(g\):
plot_belief_evolution(results_g, nature='g', figsize=(15, 5))
plt.show()
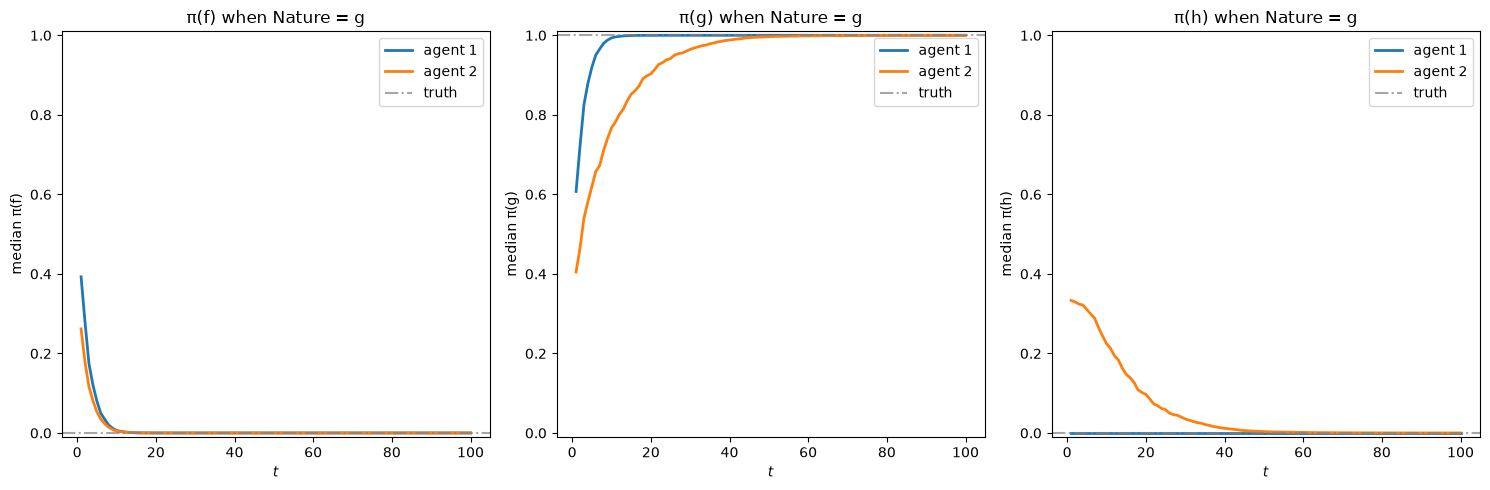
Again, agent 1 learns faster than agent 2.
Before reading the next figure, please guess how consumption shares evolve.
Remember that agent 1 reaches the correct model faster than agent 2
c1_lim = λ * priors_1[0] / (λ * priors_1[0] + (1 - λ) * priors_2[0])
plot_consumption_dynamics(results_f, results_g, λ=0.5,
                          c1_limits=(c1_lim, c1_lim), figsize=(14, 5))
plt.show()

for name, res in [('f', results_f), ('g', results_g)]:
    print(f"nature = {name}: median c1 at T = "
          f"{np.median(res['c1_share'][:, -1]):.3f}, limit = {c1_lim:.3f}")
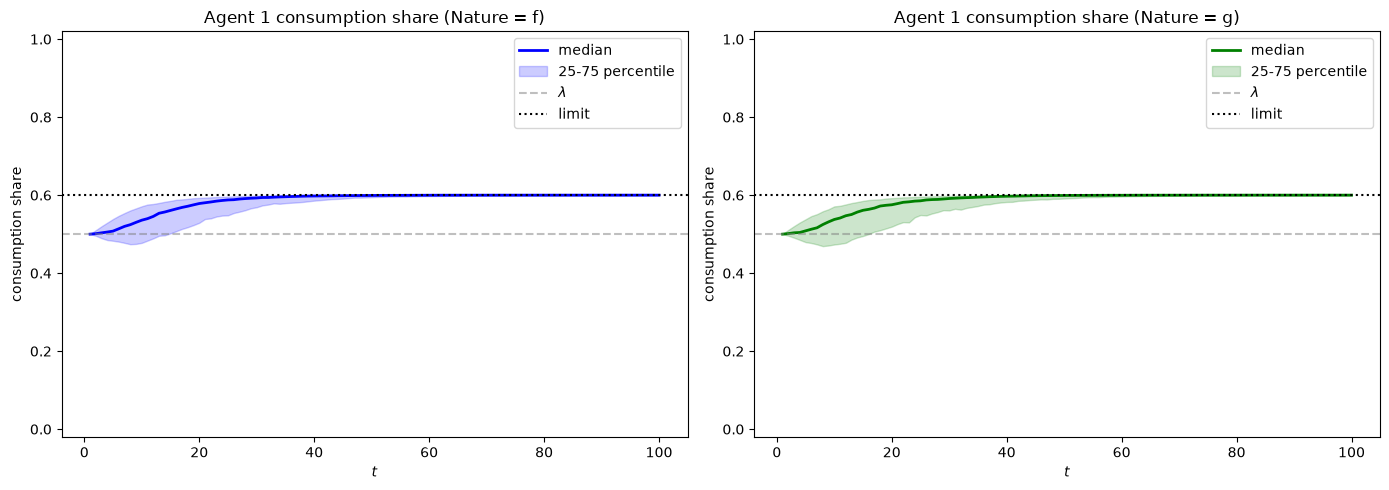
nature = f: median c1 at T = 0.600, limit = 0.600
nature = g: median c1 at T = 0.600, limit = 0.600
As we expected, agent 1 has a higher consumption share compared to agent 2.
In this exercise, the “truth” is among possible outcomes according to both agents.
Agent 2’s model is “more general” because it allows a possibility – that nature is drawing from \(h\) – that agent 1’s model does not include.
When nature draws from \(f\), \(g(s^t)/f(s^t) \rightarrow 0\) and \(h(s^t)/f(s^t) \rightarrow 0\), so \(m^i(s^t)/f(s^t) \rightarrow \pi^{f,i}_0\).
The likelihood ratio \(l_t\) converges to \(\pi^{f,1}_0/\pi^{f,2}_0 = (1/2)/(1/3) = 1.5\), and agent 1’s consumption share converges to \(0.5 \times 1.5/(0.5 \times 1.5 + 0.5) = 0.6\).
The same limit prevails when nature draws from \(g\).
Both agents survive.
Agent 1’s limiting share exceeds agent 2’s because agent 1 puts prior probability \(1/2\) on the true model while agent 2 puts \(1/3\).
Agent 2 pays for model \(h\) with prior probability taken from the true model.
Exercise 23.7
Now consider two agents with extreme priors about three models.
Consider the same setup as the previous exercise, but now:
Agent 1: \(\pi^{f,1}_0 = \pi^{g,1}_0 = \frac{\epsilon}{2} > 0\) and \(\pi^{h,1}_0 = 1 - \epsilon\), where \(\epsilon\) is close to \(0\) (e.g., \(\epsilon = 0.01\))
Agent 2: \(\pi^{f,2}_0 = \pi^{g,2}_0 = 0\) and \(\pi^{h,2}_0 = 1\) (rigid belief in model \(h\))
Set \(f \sim \text{Beta}(1, 1)\), \(g \sim \text{Beta}(3, 1.2)\), and \(h \sim \text{Beta}(1.2, 1.1)\).
Model \(h\) is close to \(f\) and far from \(g\) as measured by KL divergence.
Please simulate and visualize evolutions of posterior probabilities and consumption allocations when:
Nature permanently draws from \(f\)
Nature permanently draws from \(g\)
Solution
To explore this exercise, we increase \(T\) to 1000.
Let’s specify \(f, g\), and \(h\) and verify that \(h\) and \(f\) are closer than \(h\) and \(g\)
F_a, F_b = 1, 1
G_a, G_b = 3, 1.2
H_a, H_b = 1.2, 1.1

f = jit(lambda x: p(x, F_a, F_b))
g = jit(lambda x: p(x, G_a, G_b))
h = jit(lambda x: p(x, H_a, H_b))

Kh_f = compute_KL(h, f)
Kh_g = compute_KL(h, g)
Kf_h = compute_KL(f, h)
Kg_h = compute_KL(g, h)

print(f"KL divergences:")
print(f"KL(h,f) = {Kh_f:.4f}, KL(h,g) = {Kh_g:.4f}")
print(f"KL(f,h) = {Kf_h:.4f}, KL(g,h) = {Kg_h:.4f}")
KL divergences:
KL(h,f) = 0.0092, KL(h,g) = 0.5514
KL(f,h) = 0.0105, KL(g,h) = 0.2919
Now we can set the belief models for the two agents
ε = 0.01
λ = 0.5

# Agent 1: π_f = ε/2, π_g = ε/2, π_h = 1-ε
# (almost rigid about h)
priors_1 = (ε/2, ε/2, 1 - ε)

# Agent 2: π_f = 0, π_g = 0, π_h = 1
# (fully rigid about h)
priors_2 = (0.0, 0.0, 1.0)
Now we can run the simulation
T = 1000
N = 1000

rng = np.random.default_rng()

# Generate sequences for different nature scenarios
s_seq_f = rng.beta(F_a, F_b, (N, T))
s_seq_g = rng.beta(G_a, G_b, (N, T))

# Run simulations for both scenarios
results_f = simulate_three_model_allocation(s_seq_f, f, g, h,
                                            priors_1, priors_2, λ)
results_g = simulate_three_model_allocation(s_seq_g, f, g, h,
                                            priors_1, priors_2, λ)
Let’s plot the belief evolution when nature chooses \(f\)
plot_belief_evolution(results_f, nature='f', figsize=(15, 5))
plt.show()
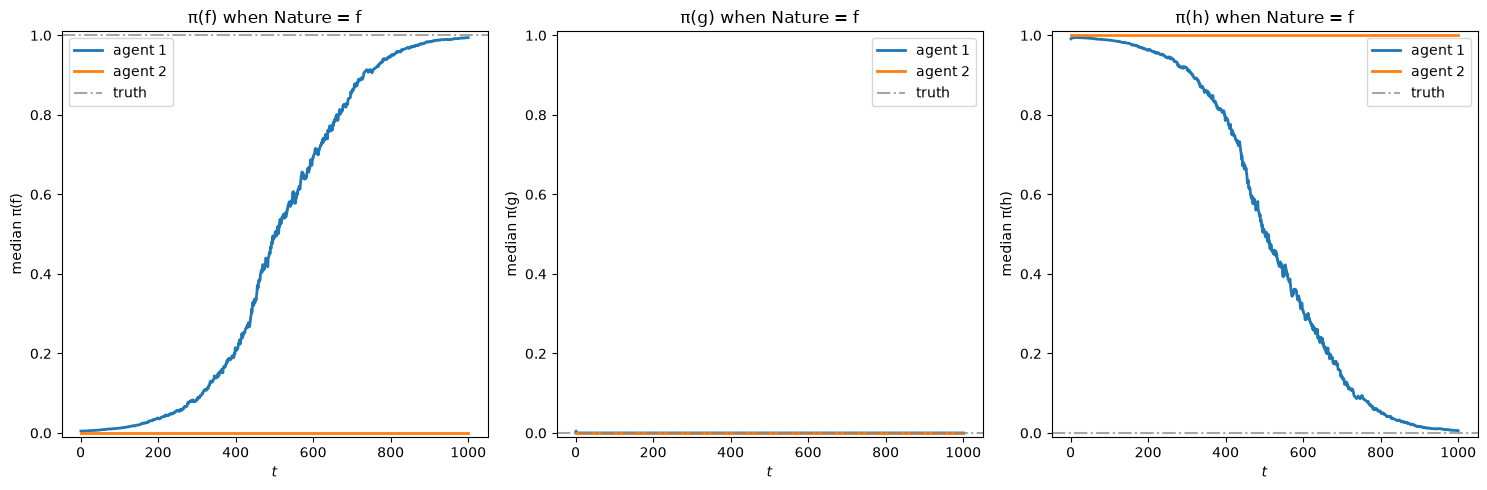
Agent 1 learns the truth slowly in the leftmost panel showing \(\pi(f)\).
Agent 2 does not update at all.
Bayes’ law cannot revise a prior probability of zero, so agent 2’s posterior probability on \(h\) stays at \(1\) whatever the data.
Agent 2’s dogmatic prior keeps it from learning.
The closeness of \(h\) to \(f\) sets only how long agent 1 takes to overcome its own small prior on \(f\).
Agent 1’s posterior on \(f\) reaches \(1/2\) roughly when \(\log[f(s^t)/h(s^t)]\) reaches \(\log[2(1-\epsilon)/\epsilon]\).
When nature draws from \(f\), \(\log[f(s^t)/h(s^t)]\) grows at rate \(KL(f,h)\) per period.
The following code computes the implied waiting times, along with the waiting times for a nearly dogmatic agent who puts prior probability \(10^{-10}\) on each of \(f\) and \(g\).
def first_crossing(post, level=0.5):
    """First date at which the median posterior exceeds level."""
    above = np.where(np.median(post, axis=0) > level)[0]
    return above[0] + 1 if above.size > 0 else None

for nature, K in [('f', Kf_h), ('g', Kg_h)]:
    print(f"nature = {nature}: log(2(1-ε)/ε)/KL = {np.log(2*(1-ε)/ε)/K:.0f}, "
          f"log(1e10)/KL = {np.log(1e10)/K:.0f}")

print("first t with median π(f) of agent 1 > 1/2 when nature = f:",
      first_crossing(results_f['π_f_1']))
print("first t with median π(g) of agent 1 > 1/2 when nature = g:",
      first_crossing(results_g['π_g_1']))
nature = f: log(2(1-ε)/ε)/KL = 502, log(1e10)/KL = 2186
nature = g: log(2(1-ε)/ε)/KL = 18, log(1e10)/KL = 79
first t with median π(f) of agent 1 > 1/2 when nature = f: 502
first t with median π(g) of agent 1 > 1/2 when nature = g: 18
Agent 1 needs about 500 periods to put probability \(1/2\) on \(f\) when nature draws from \(f\).
A nearly dogmatic agent 2 would need about 2200 periods.
Now let’s plot the belief evolution when nature chooses \(g\)
plot_belief_evolution(results_g, nature='g', figsize=(15, 5))
plt.show()
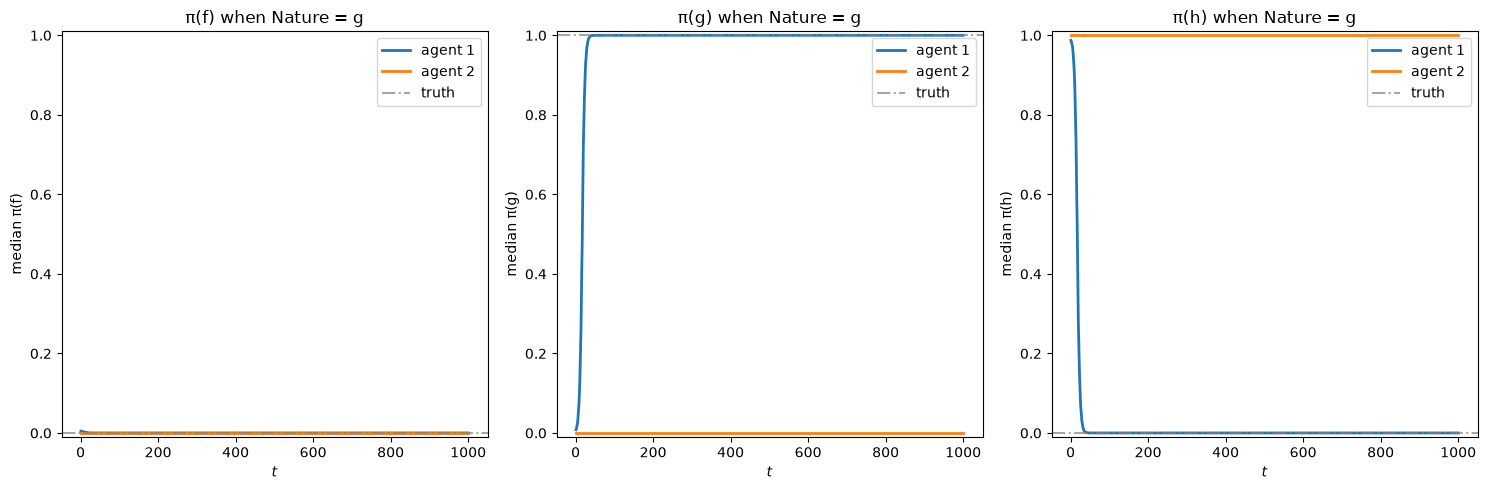
When nature draws from \(g\), \(KL(g,h) = 0.2919\) is much larger than \(KL(f,h) = 0.0105\).
Agent 1 puts probability \(1/2\) on \(g\) after about 18 periods.
Agent 2 again does not update.
A nearly dogmatic agent 2 would need about 79 periods.
plot_consumption_dynamics(results_f, results_g, λ=0.5,
                          c1_limits=(1.0, 1.0), figsize=(14, 5))
plt.show()
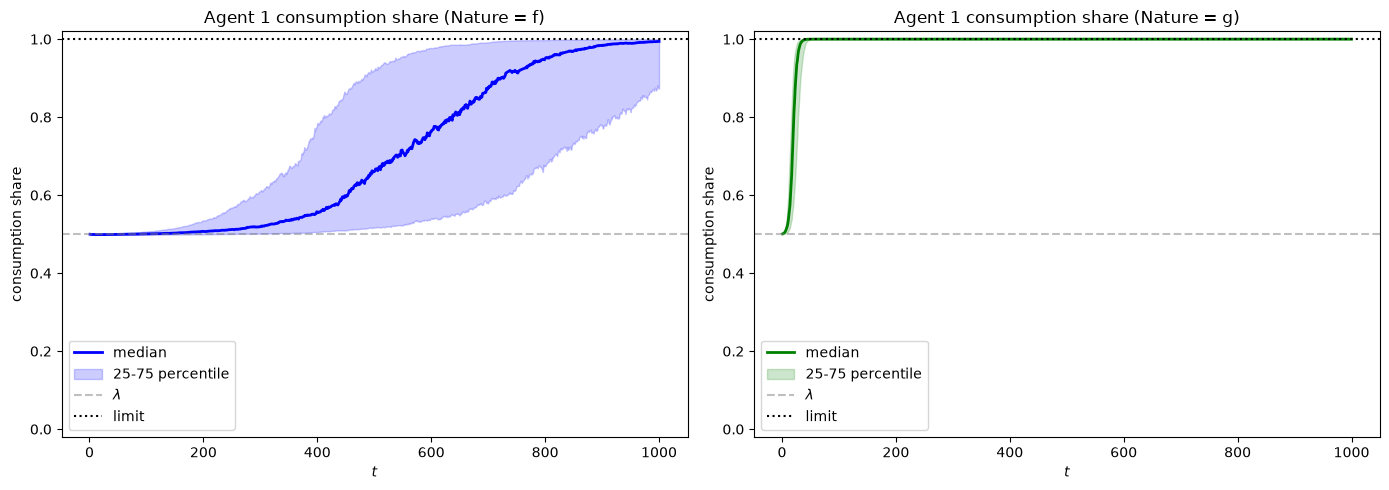
Agent 1’s consumption share converges to \(1\) both when nature permanently draws from \(f\) and when nature permanently draws from \(g\).
Agent 2’s probability law over infinite histories puts probability zero on a set of histories that has probability one when nature draws from \(f\), and likewise for \(g\).
Nature’s probability law is not absolutely continuous with respect to agent 2’s, and agent 2’s predictions never merge with the truth (see Merging of Opinions: The Blackwell–Dubins Theorem).
The likelihood ratio \(l_t = m^1(s^t)/h(s^t)\) eventually grows at rate \(KL(f,h)\) when nature draws from \(f\) and at rate \(KL(g,h)\) when nature draws from \(g\).
A nearly dogmatic agent 2 with prior probability \(10^{-10}\) on each of \(f\) and \(g\) would eventually learn the truth and survive.
Its limiting consumption share would be \((1-\lambda) 10^{-10}/[\lambda \epsilon/2 + (1-\lambda) 10^{-10}] \approx 2 \times 10^{-8}\).
23.6. Social planner’s allocation problem#
The benevolent dictator has all the information it requires to choose a consumption allocation that maximizes the social welfare criterion
where \(\lambda \in [0,1]\) is a Pareto weight that tells how much the planner likes agent \(1\) and \(1 - \lambda\) is a Pareto weight that tells how much the social planner likes agent \(2\).
Setting \(\lambda = .5\) expresses “egalitarian” social preferences.
Notice how social welfare criterion (23.3) takes into account both agents’ preferences as represented by formula (23.2).
This means that the social planner knows and respects
each agent’s one period utility function \(u(\cdot) = \ln(\cdot)\)
each agent \(i\)’s probability model \(\{\pi_t^i(s^t)\}_{t=0}^\infty\)
Consequently, it is natural to anticipate that these objects will appear in the social planner’s rule for allocating the aggregate endowment each period.
Let \(\theta_t(s^t)\) be a Lagrange multiplier on feasibility constraint (23.1) at history \(s^t\).
First-order necessary conditions for maximizing welfare criterion (23.3) subject to the feasibility constraint (23.1) are
Dividing the second condition by the first gives
which can be rearranged to become
where
is the likelihood ratio of agent 1’s joint density to agent 2’s joint density.
The cumulative likelihood ratio \(l_t(s^t)\) is the counterpart of \(L_t\) in the review above, with \(f = \pi^1\), \(g = \pi^2\), and histories that start at date \(0\).
The one-period likelihood ratio is \(\pi^1(s_t)/\pi^2(s_t)\).
Using
we can rewrite allocation rule (23.5) as
or
which implies that the social planner’s allocation rule is
If we define a temporary or continuation Pareto weight process as
then we can represent the social planner’s allocation rule as
and of course
Substituting \(c_t^1(s^t) = \lambda_t(s^t)\) into the first condition in (23.4) gives
The multiplier \(\theta_t(s^t)\) is the planner’s shadow price of one unit of consumption at date \(t\) after history \(s^t\), measured in units of social welfare \(W\).