92. Learning, Approximation, and Equilibrium Computation#
In addition to what’s in Anaconda, this lecture will need the following libraries:
!pip install quantecon
92.1. Overview#
In Adaptive Agents in an Overlapping Generations Monetary Economy a system of adaptive agents found a rational expectations equilibrium it was never told about.
The agents there learned a separate saving rate for each level of the government deficit — a non-parametric rule, one number per state.
That works when there are two states.
It runs into two walls otherwise, both noted in Sargent [1993]:
a state that occurs rarely is learned about slowly, because its observations arrive slowly;
when the number of states is large — and especially when the state is continuous — one parameter per state is hopeless.
The econometrician’s response is to impose a parametric form on the decision rule, \(s = f(G, \theta)\), with \(\theta\) of low dimension, and use every observation to estimate \(\theta\).
This lecture works through what that buys and what it costs.
The costs and benefits are two sides of one idea.
A parametric family can be learned quickly because every observation informs every state.
But a learning scheme confined to a family of functions can converge to a rational expectations equilibrium only if some member of the family supports one.
Otherwise the best it can reach is an approximate equilibrium.
Working this out surfaces a theme that runs through the whole bounded-rationality program: algorithms that model learning and algorithms that compute equilibria resemble each other.
Marcet’s method of parameterized expectations [den Haan and Marcet, 1990, Marcet and Marshall, 1992] is a standard tool for computing rational expectations equilibria.
Written recursively, it becomes a model of adaptive agents learning in real time.
An equilibrium computation is a centralized learning algorithm run by the modeller; a learning economy is a decentralized equilibrium computation run by the agents.
The two are different recursions, but they share their fixed points and, through a differential equation that both of them track, their stability condition.
The plan:
Put a deficit that takes many values — a fine discretization of a continuous process — into the overlapping generations model of Adaptive Agents in an Overlapping Generations Monetary Economy, turning the equilibrium condition into a functional equation in the saving rule \(f(G)\).
Compute a benchmark solution, so we have ground truth to measure against.
Solve it by parameterized expectations with families of increasing richness, and watch approximate equilibria give way to the exact one.
Show that the recursive, real-time version of the same algorithm is a learning economy, and that one eigenvalue of the \(T\) map sets how fast it learns.
Learn the saving rule non-parametrically with a kernel estimator, and weigh the trade-off against the parametric route.
Let’s start with some imports.
import warnings
import numpy as np
import pandas as pd
import quantecon as qe
import matplotlib.pyplot as plt
92.2. A continuous-state functional equation#
We keep the overlapping generations monetary economy of Adaptive Agents in an Overlapping Generations Monetary Economy — two-period lived agents, log utility, endowments \(w_1\) when young and \(w_2\) when old, currency the only store of value, and a government financing a deficit by printing money.
We also keep the calibration of Part 1 of that lecture: \(w_1 = 20\), \(w_2 = 10\) and \(N = 1\).
The one change: the deficit \(G_t\) now follows a continuous Markov process, with transition kernel \(F(G', G) = \operatorname{Prob}\{G_{t+1} \leq G' \mid G_t = G\}\).
We look for a stationary equilibrium in which saving is a function of the current deficit, \(s_t = f(G_t)\).
The household’s first-order condition, evaluated at \(s_t = f(G_t)\), is
and the government budget constraint with market clearing gives the return on currency in terms of the saving rule, exactly as before (with \(N = 1\)),
Substituting \(R_t\), and using \(f(G_t) R_t = f(G_{t+1}) - G_{t+1}\) for old-age consumption, turns the first-order condition into a functional equation in \(f\):
Because \(f(G_t)\) is known at \(t\), it pulls out of the expectation, whatever the utility function.
Writing
equation (92.1) becomes \(u'(w_1 - f(G_t)) = \psi(G_t)/f(G_t)\).
Under log utility, \(u'(c) = 1/c\), and this can be solved for saving in closed form:
So the whole problem reduces to finding the conditional expectation \(\psi(G)\): once we have it, the saving rule follows in closed form.
That observation is the hinge of the entire lecture.
Every method below — parametric or not — is a way of estimating the one object \(\psi(G)\).
Under log utility the random variable inside (92.2) is \(y = (s' - G')/(w_2 + s' - G')\), where \(s'\) and \(G'\) are next period’s saving and deficit.
We will call it the regressand, for reasons that will soon be clear.
w1, w2 = 20.0, 10.0

def s_from_psi(ψ):
    "Recover the saving rule from the conditional expectation ψ."
    return w1 * ψ / (1 + ψ)

def regressand(s, G):
    "u'(c_2) (s - G) under log utility, at saving s and deficit G."
    return (s - G) / (w2 + s - G)
92.2.1. The deficit process#
We take \(\log G_t\) to follow an AR(1), \(\log G_{t+1} = (1-\rho)\log \bar G + \rho \log G_t + \sigma \varepsilon_{t+1}\).
To compute with it we replace it by a fine Markov chain, discretizing it on 201 grid points with the method of Tauchen [1986].
From here on that chain is the economy: the benchmark below is computed on it, and every learning economy is simulated from it.
Using one chain for both keeps the comparison honest.
If the learners lived in the AR(1) while the benchmark was computed on the chain, even a learner that solved its own economy perfectly would miss the benchmark, and the miss would be blamed on the learner.
With 201 states the chain is a close stand-in for the continuous process.
It is also exactly the case that defeats a state-by-state learner like those of Adaptive Agents in an Overlapping Generations Monetary Economy: such a learner would need 201 separate saving rates, and the rarest states are visited only about once every two thousand periods.
ρ, σ, G_bar = 0.7, 0.30, 0.6
n_states = 201

mc = qe.tauchen(n_states, ρ, σ, mu=np.log(G_bar) * (1 - ρ), n_std=2.5)
G, P = np.exp(mc.state_values), mc.P
ergodic = mc.stationary_distributions[0]      # where the deficit spends its time

def simulate_deficit(T, seed=0, P=P):
    "State indices of a simulated path of the deficit chain, started from its ergodic distribution."
    rng = np.random.default_rng(seed)
    chain = qe.MarkovChain(P)
    init = rng.choice(len(P), p=chain.stationary_distributions[0])
    return chain.simulate_indices(T, init=init, random_state=rng)

G_perm = (np.sqrt(w1) - np.sqrt(w2))**2 / 2   # largest deficit that can be financed forever

print(f"deficit grid: {n_states} points from {G.min():.3f} to {G.max():.3f}")
print(f"mean deficit E[G] under the ergodic distribution: {ergodic @ G:.3f}")
print(f"probability of the least-visited state: {ergodic.min():.1e}")
print(f"largest constant deficit with a monetary steady state: {G_perm:.3f}")
print(f"top of the grid relative to it: {G.max() / G_perm:.2f}")
print(f"share of time the deficit is above it: {ergodic[G > G_perm].sum():.2f}")
deficit grid: 201 points from 0.210 to 1.715
mean deficit E[G] under the ergodic distribution: 0.653
probability of the least-visited state: 4.4e-04
largest constant deficit with a monetary steady state: 0.858
top of the grid relative to it: 2.00
share of time the deficit is above it: 0.19
How large a deficit can this economy finance?
With a deficit held constant at \(G\), a monetary steady state solves a quadratic (Exercise 92.2) that has real roots only if \(G \leq (\sqrt{w_1} - \sqrt{w_2})^2/2 \approx 0.858\).
The top of our grid is twice that, and the deficit spends about a fifth of its time above it.
A monetary equilibrium nevertheless exists at every state, because high deficits are transitory.
With \(\rho = 0.7\), a young agent in a high-deficit state expects the deficit, and with it the inflation tax on his saving, to fall back toward its mean.
92.3. A benchmark solution#
To measure any learning scheme, we first need the true \(f(G)\).
On the grid, (92.1) is a system of 201 equations, which we solve by iterating the perceived-to-actual map, precisely the \(T\) map of A Peculiar Definition of Bounded Rationality.
Guess a saving rule; use it on the right-hand side to compute the actual saving each state would call forth; repeat until the two agree.
On the chain the right-hand side is a matrix–vector product, \(\psi = P y\) with \(y_j = (s_j - G_j)/(w_2 + s_j - G_j)\), and the closed form then delivers the new saving rule.
This is a form of the time iteration of Optimal Savings IV: Time Iteration, and the damping weight on the new guess plays the role of the relaxation parameter \(\lambda\) of A Peculiar Definition of Bounded Rationality.
def T_map(s):
    "Actual saving rule called forth by a perceived rule s (one entry per state)."
    return s_from_psi(P @ regressand(s, G))

def solve_benchmark(damp=0.5, tol=1e-12, max_iter=5000):
    "Fixed point of the perceived-to-actual saving map on the deficit grid."
    s = np.full(n_states, (w1 - w2) / 2)
    for it in range(1, max_iter + 1):
        s_new = T_map(s)
        if np.max(np.abs(s_new - s)) < tol:
            return s_new, it
        s = damp * s_new + (1 - damp) * s
    warnings.warn("the benchmark iteration did not converge")
    return s, it


s_benchmark, iters = solve_benchmark()
print(f"converged in {iters} iterations")


def foc_residual(s_rule):
    "Max |first-order-condition error| of a saving rule under the true kernel P."
    return np.max(np.abs(1 / (w1 - s_rule) - (P @ regressand(s_rule, G)) / s_rule))


print(f"benchmark FOC residual: {foc_residual(s_benchmark):.2e}")
print(f"saving rule f(G) runs from {s_benchmark.max():.3f} (low deficit) "
      f"to {s_benchmark.min():.3f} (high deficit)")
converged in 223 iterations
benchmark FOC residual: 1.70e-14
saving rule f(G) runs from 4.471 (low deficit) to 2.840 (high deficit)
Here is the rule.
fig, ax = plt.subplots(figsize=(6.5, 4))
ax.plot(G, s_benchmark, 'k-', lw=2)
ax.set_xlabel("deficit $G$")
ax.set_ylabel("saving $f(G)$")
plt.show()
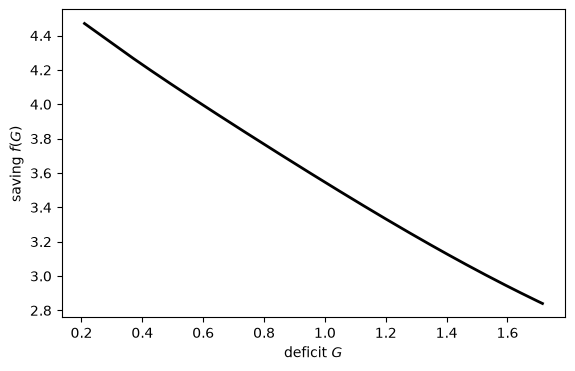
Fig. 92.1 Benchmark equilibrium saving rule#
Saving falls as the deficit rises: a larger deficit means faster money creation, a poorer return on currency, and less saving.
The rule is gently curved, which will matter in a moment.
This \(f(G)\) is the object no adaptive agent gets to see.
Everything below tries to recover it.
92.3.1. Which equilibrium?#
Sargent [1993] notes that systems like (92.1) generally have more than one solution.
Our iteration started from \(s = 5\), the saving rate of an economy with no deficit, and found a high-saving, low-inflation solution.
It would find the same solution from any nearby start, because the solution is stable under the \(T\) map: every eigenvalue of the map’s Jacobian there is less than one.
def jacobian(f, x, eps=1e-6):
    "Numerical Jacobian of the map f at the point x."
    return np.column_stack([(f(x + eps * e) - f(x - eps * e)) / (2 * eps)
                            for e in np.eye(len(x))])

eig_benchmark = np.linalg.eigvals(jacobian(T_map, s_benchmark))
print(f"largest |imaginary part|: {np.abs(eig_benchmark.imag).max():.1e}")
print("largest eigenvalues of DT at the benchmark:",
      np.sort(eig_benchmark.real)[::-1][:4].round(3))
largest |imaginary part|: 3.0e-09
largest eigenvalues of DT at the benchmark: [0.773 0.542 0.353 0.208]
That is the E-stability condition of One recursion, many learners: the condition under which learners whose beliefs are pulled toward the \(T\) map’s output settle on an equilibrium.
The economy with a constant deficit makes the point sharply.
It has two steady states, and at the high-inflation one the slope of the \(T\) map exceeds one (Exercise 92.2), so neither the iteration nor a learner can settle there.
That is the computational face of the stability reversal in The stability reversal, where least squares learners select the low-inflation steady state.
The largest eigenvalue printed above, about 0.77, will come back: it sets the speed of the algorithms below.
92.4. Parameterized expectations#
Marcet’s method of parameterized expectations [den Haan and Marcet, 1990, Marcet and Marshall, 1992] attacks (92.1) by putting a parametric form on the conditional expectation \(\psi(G)\) from (92.2),
where \(\phi(G)\) is a vector of basis functions and \(\theta\) a short vector of coefficients.
The algorithm is a fixed-point iteration on \(\theta\):
Given \(\theta\), the saving rule is \(f(G) = w_1 \psi(G,\theta) / (1 + \psi(G,\theta))\).
Simulate a long path of the deficit and compute the implied saving each period.
Form the realized value of the object inside (92.2), \(y_t = u'(w_2 + s_{t+1} - G_{t+1})(s_{t+1} - G_{t+1})\), and regress it on \(\phi(G_t)\) to get a new \(\theta\).
Iterate to convergence.
The regression in step 3 is doing the work of the conditional expectation: least squares projects the realized \(y_t\) onto functions of the current state, which is exactly what \(\mathbb{E}_t[\cdot \mid G_t]\) is.
We use monomials in a rescaled \(\log G\) as the basis, and vary the degree.
Every algorithm in this lecture starts from the same initial belief, \(\psi = 1/3\), under which agents save \(s = 5\), as they would if there were no deficit.
The functions take the deficit levels, the transition matrix, and the basis evaluated at each state as arguments, so that they can be reused on other economies.
Because the regressors do not change from one pass to the next, we evaluate the basis on the grid, and invert the regressor matrix, only once.
def basis(G_vals, degree):
    "Monomials in log-deficit rescaled to [-1, 1]."
    x = 2 * (np.log(G_vals) - np.log(G.min())) / (np.log(G.max()) - np.log(G.min())) - 1
    return np.vstack([x**k for k in range(degree + 1)]).T

ψ_init = 1 / 3                     # the belief under which agents save s = 5

def θ_init(k):
    "Initial coefficients: a constant ψ = ψ_init."
    θ = np.zeros(k)
    θ[0] = ψ_init
    return θ

def rule(Φ, θ, G=G):
    "Saving rule at each state implied by coefficients θ, kept feasible."
    ψ = np.clip(Φ @ θ, 0.05, 50)
    return np.clip(s_from_psi(ψ), G + 0.05, w1 - 0.05)

def errors(s_rule):
    "Sup-norm and ergodic-weighted RMS distance from the benchmark."
    d = s_rule - s_benchmark
    return np.max(np.abs(d)), np.sqrt(ergodic @ d**2)

def parameterized_expectations(Φ, G=G, P=P, T=150_000, seed=0,
                               damp=0.6, tol=1e-11, max_iter=1000):
    """
    Batch parameterized expectations.  Φ holds the basis functions evaluated
    at each deficit state, one row per state.  Returns the implied saving rule
    at each state, the coefficients and the number of passes.
    """
    idx = simulate_deficit(T + 1, seed, P)
    X = Φ[idx[:-1]]                          # regressors φ(G_t) along the history
    X_pinv = np.linalg.pinv(X)               # they never change, so invert once
    θ = θ_init(Φ.shape[1])
    for it in range(1, max_iter + 1):
        y = regressand(rule(Φ, θ, G), G)[idx[1:]]     # realized y_t
        θ_new = X_pinv @ y                            # regress y_t on φ(G_t)
        if np.max(np.abs(θ_new - θ)) < tol:
            return rule(Φ, θ_new, G), θ_new, it
        θ = (1 - damp) * θ + damp * θ_new
    warnings.warn("parameterized expectations did not converge")
    return rule(Φ, θ, G), θ, it
92.4.1. Approximate versus exact equilibria#
Now run it for families of increasing richness: a constant \(\psi\) (saving independent of the deficit), a linear one, and a quadratic one.
pea = {deg: parameterized_expectations(basis(G, deg)) for deg in (0, 1, 2)}
rules = {deg: pea[deg][0] for deg in pea}

fig, ax = plt.subplots(figsize=(7, 4.5))
ax.plot(G, s_benchmark, 'k-', lw=2.2, label="benchmark $f(G)$")
labels = {0: "degree 0 (constant)", 1: "degree 1 (linear)", 2: "degree 2 (quadratic)"}
for deg, colour in [(0, 'C0'), (1, 'C1'), (2, 'C2')]:
    ax.plot(G, rules[deg], '--', color=colour, lw=1.4, label=labels[deg])
ax.set_xlabel("deficit $G$")
ax.set_ylabel("saving $s$")
ax.legend(frameon=False)
plt.show()
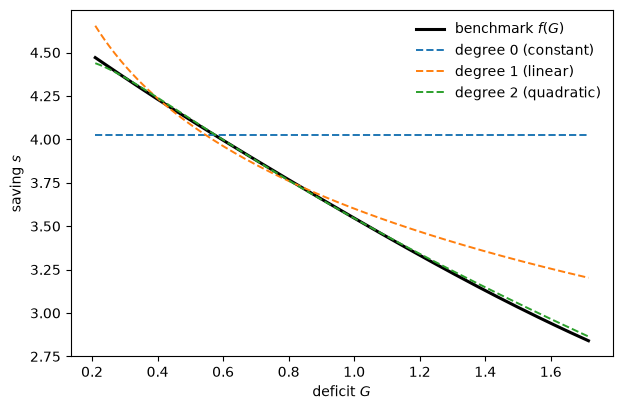
Fig. 92.2 Parameterized expectations rules of increasing degree#
The constant family cannot represent a saving rule that depends on the deficit at all, so the best it can do is a flat line through the middle of the data.
That flat line is an approximate equilibrium — a fixed point of the learning scheme — but it satisfies the first-order condition only on average, not state by state.
In the language of Optimal Misspecified Beliefs it is an equilibrium under forecast misspecification: the functional form is wrong, but the coefficient within it is the best that the data the agents themselves generate allow.
The linear family does much better, but it misses at the extremes: its rule lies above the benchmark at both ends of the deficit range and below it in the middle.
The quadratic family is almost indistinguishable from the benchmark: \(\psi\) is very nearly a quadratic function of \(\log G\), the variable our basis is built on, so a three-parameter rule essentially nails it.
We can quantify “how close” two ways: by the distance to the benchmark, and by the residual in the first-order condition under the true kernel, the honest measure of how far an approximate equilibrium is from an exact one.
rows = []
for deg in (0, 1, 2):
    s_hat, _, passes = pea[deg]
    rows.append([labels[deg], *errors(s_hat), foc_residual(s_hat), passes])

pd.DataFrame(rows, columns=["family", "sup $|s - f|$", "ergodic RMS",
                            "FOC residual", "passes"]).set_index("family").round(4)
| sup $|s - f|$ | ergodic RMS | FOC residual | passes | |
|---|---|---|---|---|
| family | ||||
| degree 0 (constant) | 1.1825 | 0.3212 | 0.0090 | 115 |
| degree 1 (linear) | 0.3626 | 0.0683 | 0.0039 | 135 |
| degree 2 (quadratic) | 0.0322 | 0.0073 | 0.0005 | 142 |
Every error column falls as the family grows richer.
The first-order-condition residual — the quantity that is exactly zero at a rational expectations equilibrium and positive at an approximate one — drops by more than an order of magnitude from the constant family to the quadratic.
Marcet and Marshall [1992] give conditions under which this is no accident: as the family grows, the approximate equilibria computed by parameterized expectations converge to the rational expectations equilibrium.
The last column counts the passes the algorithm needed to converge: well over a hundred, for a reason we will come to.
Note
Richer is not always better with finite data.
The approximation error keeps falling as the degree rises, but the sampling error in the regression does not, and beyond the quadratic it takes over.
The extra terms then chase sampling noise in the tails of the deficit distribution, where observations are scarce: the ergodic-weighted error levels off, and the sup-norm error can tick back up, by an amount that depends on the simulated history.
That is the same phenomenon as the slowly-learned rare state in Adaptive Agents in an Overlapping Generations Monetary Economy, seen from the approximation side: a scheme fits well where the data is, and the cost of misfitting a rarely-visited region is small in terms of expected utility.
Exercise 92.1 separates the two sources of error.
92.5. Learning is equilibrium computation#
So far parameterized expectations is an algorithm we run to compute an equilibrium.
Now comes the point of the whole lecture.
Write the same algorithm recursively — updating \(\theta\) once per period as a single new observation arrives, rather than re-regressing a whole simulated history — and it becomes a model of adaptive agents learning in real time.
The recursive form is ordinary recursive least squares:
where \(y_t\) is the same realized regressand as before, \(M_t\) estimates the second-moment matrix of the regressors, and the gain \(\gamma_t\) declines like \(1/t\).
In the code below, \(\gamma_t = 1/(t+1)\), and \(M\) starts at a small multiple of the identity so that it can be inverted from the first period on.
This is a stochastic-approximation recursion with a decreasing gain, the same family as the Robbins–Monro learners of Adaptive Agents in an Overlapping Generations Monetary Economy, with \(M\) in the role of their curvature estimate.
It differs from their scheme in two ways, not one.
What is learned. The agents of Adaptive Agents in an Overlapping Generations Monetary Economy learn a saving rate directly, taking Newton steps on realized lifetime utility. An agent’s lifetime utility is known only when he is old, so the population there is split into odd and even classes that take turns. The agents here instead learn a conditional expectation, \(\psi\), and solve their own Euler equation given it — what Sargent [1993] calls learning via model formation, as opposed to learning the hard way. Each period’s realized regressand is known one period later, as soon as the next generation has saved, so no odd/even split is needed.
How far an observation reaches. \(\theta\) indexes a parametric rule, so a single observation updates the saving rule at every state at once, not just at the state that was visited.
Here is the learning economy.
def online_pea(Φ, G=G, P=P, T=500_000, seed=0, ridge=1e-3, a=1.0):
    """
    Recursive-least-squares parameterized expectations: the learning economy.

    The young at t save according to the current θ.  Their saving reveals the
    date t-1 realized regressand, and θ and the moment matrix M are updated
    once, with gain a / (t + a).  Returns the path of θ.
    """
    idx = simulate_deficit(T, seed, P)
    k = Φ.shape[1]
    θ, M = θ_init(k), ridge * np.eye(k)
    θ_path = np.empty((T, k))
    θ_path[0] = θ
    for t in range(1, T):
        g, x = G[idx[t]], Φ[idx[t - 1]]
        ψ = min(max(Φ[idx[t]] @ θ, 0.05), 50.0)
        s = min(max(s_from_psi(ψ), g + 0.05), w1 - 0.05)    # date-t saving
        y = regressand(s, g)                                 # date t-1's y, now known
        γ = a / (t + a)
        M += γ * (np.outer(x, x) - M)
        θ = θ + γ * np.linalg.solve(M, x * (y - x @ θ))
        θ_path[t] = θ
    return θ_path


Φ2 = basis(G, 2)
θ_path = online_pea(Φ2)
s_online = rule(Φ2, θ_path[-1])
print("online PEA after {:,} periods: sup error = {:.4f},  ergodic RMS = {:.4f}"
      .format(len(θ_path), *errors(s_online)))
online PEA after 500,000 periods: sup error = 0.0673, ergodic RMS = 0.0224
How should we judge that?
The learner’s target is not the benchmark but the approximate equilibrium of the quadratic family, the fixed point that the batch algorithm computes.
We can compute that target exactly, as a batch pass with infinitely much data would.
Let \(T(\theta)\) be the coefficients of the population least squares projection of \(y_t\) on \(\phi(G_t)\) when agents’ beliefs are \(\theta\).
This is the \(T\) map of A Peculiar Definition of Bounded Rationality for beliefs confined to the family, and on the chain we can evaluate it exactly, using \(P\) for the conditional expectation and the ergodic distribution for the projection.
def T_pea(θ, Φ, G=G, P=P, π=ergodic):
    "Population version of one batch pass: project E[y_t | G_t] on the basis."
    Ey = P @ regressand(rule(Φ, θ, G), G)
    return np.linalg.solve(Φ.T @ (π[:, None] * Φ), Φ.T @ (π * Ey))

def approximate_equilibrium(Φ, G=G, P=P, π=ergodic, damp=0.6, tol=1e-13, max_iter=10_000):
    "Fixed point θ* of the T map of the family with basis Φ."
    θ = θ_init(Φ.shape[1])
    for _ in range(max_iter):
        θ_new = T_pea(θ, Φ, G, P, π)
        if np.max(np.abs(θ_new - θ)) < tol:
            return θ_new
        θ = (1 - damp) * θ + damp * θ_new
    warnings.warn("approximate_equilibrium did not converge")
    return θ


θ_star = approximate_equilibrium(Φ2)
s_star = rule(Φ2, θ_star)
eig_pea = np.sort(np.linalg.eigvals(jacobian(lambda θ: T_pea(θ, Φ2), θ_star)).real)[::-1]
λ_max = eig_pea[0]

print("θ* (approximate equilibrium):", θ_star.round(4))
print("θ  (online, final)          :", θ_path[-1].round(4))
print("θ  (batch, T = 150,000)     :", pea[2][1].round(4))
print("approximate equilibrium: sup error = {:.4f},  ergodic RMS = {:.4f}"
      .format(*errors(s_star)))
print("eigenvalues of DT(θ*):", eig_pea.round(3))
θ* (approximate equilibrium): [ 0.2495 -0.059  -0.0232]
θ  (online, final)          : [ 0.251  -0.0579 -0.023 ]
θ  (batch, T = 150,000)     : [ 0.2498 -0.059  -0.0236]
approximate equilibrium: sup error = 0.0307,  ergodic RMS = 0.0070
eigenvalues of DT(θ*): [0.772 0.538 0.34 ]
The eigenvalues of \(DT(\theta^*)\) are all below one, and they are close to the three largest eigenvalues of the benchmark’s \(T\) map computed earlier: the quadratic family inherits the benchmark’s slow directions.
Here is the learning economy at work.
fig, axes = plt.subplots(1, 2, figsize=(11, 4.2))

t_grid = np.arange(1, len(θ_path) + 1)
for j in range(3):
    axes[0].plot(t_grid, θ_path[:, j], color=f'C{j}', lw=2, label=rf"$\theta_{j}$")
    axes[0].axhline(θ_star[j], color=f'C{j}', lw=0.8, ls=':')
axes[0].set_xscale('log')
axes[0].set_xlabel("$t$  (log scale)")
axes[0].set_ylabel(r"$\theta_t$")
axes[0].set_title(r"coefficients learned in real time ($\theta^*$ dotted)")
axes[0].legend(frameon=False, fontsize=9)

axes[1].plot(G, s_benchmark, 'k-', lw=2.2, label="benchmark $f(G)$")
axes[1].plot(G, s_star, 'C2:', lw=2, label="approximate equilibrium")
axes[1].plot(G, s_online, 'C3--', lw=1.5, label="online PEA")
axes[1].set_xlabel("deficit $G$")
axes[1].set_ylabel("saving $s$")
axes[1].set_title("saving rule after learning")
axes[1].legend(frameon=False)
plt.tight_layout()
plt.show()
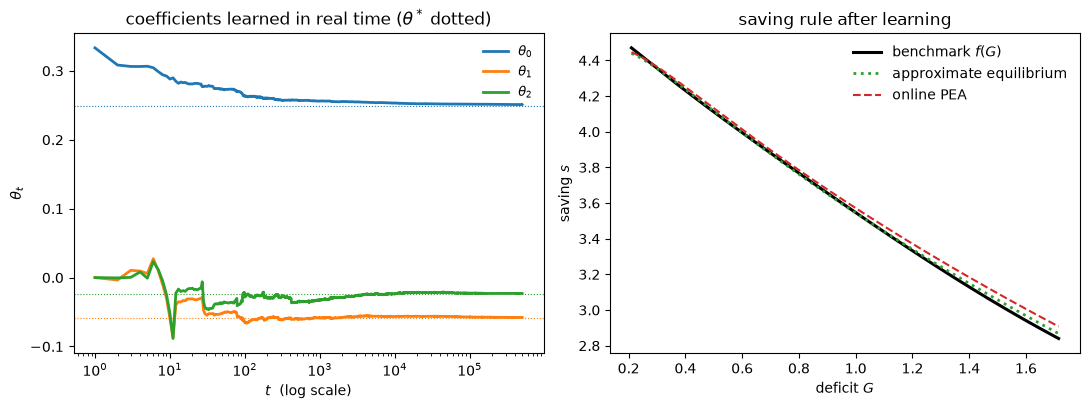
Fig. 92.3 Online learning of the saving rule#
The coefficients head for \(\theta^*\), but slowly: after half a million periods the online rule still lies visibly above the approximate equilibrium at high deficits, and it misses the benchmark by more than the batch rule does.
92.5.1. Same limit, different speeds#
Why do the two algorithms share a limit, and why is the online one so slow?
A batch pass with damping \(\delta = 0.6\) is \(\theta_k = \theta_{k-1} + \delta\,[\hat T(\theta_{k-1}) - \theta_{k-1}]\), where \(\hat T\) is the sample version of \(T\).
That is the relaxation scheme of A Peculiar Definition of Bounded Rationality, with \(\delta\) in the role of its relaxation parameter \(\lambda\).
The online recursion (92.3) is a stochastic approximation algorithm.
The theory of such algorithms [Ljung, 1977, Marcet and Sargent, 1989, Woodford, 1990], later systematized and generalized by Evans and Honkapohja [2001], says that with a gain like \(1/t\) the beliefs \(\theta_t\) follow, on average, the ordinary differential equation
in the rescaled time \(\tau = \log t\), while \(M_t\) settles down to the second-moment matrix of the regressors.
One recursion, many learners sets out the general argument, and Least Squares Learning in Self-Referential Models works it through for linear models; Sargent [1993] illustrates it with the very economy of this lecture.
Three consequences follow.
Same fixed points. The rest points of (92.4) are the fixed points of \(T\), which the batch algorithm computes up to sampling error. Both schemes aim at the same approximate equilibrium \(\theta^*\).
Same stability condition. Both converge to \(\theta^*\) only if every eigenvalue of \(DT(\theta^*)\) has real part below one, the E-stability condition. For the online algorithm this is the stability of (92.4). For the batch algorithm, the eigenvalues of its iteration matrix \(I + \delta\,(DT - I)\) lie inside the unit circle only if this condition holds, and, for small enough \(\delta\), whenever it does.
Different speeds. Near \(\theta^*\), a batch pass shrinks the error by the factor \(1 - \delta(1 - \lambda_{\max})\), where \(\lambda_{\max}\) is the largest eigenvalue of \(DT(\theta^*)\). The differential equation shrinks it like \(e^{-(1-\lambda_{\max})\tau}\), which is \(t^{-(1-\lambda_{\max})}\) in calendar time.
δ = 0.6
print(f"largest eigenvalue of DT(θ*):         {λ_max:.3f}")
print(f"batch: error shrinks per pass by      {1 - δ * (1 - λ_max):.3f}")
print(f"online: error shrinks like            t^(-{1 - λ_max:.2f})")
print(f"500 times more data shrinks it by     {500**(1 - λ_max):.1f}")
largest eigenvalue of DT(θ*):         0.772
batch: error shrinks per pass by      0.863
online: error shrinks like            t^(-0.23)
500 times more data shrinks it by     4.1
So a batch pass cuts the error by only about 14 percent, which is why the batch algorithm needed well over a hundred passes.
The online error falls only like \(t^{-0.23}\).
That is slower than the \(t^{-1/2}\) rate at which sampling noise averages out, so it is the drift toward \(\theta^*\), not the noise, that dominates the error.
Sargent [1993], drawing on Benveniste et al. [1990], states the condition for the usual \(\sqrt{t}\) rate: every eigenvalue of \(DT - I\) must lie below \(-1/2\), that is, \(\lambda_{\max} < 1/2\), which fails here.
At that rate, multiplying the agents’ experience by 500, from 1,000 to 500,000 periods, would cut their error only by a factor of about four.
Exercise 92.5 checks the rate.
The gap in speed measures the difference between an agent constrained to learn from experience as it arrives and a modeller free to re-use a whole simulated history at once.
But the limit is the same object.
Sargent’s summary:
Learning algorithms and equilibrium computation algorithms look like each other. Equilibrium computation algorithms often have interpretations as centralized learning algorithms whereby the model builder, acting in a role of ‘social planner,’ gropes for a set of pricing functions for markets and decision rules for agents that will satisfy all of the individual optimum conditions and market-clearing conditions. We have also seen that learning systems with boundedly rational agents sometimes have interpretations as decentralized equilibrium computation algorithms.
This is why, as Sargent [1993] remarks, it is understandable that Marcet arrived at parameterized expectations as a computational method by way of earlier work on the dynamics of least squares learning [Marcet and Sargent, 1989].
The two are not one recursion read in two directions.
They are two recursions that share their fixed points and, through (92.4), their stability condition; what separates them is speed, and what each asks of whoever runs it.
92.6. Learning without a functional form#
The parametric route is fast but stakes everything on the family.
If no member of \(\{f(\cdot, \theta)\}\) supports an equilibrium, the scheme converges to an approximate equilibrium and stops.
The non-parametric alternative imposes no functional form.
Following the recursive kernel estimators of Chen and White [1998], an agent estimates the conditional expectation \(\psi(G)\) directly from a kernel-weighted average of past realized values, letting the data choose the shape.
The building block is the recursive kernel density estimator, itself a stochastic-approximation recursion,
where \(x \in \mathbb{R}^d\), \(K\) is a probability density such as the standard normal, and the bandwidth \(h_t \searrow 0\).
The factor \(h_t^{-d}\) makes each term a density; without it, as the formula is printed in Sargent [1993], the estimate would shrink to zero along with the bandwidth.
Our agents need a conditional expectation rather than a density.
The ratio of two recursions of this kind gives the recursive Nadaraya–Watson estimator
where \(K_h(u) = h^{-1} K(u/h)\) and distance is measured in \(\log G\).
It has the same shape as every other recursion in this lecture, now with a separate gain at each state: large when the deficit lands near \(G\), and essentially zero when it lands far away.
Hold the bandwidth fixed at \(h\) and shrink it on a grid, and the gain becomes familiar.
As \(h \to 0\), \(K_h(\log G - \log G_t)/K_h(0)\) tends to one if \(G_t = G\) and to zero otherwise.
The denominator then counts the visits to state \(G\), and \(\gamma_t(G) = 1/\tau_G\) when the deficit is at \(G\), where \(\tau_G\) is the number of visits so far, and zero otherwise.
That is the state-by-state \(1/\tau\) clock of the Robbins–Monro learners of Adaptive Agents in an Overlapping Generations Monetary Economy, the book’s “different clock for each event”.
A positive bandwidth lets a visit to one state also advance the clocks of its neighbours: \(h\) measures how far the learner generalizes from the states it has seen to the states it has not.
What we implement below is the batch counterpart of (92.5): a Nadaraya–Watson estimate of \(\psi(G)\) with a fixed bandwidth, formed as a kernel-weighted average of the realized regressand over a whole simulated history, and iterated to a fixed point.
With a fixed bandwidth and fixed data, the recursion reproduces the batch estimate exactly.
In a learning economy the data are not fixed, because the \(y_t\) depend on the rule being learned, so the recursive and batch versions are related as (92.3) is to the batch algorithm of Parameterized expectations: different recursions with the same fixed points.
Because the simulated deficit lives on the grid, the kernel-weighted sum over the history can be computed state by state, from how often each state was visited and the sum of the \(y_t\) that followed those visits.
The fixed-point iteration converges slowly, at a rate set by essentially the same eigenvalue as before, so we allow it many passes and warn if it has not converged.
def kernel_smoother(T=150_000, seed=0, h=0.06, damp=0.5, tol=1e-8, max_iter=2000):
    """
    Non-parametric parameterized expectations.  ψ(G) is estimated by a
    Nadaraya-Watson smoother of the realized regressand -- no functional form.
    The rule is iterated to a self-consistent fixed point.  Returns the saving
    rule at each state and the number of passes.
    """
    idx = simulate_deficit(T, seed)
    log_G = np.log(G)
    K = np.exp(-0.5 * ((log_G[:, None] - log_G[None, :]) / h)**2)   # weight of state j at i
    visits = np.bincount(idx[:-1], minlength=n_states)

    s_grid = np.full(n_states, (w1 - w2) / 2)
    for it in range(1, max_iter + 1):
        y = regressand(s_grid, G)[idx[1:]]                           # realized y_t
        y_sums = np.bincount(idx[:-1], weights=y, minlength=n_states)
        ψ = (K @ y_sums) / (K @ visits)          # kernel-weighted average over the history
        s_new = np.clip(s_from_psi(ψ), G + 0.05, w1 - 0.05)
        if np.max(np.abs(s_new - s_grid)) < tol:
            return s_new, it
        s_grid = damp * s_new + (1 - damp) * s_grid
    warnings.warn(f"kernel_smoother did not converge in {max_iter} passes")
    return s_grid, it


s_kernel, passes = kernel_smoother()
print(f"converged in {passes} passes")
print("kernel smoother: sup error = {:.4f},  ergodic RMS = {:.4f}".format(*errors(s_kernel)))
converged in 140 passes
kernel smoother: sup error = 0.0828,  ergodic RMS = 0.0203
The smoother needs well over a hundred passes, for the same reason as the batch parameterized expectations algorithm.
fig, ax = plt.subplots(figsize=(6.5, 4.2))
ax.plot(G, s_benchmark, 'k-', lw=2.2, label="benchmark $f(G)$")
ax.plot(G, s_kernel, 'C3o', ms=4, markevery=5, label="kernel smoother")
ax.set_xlabel("deficit $G$")
ax.set_ylabel("saving $s$")
ax.legend(frameon=False)
plt.show()
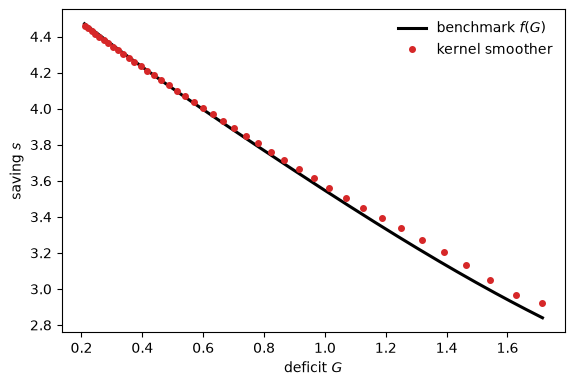
Fig. 92.4 Kernel smoother approximation to the saving rule#
With no functional form imposed, the kernel learner recovers the benchmark well.
On this history it does less well than the quadratic rule fitted to the same data: both of its error measures are between two and three times as large.
The size of the gap varies from one simulated history to another, because a kernel estimate is noisier than a three-parameter fit, but much of the kernel’s error here is systematic.
It grows toward the top of the deficit range, where the kernel overstates saving.
There the rule is steep, and most of the observations inside the kernel’s window come from lower deficits, which are visited more often and call forth more saving; at the very top of the grid all of them do.
The quadratic family does so well because the true \(\psi\) happens to be almost exactly quadratic in \(\log G\), so the parametric family we chose was very nearly correct.
Exercise 92.3 shows that a better choice of bandwidth closes most of the gap — but choosing it took knowledge of the benchmark, which no learner has.
When the family is not nearly correct, the two part ways, and the trade-off is the one familiar from econometrics:
the parametric scheme learns fast and extrapolates gracefully, but is only as good as its family; a poorly chosen family delivers an approximate equilibrium and no warning;
the non-parametric scheme cannot be led astray by a bad functional form, but pays for its flexibility with slower learning and with bias where the data is thin, at the edges of the deficit’s range, where the kernel has few neighbours to average.
Both are recursions of the same shape.
Which one an adaptive agent should use is, once again, one of the modelling choices that the bounded-rationality program forces into the open and that rational expectations quietly made for us.
92.7. Concluding remarks#
The overlapping generations model gave us a clean laboratory for a general lesson.
An adaptive agent in an environment with a large or continuous state cannot learn a separate response for every contingency.
It must generalize, imposing some structure that lets a finite amount of experience inform behavior across the whole state space.
Whether that structure is a low-order polynomial, a kernel bandwidth, or something else is a modelling choice with real consequences: it fixes whether the achievable limit is a rational expectations equilibrium or merely an approximation to one.
That same act of generalization is what makes learning and equilibrium computation two faces of one object.
Marcet’s algorithm computes an equilibrium by parameterizing an expectation and regressing; an adaptive agent learns by parameterizing an expectation and regressing.
The two recursions are not identical, but they share their fixed points and their stability condition, and one eigenvalue of the \(T\) map sets how fast each of them converges.
The next lecture, Exchange Rate Indeterminacy, Learning, and Experiments, puts the two-currency economy of A Peculiar Definition of Bounded Rationality into this overlapping generations setting, where learners must cope with an exchange rate that rational expectations leaves undetermined.
The generalization problem in its sharpest form waits for Networks, Genetic Algorithms, and Classifier Systems and Money as a Medium of Exchange among Artificially Intelligent Agents.
There the state and action spaces are large enough that enumerating rules is out of the question, and agents must discover a compact set of good rules from scratch, using John Holland’s genetic algorithm and classifier systems in place of the least squares and kernel machinery of this lecture.
92.8. Exercises#
Exercise 92.1
The note above claimed that pushing the polynomial degree too high stops helping, because high-order terms chase sampling noise in the sparsely visited tails of the deficit distribution.
Check it, separating the two sources of error.
For degrees \(0\) through \(5\), compute the population approximate equilibrium, the fixed point of the family’s \(T\) map with infinitely much data, as
approximate_equilibriumdoes. Its distance from the benchmark is pure approximation error.For the same degrees, run the batch parameterized-expectations algorithm on three simulated histories of length 150,000.
Report two error measures against the benchmark: the sup norm over the whole grid, and the RMS error weighted by the ergodic distribution of the deficit (i.e. weighted by where agents actually operate).
How does each measure behave as the degree rises, with and without sampling error?
Interpret.
Solution
seeds = (0, 1, 2)
sup_rows, rms_rows = [], []
for deg in range(6):
    Φ = basis(G, deg)
    sup_pop, rms_pop = errors(rule(Φ, approximate_equilibrium(Φ)))
    sups, rmss = [sup_pop], [rms_pop]
    for seed in seeds:
        sup, rms = errors(parameterized_expectations(Φ, seed=seed)[0])
        sups.append(sup)
        rmss.append(rms)
    sup_rows.append(sups)
    rms_rows.append(rmss)

cols = ["population"] + [f"history {seed}" for seed in seeds]
table = pd.concat({"sup error (whole grid)": pd.DataFrame(sup_rows, columns=cols),
                   "ergodic RMS (where agents live)": pd.DataFrame(rms_rows, columns=cols)},
                  axis=1)
table.index.name = "degree"
table.round(4)
| sup error (whole grid) | ergodic RMS (where agents live) | |||||||
|---|---|---|---|---|---|---|---|---|
| population | history 0 | history 1 | history 2 | population | history 0 | history 1 | history 2 | |
| degree | ||||||||
| 0 | 1.1793 | 1.1825 | 1.1795 | 1.1766 | 0.3204 | 0.3212 | 0.3205 | 0.3198 |
| 1 | 0.3595 | 0.3626 | 0.3518 | 0.3414 | 0.0677 | 0.0683 | 0.0668 | 0.0657 |
| 2 | 0.0307 | 0.0322 | 0.0333 | 0.0431 | 0.0070 | 0.0073 | 0.0075 | 0.0116 |
| 3 | 0.0176 | 0.0170 | 0.0513 | 0.0882 | 0.0020 | 0.0030 | 0.0062 | 0.0128 |
| 4 | 0.0095 | 0.0060 | 0.0517 | 0.0815 | 0.0014 | 0.0027 | 0.0063 | 0.0126 |
| 5 | 0.0020 | 0.0038 | 0.0507 | 0.0705 | 0.0004 | 0.0025 | 0.0062 | 0.0124 |
With infinitely much data, both measures fall steadily as the degree rises: adding terms to a polynomial in \(\log G\) shrinks the approximation error, which by degree 5 is tiny.
With 150,000 observations, the errors fall steeply up to the quadratic, as in the population.
Beyond it the sample errors stop tracking the population errors: the ergodic-weighted errors stay above the population values on every history, and from degree 4 on the gap is about as large as the remaining approximation error, or larger.
The ergodic-weighted error levels off, at a level that differs from one history to another.
The sup-norm error behaves less regularly: on one history it keeps falling, while on the other two it rises at degree 3 and stays above its degree-2 value.
The high-order polynomials fit the center well but are free to move at the ends of the grid, where the ergodic distribution puts little mass and the regression has few data to discipline them.
This is the approximation-side image of the rare-state problem from Adaptive Agents in an Overlapping Generations Monetary Economy.
A learning scheme allocates its accuracy to where the observations are.
Misfitting a rarely-visited region shows up starkly in the sup norm but costs almost nothing in expected utility, which is why the ergodic-weighted measure is the economically relevant one.
Exercise 92.2
The constant family (degree 0) delivers an approximate equilibrium: a single saving rate, independent of the deficit, that satisfies the first-order condition only on average.
There is a natural benchmark for it.
Compute the single saving rate \(\bar s\) that a degree-0 parameterized-expectations agent converges to, and compare it with the saving rate of the economy in which the deficit is fixed forever at its mean \(\mathbb{E}[G]\).
That fixed-deficit economy has two steady states.
Find both, compute the slope of its \(T\) map at each, and say which one belongs in the comparison.
Are \(\bar s\) and the fixed-deficit saving rate the same?
Should they be?
Which is larger, and why?
Solution
With the deficit fixed at \(G\), the \(T\) map is \(s \mapsto w_1 x/(w_2 + 2x)\) with \(x = s - G\), so its slope is \(w_1 w_2/(w_2 + 2x)^2\), and the steady states solve \(2x^2 - (w_1 - w_2 - 2G)x + w_2 G = 0\).
# the degree-0 approximate equilibrium
s_const = rules[0][0]                         # constant across states
G_mean = ergodic @ G

# the deterministic economy with G fixed at its mean
x_roots = np.roots([2, -(w1 - w2 - 2 * G_mean), w2 * G_mean])
s_steady = np.sort(x_roots + G_mean)[::-1]    # high saving (low inflation) first
slopes = w1 * w2 / (w2 + 2 * (s_steady - G_mean))**2

s_iter = (w1 - w2) / 2                        # iterate the T map from s = 5
for _ in range(1000):
    s_iter = 0.5 * s_iter + 0.5 * s_from_psi(regressand(s_iter, G_mean))

print(f"mean deficit  E[G]                            : {G_mean:.4f}")
print(f"steady states with G fixed at E[G]            : {s_steady.round(4)}")
print(f"slope of the T map at each                    : {slopes.round(3)}")
print(f"iterating the T map from s = 5 lands on       : {s_iter:.4f}")
print(f"degree-0 approximate-equilibrium saving rate  : {s_const:.4f}")
mean deficit  E[G]                            : 0.6531
steady states with G fixed at E[G]            : [4.0342 1.619 ]
slope of the T map at each                    : [0.712 1.405]
iterating the T map from s = 5 lands on       : 4.0342
degree-0 approximate-equilibrium saving rate  : 4.0226
The fixed-deficit economy has two steady states, as in Part 2 of Adaptive Agents in an Overlapping Generations Monetary Economy.
At the high-saving, low-inflation one the slope of the \(T\) map is about 0.71, below one; at the low-saving one it is about 1.4, above one.
Iterating the saving map from \(s = 5\) lands on the first, and nothing that iterates on beliefs can settle at the second.
That is the computational face of the stability reversal of The stability reversal, and it is why the low-inflation steady state is the right comparison.
The two saving rates are close but not equal, and the sign of the gap is predictable.
A regression on a constant returns the sample mean of \(y_t\), so \(\bar s\) is the fixed point of the map that sends \(s\) to \(w_1 \psi/(1 + \psi)\) with \(\psi = \mathbb{E}[y(s, G)]\), the expectation taken over the ergodic distribution of the deficit.
The fixed-deficit economy uses \(\psi = y(s, \mathbb{E}[G])\) instead.
For given \(s\), \(y(s, G) = 1 - w_2/(w_2 + s - G)\) is concave in \(G\), so by Jensen’s inequality \(\mathbb{E}[y(s, G)] < y(s, \mathbb{E}[G])\): spreading the deficit out lowers the expected payoff to saving.
The degree-0 map therefore lies below the fixed-deficit map at every \(s\).
Both maps cross the 45-degree line from above at their stable fixed points, so \(\bar s\) is below the fixed-deficit saving rate, as the numbers confirm.
They would agree only if the deficit were deterministic to begin with.
The lesson is that an approximate equilibrium is not a naive “certainty-equivalent” object.
Even the crudest one-parameter learner is responding to the whole distribution of outcomes it experiences, not to a point forecast.
Exercise 92.3
The non-parametric kernel learner has one free tuning constant: the bandwidth \(h\).
Explore its effect on a shorter history, \(T = 40{,}000\), where sampling noise matters.
For bandwidths from \(0.003\) to \(0.2\), run the kernel learner on ten simulated histories.
Split its ergodic-weighted mean squared error into a squared bias (the error of the rule averaged across histories) and a variance (the dispersion of the rules across histories).
Explain the shape of the trade-off.
What does the smallest bandwidth correspond to?
How does the kernel learner at its best bandwidth compare with the quadratic parametric rule fitted to the same histories?
Solution
T_short, seeds = 40_000, range(10)
bandwidths = (0.003, 0.01, 0.02, 0.03, 0.05, 0.08, 0.12, 0.20)

rows = []
for h in bandwidths:
    S = np.array([kernel_smoother(T=T_short, seed=seed, h=h)[0] for seed in seeds])
    bias2 = ergodic @ (S.mean(axis=0) - s_benchmark)**2
    var = ergodic @ S.var(axis=0)
    rows.append([h, np.sqrt(bias2), np.sqrt(var), np.sqrt(bias2 + var)])

table = pd.DataFrame(rows, columns=["bandwidth $h$", "bias", "std. deviation",
                                    "RMS error"]).set_index("bandwidth $h$")

S_quad = np.array([parameterized_expectations(Φ2, T=T_short, seed=seed)[0] for seed in seeds])
rms_quad = np.sqrt(ergodic @ ((S_quad - s_benchmark)**2).mean(axis=0))
step = np.diff(np.log(G))[0]

print(f"quadratic family on the same histories: RMS error {rms_quad:.4f}")
print(f"at h = 0.003 the weight on a neighbouring state is {np.exp(-0.5 * (step / 0.003)**2):.4f}")
table.round(4)
quadratic family on the same histories: RMS error 0.0133
at h = 0.003 the weight on a neighbouring state is 0.0022
| bias | std. deviation | RMS error | |
|---|---|---|---|
| bandwidth $h$ | |||
| 0.003 | 0.0088 | 0.0272 | 0.0286 |
| 0.010 | 0.0046 | 0.0178 | 0.0184 |
| 0.020 | 0.0027 | 0.0151 | 0.0153 |
| 0.030 | 0.0030 | 0.0138 | 0.0141 |
| 0.050 | 0.0110 | 0.0124 | 0.0166 |
| 0.080 | 0.0307 | 0.0110 | 0.0326 |
| 0.120 | 0.0636 | 0.0093 | 0.0643 |
| 0.200 | 0.1294 | 0.0075 | 0.1296 |
The rules themselves show the two failure modes.
fig, ax = plt.subplots(figsize=(7, 4.2))
for h, colour in [(0.003, 'C0'), (0.03, 'C1'), (0.20, 'C2')]:
    ax.plot(G, kernel_smoother(T=T_short, h=h)[0], '-', lw=1, color=colour, label=f"$h = {h}$")
ax.plot(G, s_benchmark, 'k-', lw=2, label="benchmark")
ax.set_xlabel("deficit $G$")
ax.set_ylabel("saving $s$")
ax.legend(frameon=False)
plt.show()
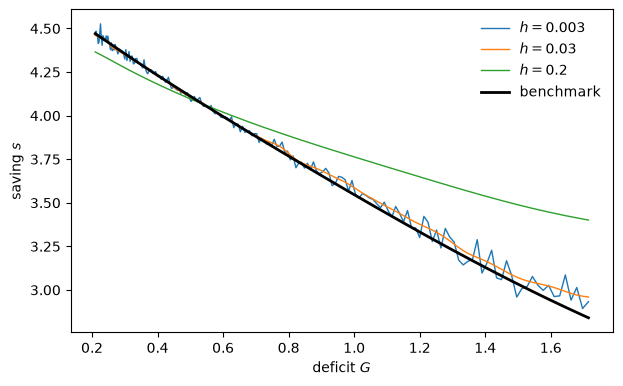
The variance falls steadily as the bandwidth widens.
The bias is small up to about \(h = 0.03\) and then rises steeply.
(At the smallest bandwidths the bias column mostly measures the noise in an average of ten noisy rules, about the standard deviation divided by \(\sqrt{10}\).)
So the RMS error has an interior minimum, here near \(h = 0.03\).
A small bandwidth averages over few neighbours, so the estimate is noisy: it wiggles around the benchmark, most of all toward the high-deficit end of the range.
This is the variance end of the trade-off.
At \(h = 0.003\) the weight on even the nearest neighbouring state is negligible, so the learner is effectively the state-by-state learner of Adaptive Agents in an Overlapping Generations Monetary Economy, with one estimate per state: the \(h \to 0\) limit of (92.5).
A large bandwidth averages over a wide window, smoothing the estimate but flattening it: the rule is pulled toward the saving of the middle of the range, below the benchmark at low deficits and above it at high ones.
This is the bias end.
At its best bandwidth the kernel learner is about as accurate as the quadratic family fitted to the same histories, but finding that bandwidth took the benchmark, which no learner has.
The bandwidth is the non-parametric counterpart of the polynomial degree in Exercise 92.1: both control how much structure the learner imposes, and both have a sweet spot that trades misfit-from-too-little-flexibility against noise-from-too-much.
The bounded-rationality program does not tell us where that spot is; it is one more choice that replaces the single discipline of rational expectations with a menu of plausible alternatives.
Exercise 92.4
Return to Economy 2 of Adaptive Agents in an Overlapping Generations Monetary Economy.
There the deficit is \(0.8\) in state 1 and \(0\) in state 2, the transition matrix is
and the rational expectations saving rates are \((4.211, 4.364)\), which the Robbins–Monro learners of that lecture found state by state.
Run the batch parameterized-expectations algorithm on this economy with the basis \(\phi(G) = (1, G)\). (The log-deficit basis of this lecture won’t do, because \(G = 0\) in state 2.) Show that it reproduces the rational expectations saving rates, and explain why it must.
Now use a constant basis, \(\phi(G) = 1\). Run both the batch algorithm and the online learner (92.3), and compare their limits with each other and with the rational expectations equilibrium.
The functions parameterized_expectations, online_pea and approximate_equilibrium accept the
deficit levels, the transition matrix and the basis evaluated at each state as arguments.
Solution
Here is part 1.
G_2 = np.array([0.8, 0.0])
P_2 = np.array([[0.75, 0.25],
                [0.50, 0.50]])
π_2 = qe.MarkovChain(P_2).stationary_distributions[0]
economy_2 = dict(G=G_2, P=P_2)

Φ_lin = np.column_stack([np.ones(2), G_2])
s_lin_batch = parameterized_expectations(Φ_lin, **economy_2)[0]
s_lin_pop = rule(Φ_lin, approximate_equilibrium(Φ_lin, π=π_2, **economy_2), G_2)

print(f"batch, φ = (1, G), T = 150,000 : {s_lin_batch.round(4)}")
print(f"population fixed point         : {s_lin_pop.round(4)}")
print( "rational expectations          : [4.211 4.364]")
batch, φ = (1, G), T = 150,000 : [4.2088 4.3629]
population fixed point         : [4.2111 4.3637]
rational expectations          : [4.211 4.364]
On a two-point state space every function of \(G\) is a linear function of \(G\): two coefficients can match any two values.
So the linear family contains the rational expectations equilibria exactly, and every fixed point of the algorithm is one of them.
This economy also has a high-inflation equilibrium, with saving of about \((1.19, 1.63)\), but it is not E-stable, so the algorithm settles on the one shown.
The population fixed point matches it to every digit shown, and the batch version differs from it only by sampling error.
On two points the “parametric” family is non-parametric in disguise: it reaches the same equilibrium that the learners of Adaptive Agents in an Overlapping Generations Monetary Economy found state by state, but by model formation rather than the hard way.
Here is part 2, with the online learner run for 200,000 periods under both bases.
Φ_const = np.ones((2, 1))
s_const_batch = parameterized_expectations(Φ_const, **economy_2)[0]
s_const_pop = rule(Φ_const, approximate_equilibrium(Φ_const, π=π_2, **economy_2), G_2)

T_2 = 200_000
paths = {"constant": (Φ_const, online_pea(Φ_const, T=T_2, **economy_2)),
         "linear":   (Φ_lin,   online_pea(Φ_lin,   T=T_2, **economy_2))}

print(f"constant basis, batch           : {s_const_batch.round(4)}")
print(f"constant basis, population      : {s_const_pop.round(4)}")
for name, (Φ, path) in paths.items():
    for t in (1_000, 10_000, 100_000, T_2 - 1):
        print(f"{name:8s} basis, online, t = {t:>7,}: {rule(Φ, path[t], G_2).round(4)}")
constant basis, batch           : [4.2691 4.2691]
constant basis, population      : [4.271 4.271]
constant basis, online, t =   1,000: [4.3487 4.3487]
constant basis, online, t =  10,000: [4.3019 4.3019]
constant basis, online, t = 100,000: [4.2847 4.2847]
constant basis, online, t = 199,999: [4.2809 4.2809]
linear   basis, online, t =   1,000: [4.3041 4.4333]
linear   basis, online, t =  10,000: [4.251 4.392]
linear   basis, online, t = 100,000: [4.228  4.3789]
linear   basis, online, t = 199,999: [4.2235 4.3751]
The constant family cannot let saving depend on the state, so its fixed point is a single saving rate, between the two rational expectations rates: an approximate equilibrium.
The batch algorithm and the online learner aim at that same rate, not at the rational expectations equilibrium.
The online learner approaches it slowly, from above, because it starts from \(s = 5\).
With the linear basis the online learner instead heads for the rational expectations saving rates.
What a learner can reach is set by its family, not by whether it learns in batch or in real time.
Exercise 92.5
The text predicted that the online learner’s distance from the approximate equilibrium \(\theta^*\) shrinks like \(t^{-(1 - \lambda_{\max})}\), where \(\lambda_{\max}\) is the largest eigenvalue of \(DT(\theta^*)\).
Plot \(\|\theta_t - \theta^*\|\) against \(t\) on log–log axes, for the path computed in the lecture and for two more simulated histories. Fit the slope over \(t \geq 10{,}000\), and compare it with \(-(1 - \lambda_{\max})\) and with \(-1/2\), the rate at which sampling noise averages out.
Repeat with the gain \(\gamma_t = 3/(t + 3)\) in place of \(1/(t + 1)\), which
online_peadelivers witha=3. What changes, and why?
Solution
T_online = len(θ_path)
ts = np.unique(np.logspace(2, np.log10(T_online - 1), 60).astype(int))
late = ts >= 10_000

fig, axes = plt.subplots(1, 2, figsize=(11, 4.2), sharey=True)
for ax, a in zip(axes, (1, 3)):
    starts = []
    for seed in (0, 1, 2):
        path = θ_path if (a == 1 and seed == 0) else online_pea(Φ2, seed=seed, a=a)
        dist = np.linalg.norm(path[ts] - θ_star, axis=1)
        slope = np.polyfit(np.log(ts[late]), np.log(dist[late]), 1)[0]
        ax.loglog(ts, dist, lw=1.5, label=f"history {seed}: slope {slope:.2f}")
        starts.append(dist[late][0])
    t_rel = ts[late] / ts[late][0]                # reference lines start at t = 10,000
    anchor = 1.5 * max(starts)
    ax.loglog(ts[late], anchor * t_rel**(-(1 - λ_max)), 'k--', lw=1,
              label=rf"slope $-(1-\lambda_{{\max}}) = {-(1 - λ_max):.2f}$")
    ax.loglog(ts[late], anchor * t_rel**(-0.5), 'k:', lw=1, label="slope $-1/2$")
    ax.set_xlabel("$t$")
    ax.set_title(f"gain $\\gamma_t = {a}/(t + {a})$")
    ax.legend(frameon=False, fontsize=8)
axes[0].set_ylabel(r"$\|\theta_t - \theta^*\|$")
plt.tight_layout()
plt.show()
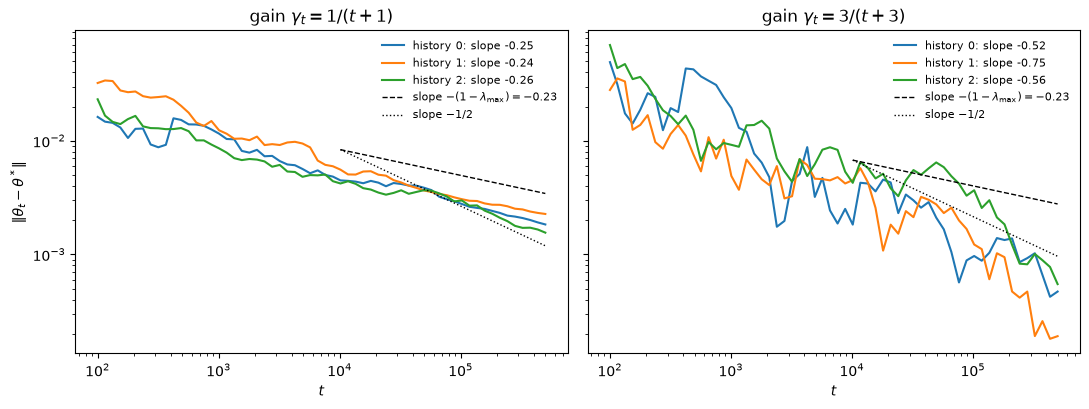
With the gain \(1/(t + 1)\) the fitted slopes are close to \(-(1 - \lambda_{\max}) \approx -0.23\) and far from \(-1/2\).
In the rescaled time \(\tau = \log t\), the mean dynamics (92.4) contract at the rates \(1 - \lambda_i\), the slowest of which is \(1 - \lambda_{\max}\), so the drift toward \(\theta^*\) decays like \(t^{-(1 - \lambda_{\max})}\), while sampling noise averages out like \(t^{-1/2}\).
The slower of the two dominates, and here it is the drift.
A gain of \(a/t\) runs the differential equation \(a\) times faster, so the drift decays like \(t^{-a(1 - \lambda_{\max})}\).
With \(a = 3\) that is faster than \(t^{-1/2}\), so in the long run sampling noise takes over and the error falls at the usual \(\sqrt{t}\) rate.
The fitted slopes are now near \(-1/2\) or steeper, and after half a million periods the error is several times smaller than with the gain \(1/(t+1)\).
This is the sense in which the book’s condition for \(\sqrt{t}\) convergence is a condition on the gain as well as on \(DT\).
Larger gains are not free: they make the early phase, far from \(\theta^*\), more violent, and a gain that never declines would leave beliefs fluctuating around \(\theta^*\) forever, the constant-gain behaviour described in One recursion, many learners.