29. Likelihood Ratio Processes and Bayesian Learning#
29.1. Overview#
This lecture describes the role that likelihood ratio processes play in Bayesian learning.
As in Likelihood Ratio Processes, we’ll use a simple statistical setting from Exchangeability and Bayesian Updating.
We’ll focus on how a likelihood ratio process and a prior probability determine a posterior probability.
We’ll derive a convenient recursion for today’s posterior as a function of yesterday’s posterior and today’s multiplicative increment to a likelihood process.
We’ll also present a useful generalization of that formula that represents today’s posterior in terms of an initial prior and today’s realization of the likelihood ratio process.
We’ll study how, at least in our setting, a Bayesian eventually learns the probability distribution that generates the data, an outcome that rests on the asymptotic behavior of likelihood ratio processes studied in Likelihood Ratio Processes.
We’ll also drill down into the psychology of our Bayesian learner and study dynamics under his subjective beliefs.
This lecture provides technical results that underlie outcomes to be studied in Job Search IX: Search with Learning, A Problem that Stumped Milton Friedman, and Bayesian versus Frequentist Decision Rules.
We’ll begin by loading some Python modules.
import matplotlib.pyplot as plt
import numpy as np
from numba import vectorize, jit
from math import gamma
import pandas as pd
from scipy.integrate import quad
from scipy.special import expit, logit
from scipy.stats import ks_2samp


import seaborn as sns
colors = sns.color_palette()

rng = np.random.default_rng(142857)
29.2. The setting#
We begin by reviewing the setting in Likelihood Ratio Processes, which we adopt here too.
A nonnegative random variable \(W\) has one of two probability density functions, either \(f\) or \(g\).
Before the beginning of time, nature once and for all decides whether she will draw a sequence of IID draws from \(f\) or from \(g\).
We let \(q\) be the density that nature chose once and for all, so that \(q\) is either \(f\) or \(g\), permanently.
Nature knows which density it permanently draws from, but we the observers do not.
We do know both \(f\) and \(g\), but we don’t know which density nature chose.
But we want to know.
To do that, we use observations.
We observe a sequence \(w_0, w_1, \ldots\) of IID draws from either \(f\) or \(g\).
We date the first draw \(t = 0\) and the prior \(t = -1\), as in Exchangeability and Bayesian Updating.
Likelihood Ratio Processes dates the first draw \(t = 1\).
We want to use these observations to infer whether nature chose \(f\) or \(g\).
A likelihood ratio process is a useful tool for this task.
To begin, we define the key component of a likelihood ratio process, namely, the time \(t\) likelihood ratio as the random variable
We assume that \(f\) and \(g\) both put positive probabilities on the same intervals of possible realizations of the random variable \(W\).
That means that under the \(g\) density, \(\ell (w_t)= \frac{f\left(w_{t}\right)}{g\left(w_{t}\right)}\) is evidently a nonnegative random variable with mean \(1\).
A likelihood ratio process for sequence \(\left\{ w_{t}\right\} _{t=0}^{\infty}\) is defined as
where \(w^t=\{ w_0,\dots,w_t\}\) is a history of observations up to and including time \(t\).
Sometimes for shorthand we’ll write
where we use the conventions that \(f(w^t) = f(w_0) f(w_1) \ldots f(w_t)\) and \(g(w^t) = g(w_0) g(w_1) \ldots g(w_t)\).
Notice that the likelihood process satisfies the recursion or multiplicative decomposition
with \(L(w^{-1}) \equiv 1\).
The likelihood ratio and its logarithm are key tools for making inferences using a classic frequentist approach due to Neyman and Pearson [Neyman and Pearson, 1933].
We’ll again deploy the following Python code from Likelihood Ratio Processes that evaluates \(f\) and \(g\) as two different beta distributions, then computes and simulates an associated likelihood ratio process by generating a sequence \(w^t\) from some probability distribution, for example, a sequence of IID draws from \(g\).
# Parameters in the two beta distributions.
F_a, F_b = 1, 1
G_a, G_b = 3, 1.2

@vectorize
def p(x, a, b):
    r = gamma(a + b) / (gamma(a) * gamma(b))
    return r * x**(a-1) * (1 - x)**(b-1)

# The two density functions.
f = jit(lambda x: p(x, F_a, F_b))
g = jit(lambda x: p(x, G_a, G_b))
@jit
def simulate(a, b, rng, T=50, N=500):
    '''
    Generate N sets of T observations of the likelihood ratio,
    return as N x T matrix.  Column s holds ℓ(w_s), s = 0, ..., T-1.
    '''

    l_arr = np.empty((N, T))

    for i in range(N):

        for j in range(T):
            w = rng.beta(a, b)
            l_arr[i, j] = f(w) / g(w)

    return l_arr
We’ll also use the following Python code to prepare some informative simulations.
Column \(t\) of l_seq_g and l_seq_f holds \(L(w^t)\).
l_arr_g = simulate(G_a, G_b, rng, N=50000)
l_seq_g = np.cumprod(l_arr_g, axis=1)
l_arr_f = simulate(F_a, F_b, rng, N=50000)
l_seq_f = np.cumprod(l_arr_f, axis=1)
29.3. Likelihood ratio processes and Bayes’ law#
Let \(\pi_{-1} \in [0,1]\) be a Bayesian statistician’s prior probability that nature generates \(w^t\) as a sequence of IID draws from distribution \(f\).
here “probability” is to be interpreted as a way to summarize or express a subjective opinion
it does not mean an anticipated relative frequency as sample size grows without limit
Let \(\pi_{t}\) be a Bayesian posterior probability defined as
The likelihood ratio process is a principal actor in the formula that governs the evolution of the posterior probability \(\pi_t\), an instance of Bayes’ law.
Let’s derive a couple of formulas for \(\pi_{t}\), one in terms of the likelihood ratio \(\ell(w_{t})\), the other in terms of \(L(w^{t})\).
To begin, we use the notational conventions
\(f(w^{t}) \equiv f(w_0) f(w_1) \cdots f(w_{t})\)
\(g(w^{t}) \equiv g(w_0) g(w_1) \cdots g(w_{t})\)
\(\pi_{-1} ={\rm Prob}(q=f |\emptyset)\)
\(\pi_t = {\rm Prob}(q=f |w^t)\)
Here the symbol \(\emptyset\) means “empty set” or “no data”.
With no data in hand, our Bayesian statistician thinks that the probability density of the sequence \(w^{t}\) is
Laws of probability say that the joint distribution \({\rm Prob}(AB)\) of events \(A\) and \(B\) are connected to the conditional distributions \({\rm Prob}(A |B)\) and \({\rm Prob}(B |A)\) by
We are interested in events
where braces \(\{\cdot\}\) are our shorthand for “event”.
So in our setting, probability laws (29.2) imply that
or
or
Dividing both the numerator and the denominator on the right side of the above equation by \(g(w^{t})\) implies
Formula (29.3) can be regarded as a one step revision of prior probability \(\pi_{-1}\) after seeing the batch of data \(\left\{ w_{s}\right\} _{s=0}^{t}\).
Formula (29.3) shows the key role that the likelihood ratio process \(L\left(w^{t}\right)\) plays in determining the posterior probability \(\pi_{t}\).
Formula (29.3) is the foundation for the insight that, because of how the likelihood ratio process behaves as \(t \rightarrow + \infty\), the likelihood ratio process dominates the initial prior \(\pi_{-1}\) in determining the limiting behavior of \(\pi_t\).
29.3.1. A recursive formula#
We can use a similar line of argument to get a recursive version of formula (29.3).
The laws of probability imply
or
Evidently, the above equation asserts that
where
is the density of \(w_{t+1}\) conditional on the history \(w^t\).
Conditional on \(q\), the draw \(w_{t+1}\) is independent of \(w^t\), so \(f(w_{t+1})\) is the density of \(w_{t+1}\) conditional on \(q = f\) and \(w^t\).
Dividing both the numerator and the denominator on the right side of the equation (29.4) by \(g(w_{t+1})\) implies the recursion
with \(\pi_{-1}\) being a Bayesian prior probability that \(q = f\), i.e., a personal or subjective belief about \(q\) based on our having seen no data.
Formula (29.3) can be deduced by iterating on equation (29.5).
In terms of log odds, recursion (29.5) is
and formula (29.3) is
Our code iterates on log odds.
Iterating on (29.5) itself accumulates rounding errors that push \(\pi_t\) slightly above \(1\) or below \(0\) once \(\pi_t\) is close to \(1\) or \(0\).
Below we define a Python function that updates the log odds of \(q = f\) using likelihood ratio \(\ell\) according to recursion (29.6)
@jit
def update(log_odds, l):
    "Update the log odds of q = f using likelihood ratio l"
    return log_odds + np.log(l)
To illustrate how the likelihood ratio process dominates the initial prior, below we will plot graphs showing one simulated path of the likelihood ratio process \(L_t\) along with two paths of \(\pi_t\) that are associated with the same realization of the likelihood ratio process but different initial prior probabilities \(\pi_{-1}\).
First, we tell Python two values of \(\pi_{-1}\).
π1, π2 = 0.2, 0.8
Next we generate paths of the likelihood ratio process \(L_t\) and the posterior \(\pi_t\) for a history of IID draws from density \(f\).
Column \(0\) of π_seq_f holds the prior \(\pi_{-1}\) and column \(t+1\) holds \(\pi_t\).
T = l_arr_f.shape[1]
log_odds_f = np.empty((2, T+1))
log_odds_f[:, 0] = logit([π1, π2])

for t in range(T):
    for i in range(2):
        log_odds_f[i, t+1] = update(log_odds_f[i, t], l_arr_f[0, t])

π_seq_f = expit(log_odds_f)
fig, ax1 = plt.subplots()

for i in range(2):
    ax1.plot(range(-1, T), π_seq_f[i, :],
    label=fr"$\pi_{{-1}}$={π_seq_f[i, 0]:.1f}", lw=2)

ax1.set_ylabel(r"$\pi_t$")
ax1.set_xlabel(r"$t$")
ax1.legend()

ax2 = ax1.twinx()
ax2.plot(range(T), np.log(l_seq_f[0, :]), '--', color='b', lw=2)
ax2.set_ylabel(r"$\log(L(w^{t}))$")

plt.show()
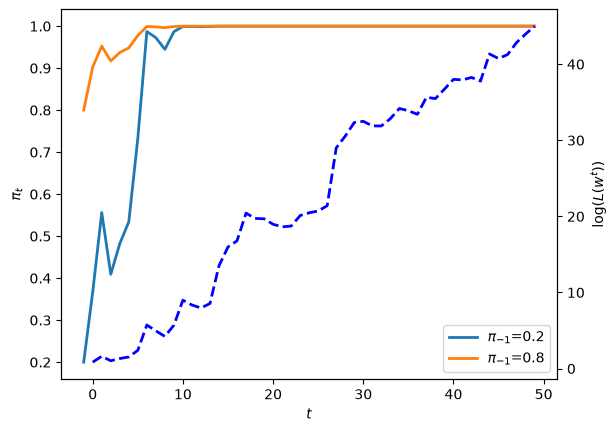
Fig. 29.1 Posterior paths and log likelihood ratio#
The dashed line in the graph above records the logarithm of the likelihood ratio process \(\log L(w^t)\).
Please note that there are two different scales on the \(y\) axis.
Now let’s study what happens when the history consists of IID draws from density \(g\)
T = l_arr_g.shape[1]
log_odds_g = np.empty((2, T+1))
log_odds_g[:, 0] = logit([π1, π2])

for t in range(T):
    for i in range(2):
        log_odds_g[i, t+1] = update(log_odds_g[i, t], l_arr_g[0, t])

π_seq_g = expit(log_odds_g)
fig, ax1 = plt.subplots()

for i in range(2):
    ax1.plot(range(-1, T), π_seq_g[i, :],
        label=fr"$\pi_{{-1}}$={π_seq_g[i, 0]:.1f}", lw=2)

ax1.set_ylabel(r"$\pi_t$")
ax1.set_xlabel(r"$t$")
ax1.legend()

ax2 = ax1.twinx()
ax2.plot(range(T), np.log(l_seq_g[0, :]), '--', color='b', lw=2)
ax2.set_ylabel(r"$\log(L(w^{t}))$")

plt.show()
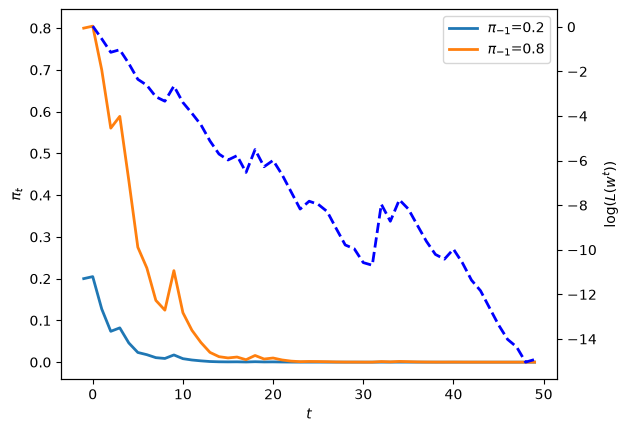
Fig. 29.2 Posterior paths and log likelihood ratio#
The next cell checks that the batch formula (29.3) reproduces the paths of \(\pi_t\) that recursion (29.6) generated from the draws from density \(f\).
π_seq = np.empty((2, T+1))
π_seq[:, 0] = π1, π2

for i in range(2):
    πL = π_seq[i, 0] * l_seq_f[0, :]
    π_seq[i, 1:] = πL / (πL + 1 - π_seq[i, 0])
np.abs(π_seq - π_seq_f).max() < 1e-10
np.True_
We thus conclude that the likelihood ratio process is a key ingredient of the formula (29.3) for a Bayesian’s posterior probability that nature has drawn history \(w^t\) as repeated draws from density \(f\).
29.4. Another timing protocol#
Let’s study how the posterior probability \(\pi_t = {\rm Prob}(q=f|w^{t}) \) behaves when nature generates the history \(w^t = \{w_0, w_1, \dots, w_t\}\) under a different timing protocol.
Until now we assumed that before time \(0\) nature somehow chose to draw \(w^t\) as an IID sequence from either \(f\) or \(g\).
Nature’s decision about whether to draw from \(f\) or \(g\) was thus permanent.
We now assume a different timing protocol in which before each period \(t =0, 1, \ldots\) nature
flips an \(\alpha\)-weighted coin, then
draws from \(f\) if it has drawn a “head”
draws from \(g\) if it has drawn a “tail”.
Under this timing protocol, nature draws permanently from neither \(f\) nor \(g\), so a statistician who thinks that nature is drawing IID draws permanently from one of them is mistaken.
in truth, nature draws IID from the mixture \(h(w|\alpha) = \alpha f(w) + (1-\alpha) g(w)\), a density that is neither \(f\) nor \(g\) when \(\alpha \in (0,1)\)
The statistician’s posterior \(\pi_t\) remains his probability that \(q = f\), as defined in (29.1).
It is not an estimate of the mixing parameter \(\alpha\).
The statistician’s model is misspecified, and Kullback–Leibler divergences of \(f\) and \(g\) from \(h\) determine the limit of \(\pi_t\).
By the law of large numbers, \(\frac{1}{t+1} \log L(w^t)\) converges with probability one to
where \(E_h\) denotes the expectation under \(h(\cdot|\alpha)\) and \(KL(h, f) = \int h(w|\alpha) \log \frac{h(w|\alpha)}{f(w)} dw\); see A helpful formula in Likelihood Ratio Processes.
So \(\log L(w^t) \rightarrow + \infty\) and \(\pi_t \rightarrow 1\) when \(KL(h, f) < KL(h, g)\).
And \(\log L(w^t) \rightarrow - \infty\) and \(\pi_t \rightarrow 0\) when \(KL(h, f) > KL(h, g)\).
The statistician comes to believe the member of \(\{f, g\}\) that is closer to \(h\) in Kullback–Leibler divergence.
Let’s write some Python code to check this when \(\alpha = 0.5\).
@jit
def simulate_mixture_path(α, T, rng):
    """
    Simulate draws w_0, ..., w_{T-1} under the mixture timing protocol.
    """
    w = np.empty(T)
    for t in range(T):
        if rng.random() < α:
            w[t] = rng.beta(F_a, F_b)
        else:
            w[t] = rng.beta(G_a, G_b)
    return w


α = 0.5
T_mix = 200
rng = np.random.default_rng(142857)
w_mix = simulate_mixture_path(α, T_mix, rng)
We compute paths of \(\pi_t\) for three priors \(\pi_{-1}\).
log_L_mix = np.cumsum(np.log(f(w_mix) / g(w_mix)))

fig, ax = plt.subplots(figsize=(10, 6))
for i, π_init in enumerate([0.25, 0.5, 0.75]):
    π_path = expit(logit(π_init) + log_L_mix)
    ax.plot(range(-1, T_mix), np.concatenate(([π_init], π_path)),
            label=fr'$\pi_{{-1}} = ${π_init:.2f}', color=colors[i], linewidth=2)

ax.set_xlabel('$t$')
ax.set_ylabel(r'$\pi_t$')
ax.legend()
plt.show()
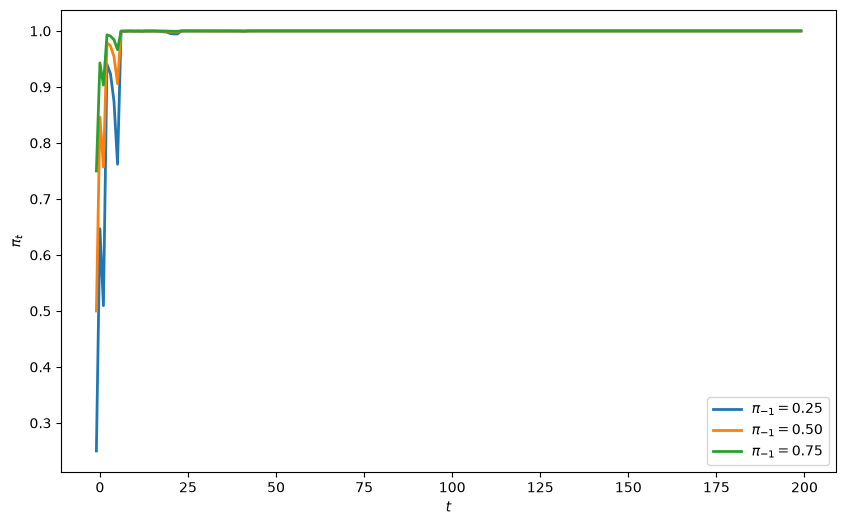
Fig. 29.3 Posterior under mixture model#
Evidently, \(\pi_t\) converges to 1.
Let’s check the KL divergences of \(f\) and \(g\) from \(h\).
def compute_KL(f, g):
    """
    Compute KL divergence KL(f, g)
    """
    integrand = lambda w: f(w) * np.log(f(w) / g(w))
    val, _ = quad(integrand, 1e-5, 1-1e-5)
    return val


h = lambda w: α * f(w) + (1 - α) * g(w)
KL_hf, KL_hg = compute_KL(h, f), compute_KL(h, g)

print(f'KL(h, f) = {KL_hf:.3f}\nKL(h, g) = {KL_hg:.3f}')
KL(h, f) = 0.073
KL(h, g) = 0.281
Since \(KL(h, f) < KL(h, g)\), \(f\) is closer to \(h\), \(\log L(w^t) \rightarrow + \infty\), and \(\pi_t \rightarrow 1\) for every \(\pi_{-1} \in (0,1)\).
Incorrect Models studies this misspecified statistician further, including the value of \(\alpha\) at which \(KL(h, f) = KL(h, g)\) and \(\pi_t\) does not converge.
It also studies a statistician who knows that nature mixes each period and uses Bayes’ law to learn \(\alpha\).
29.5. Behavior of posterior probability \(\{\pi_t\}\) under subjective probability distribution#
We’ll end this lecture by briefly studying what our Bayesian learner expects to learn under the subjective beliefs \(\pi_t\) cranked out by Bayes’ law.
This will provide us with some perspective on our application of Bayes’ law as a theory of learning.
As we shall see, at each time \(t\), the Bayesian learner knows that he will be surprised.
But he expects that new information will not lead him to change his beliefs.
And it won’t on average under his subjective beliefs.
We’ll continue with our setting in which a McCall worker knows that successive draws of his wage are drawn from either \(F\) or \(G\), but does not know which of these two distributions nature has drawn once-and-for-all before time \(0\).
We’ll review and reiterate and rearrange some formulas that we have encountered above and in associated lectures.
The worker’s initial beliefs induce a joint probability distribution over a potentially infinite sequence of draws \(w_0, w_1, \ldots \).
Bayes’ law is simply an application of laws of probability to compute the conditional distribution of the \(t\)th draw \(w_t\) conditional on \([w_0, \ldots, w_{t-1}]\).
After our worker puts a subjective probability \(\pi_{-1}\) on nature having selected distribution \(F\), we have in effect assumed from the start that the decision maker knows the joint distribution for the process \(\{w_t\}_{t=0}^\infty\).
We assume that the worker also knows the laws of probability theory.
A respectable view is that Bayes’ law is less a theory of learning than a statement about the consequences of information inflows for a decision maker who thinks he knows the truth (i.e., a joint probability distribution) from the beginning.
29.5.1. Mechanical details again#
At time \(0\) before drawing a wage offer, the worker attaches probability \(\pi_{-1} \in (0,1)\) to the distribution being \(F\).
Before drawing a wage at time \(0\), the worker thus believes that the density of \(w_0\) is
Here and below \(h(w|\pi) \equiv \pi f(w) + (1 - \pi) g(w)\) denotes the mixture of \(f\) and \(g\) with weight \(\pi\) on \(f\).
Recall that \(q \in \{ f, g\}\) indicates whether nature chose permanently to draw from distribution \(f\) or from distribution \(g\).
After drawing \(w_0\), the worker uses Bayes’ law to deduce that the posterior probability \(\pi_0 = {\rm Prob}({q = f | w_0}) \) that the density is \(f(w)\) is
More generally, after making the \(t\)th draw and having observed \(w_t, w_{t-1}, \ldots, w_0\), the worker believes that the probability that \(w_{t+1}\) is being drawn from distribution \(F\) is
or
and that the density of \(w_{t+1}\) conditional on \(w_t, w_{t-1}, \ldots, w_0\) is
Notice that
so that the process \(\pi_t\) is a martingale.
Indeed, it is a bounded martingale because each \(\pi_t\), being a probability, is between \(0\) and \(1\).
In the first line in the above string of equalities, the term in the first set of brackets is just \(\pi_t\) as a function of \(w_{t}\), while the term in the second set of brackets is the density of \(w_{t}\) conditional on \(w_{t-1}, \ldots , w_0\) or equivalently conditional on the sufficient statistic \(\pi_{t-1}\) for \(w_{t-1}, \ldots , w_0\).
Notice that here we are computing \(E(\pi_t | \pi_{t-1})\) under the subjective density described in the second term in brackets.
Because \(\{\pi_t\}\) is a bounded martingale sequence, it follows from the martingale convergence theorem that \(\pi_t\) converges almost surely to a random variable in \([0,1]\).
Practically, this means that probability one is attached to sample paths \(\{\pi_t\}_{t=0}^\infty\) that converge.
According to the theorem, different sample paths can converge to different limiting values.
Thus, let \(\{\pi_t(\omega)\}_{t=0}^\infty\) denote a particular sample path indexed by a particular \(\omega \in \Omega\).
We can think of nature as drawing an \(\omega \in \Omega\) from a probability distribution \({\textrm{Prob}}(\Omega)\) and then generating a single realization (or simulation) \(\{\pi_t(\omega)\}_{t=0}^\infty\) of the process.
The limit points of \(\{\pi_t(\omega)\}_{t=0}^\infty\) as \(t \rightarrow +\infty\) are realizations of a random variable that is swept out as we sample \(\omega\) from \(\Omega\) and construct repeated draws of \(\{\pi_t(\omega)\}_{t=0}^\infty\).
Let
The martingale convergence theorem does not say where \(\pi_t(\omega)\) goes.
Two facts settle that.
First, \(\pi_t\) is the conditional expectation \(E[\mathbf{1}\{q = f\} \,|\, w^t]\) of the indicator of the event \(q = f\).
Second, an observer of the infinite history \(w_0, w_1, \ldots\) can determine \(q\).
By the strong law of large numbers, \(\frac{1}{t+1} \log L(w^t)\) converges to \(E_f[\log \ell(w)] = KL(f, g) > 0\) when \(q = f\) and to \(E_g[\log \ell(w)] = -KL(g, f) < 0\) when \(q = g\).
Doob’s martingale convergence theorem [Doob, 1953] then implies that \(\pi_t\) converges with probability one to \(E[\mathbf{1}\{q = f\} \,|\, w_0, w_1, \ldots] = \mathbf{1}\{q = f\}\).
Thus, for realizations along which nature drew \(f\), \(\lim_{t \rightarrow + \infty} \pi_t(\omega) =1\), while for realizations along which nature drew \(g\), \(\lim_{t \rightarrow + \infty} \pi_t(\omega) =0\).
The section Drilling down a little bit and Exercise Exercise 29.2 give a second proof that \(\pi_\infty(\omega) \in \{0, 1\}\).
Now let’s remember that \(\{\pi_t\}_{t=0}^\infty\) is a martingale and apply the law of iterated expectations.
The law of iterated expectations implies
and in particular
Applying the above formula to \(\pi_\infty\), we obtain
where the mathematical expectation \(E_{-1}\) here is taken with respect to the probability measure \({\textrm{Prob}(\Omega)}\).
Since the only two values that \(\pi_\infty(\omega)\) can take are \(1\) and \(0\), we know that for some \(\lambda \in [0,1]\)
and consequently that
Combining this equation with equation (29.8), we deduce that the probability that \({\textrm{Prob}(\Omega)}\) attaches to \(\pi_\infty(\omega)\) being \(1\) must be \(\pi_{-1}\).
The same answer follows from \(\pi_\infty = \mathbf{1}\{q = f\}\) and \({\rm Prob}(q = f) = \pi_{-1}\).
Thus, under the worker’s subjective distribution, \(\pi_{-1}\) of the sample paths of \(\{\pi_t\}\) will converge pointwise to \(1\) and \(1 - \pi_{-1}\) of the sample paths will converge pointwise to \(0\).
29.5.2. Some simulations#
Let’s watch the martingale convergence theorem at work in some simulations of our learning model under the worker’s subjective distribution.
Let us simulate \(\left\{ \pi_{t}\right\} _{t=-1}^{T-1}\), \(\left\{ w_{t}\right\} _{t=0}^{T-1}\) paths where for each \(t\geq0\), \(w_t\) is drawn from the subjective distribution
This sampling scheme gives the history \(w^t\) the same joint distribution as drawing \(q\) once and for all with \({\rm Prob}(q = f) = \pi_{-1}\) and then drawing \(w_0, w_1, \ldots\) IID from \(q\):
Exercise Exercise 29.1 asks you to prove and check this.
Per-period mixing with a fixed weight \(\alpha\) gives a different joint density, \(\prod_{s=0}^{t} h(w_s|\alpha)\); that is the timing protocol of Incorrect Models.
We’ll plot a large sample of paths.
Our code tracks log odds of \(q = f\) and converts them to probabilities.
@jit
def martingale_simulate(π_prior, rng, N=5000, T=200):
    """
    Simulate N paths of w_0, ..., w_{T-1} from the subjective distribution.
    Column 0 of π_path holds the prior π_{-1}; column t+1 holds π_t.
    """
    π_path = np.empty((N,T+1))
    w_path = np.empty((N,T))
    π_path[:,0] = π_prior

    for n in range(N):
        log_odds = np.log(π_prior) - np.log(1 - π_prior)
        π = π_prior
        for t in range(T):
            # draw w from h(w | π)
            if rng.random() <= π:
                w = rng.beta(F_a, F_b)
            else:
                w = rng.beta(G_a, G_b)
            log_odds = update(log_odds, f(w) / g(w))
            π = 1 / (1 + np.exp(-log_odds))
            π_path[n,t+1] = π
            w_path[n,t] = w

    return π_path, w_path

def fraction_0_1(π_prior, rng, N, T, decimals):

    π_path, w_path = martingale_simulate(π_prior, rng, N=N, T=T)
    values, counts = np.unique(np.round(π_path[:,-1], decimals=decimals), return_counts=True)
    return values, counts

def create_table(π_priors, rng, N=10000, T=500, decimals=2):

    outcomes = []
    for π_prior in π_priors:
        values, counts = fraction_0_1(π_prior, rng, N=N, T=T, decimals=decimals)
        freq = counts/N
        outcomes.append(dict(zip(values, freq)))
    table = pd.DataFrame(outcomes).sort_index(axis=1).fillna(0)
    table.index = π_priors
    return table

# simulate
T = 200
π_prior = .5

π_path, w_path = martingale_simulate(π_prior=π_prior, rng=rng, T=T, N=10000)
fig, ax = plt.subplots()
for i in range(100):
    ax.plot(range(-1, T), π_path[i, :], lw=2)

ax.set_xlabel('$t$')
ax.set_ylabel(r'$\pi_t$')
plt.show()
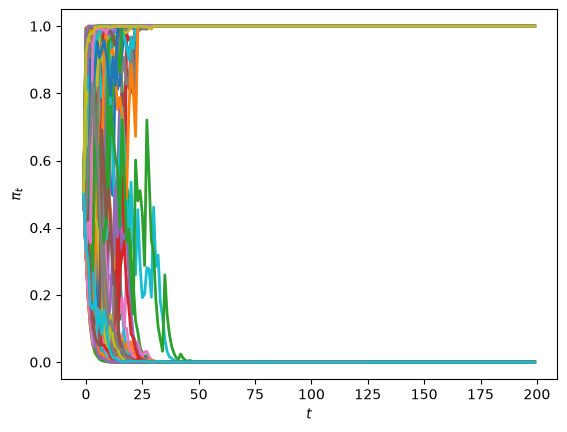
The above graph indicates that
each of the paths converges
some of the paths converge to \(1\)
some of the paths converge to \(0\)
none of the paths converge to a limit point not equal to \(0\) or \(1\)
Convergence actually occurs pretty fast, as the following graph of the cross-ensemble distribution of \(\pi_t\) for \(t = 1, 10\), and \(199\) indicates.
fig, ax = plt.subplots()
for t in [1, 10, T-1]:
    ax.hist(π_path[:, t+1], bins=20, alpha=0.4, label=f'$t={t}$')

ax.set_ylabel('count')
ax.set_xlabel(r'$\pi_t$')
ax.legend(loc='lower right')
plt.show()
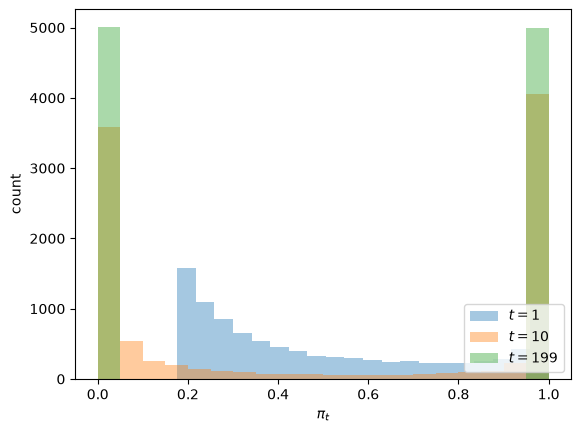
The next cell reports the fractions of paths with \(\pi_{199}\) above \(0.99\), below \(0.01\), and in between.
def report_fractions(π_path):
    π_T = π_path[:, -1]
    print(f"fraction with π_T > 0.99:        {np.mean(π_T > 0.99):.4f}")
    print(f"fraction with π_T < 0.01:        {np.mean(π_T < 0.01):.4f}")
    print(f"fraction with 0.01 <= π_T <= 0.99: {np.mean((π_T >= 0.01) & (π_T <= 0.99)):.4f}")

report_fractions(π_path)
fraction with π_T > 0.99:        0.4991
fraction with π_T < 0.01:        0.5009
fraction with 0.01 <= π_T <= 0.99: 0.0000
Evidently, by \(t = 199\), \(\pi_t\) has converged to either \(0\) or \(1\) along almost every path.
The fraction of paths that have converged to \(1\) is close to \(.5\).
The fraction of paths that have converged to \(0\) is also close to \(.5\).
Does the fraction \(.5\) ring a bell?
Yes, it does: it equals the value of \(\pi_{-1} = .5 \) that we used to generate each sequence in the ensemble.
So let’s change \(\pi_{-1}\) to \(.3\) and watch what happens to the distribution of the ensemble of \(\pi_t\)’s for various \(t\)’s.
# simulate
T = 200
π_prior = .3

π_path3, w_path3 = martingale_simulate(π_prior=π_prior, rng=rng, T=T, N=10000)
fig, ax = plt.subplots()
for t in [1, 10, T-1]:
    ax.hist(π_path3[:, t+1], bins=20, alpha=0.4, label=f'$t={t}$')

ax.set_ylabel('count')
ax.set_xlabel(r'$\pi_t$')
ax.legend(loc='upper right')
plt.show()

report_fractions(π_path3)
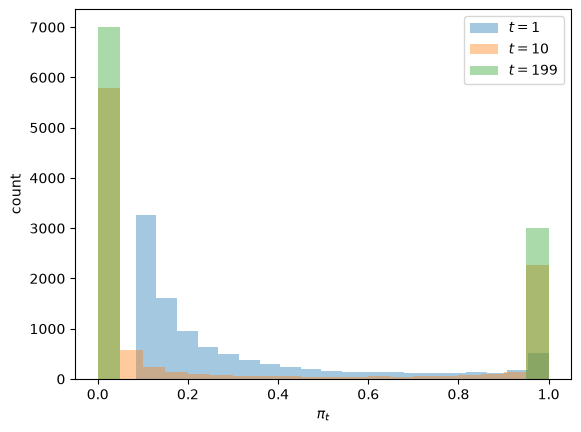
fraction with π_T > 0.99:        0.2996
fraction with π_T < 0.01:        0.7004
fraction with 0.01 <= π_T <= 0.99: 0.0000
For the preceding ensemble that assumed \(\pi_{-1} = .5\), the following graph shows two paths of \(w_t\)’s and the \(\pi_t\) sequences that gave rise to them.
We choose the path with the largest \(\pi_{199}\) and the path with the smallest \(\pi_{199}\).
Draws \(w \in [0.524, 0.999]\) have \(\ell(w) < 1\) and push \(\pi_t\) downward (see Exchangeability and Bayesian Updating).
The path along which \(\pi_t\) goes to \(1\) has systematically lower \(w_t\)’s than the path along which \(\pi_t\) goes to \(0\).
The luck of the draw early in a simulation pushes the subjective distribution to draw from \(F\) more frequently along a sample path, and this pushes \(\pi_t\) toward \(1\).
Because predictive sampling has the same joint distribution as drawing \(q\) once and for all, a path along which \(\pi_t \rightarrow 1\) looks like a sequence of IID draws from \(f\), and a path along which \(\pi_t \rightarrow 0\) looks like a sequence of IID draws from \(g\).
j_up, j_down = np.argmax(π_path[:, -1]), np.argmin(π_path[:, -1])

fig, ax = plt.subplots()
ax2 = ax.twinx()
for i, j in enumerate([j_up, j_down]):
    ax.plot(range(-1, T), π_path[j, :], color=colors[i],
            label=fr'$\pi_t$, path {j}', lw=2)
    ax2.plot(range(T), w_path[j, :], color=colors[i],
             label=fr'$w_t$, path {j}', alpha=0.3, lw=2)

ax.set_xlabel('$t$')
ax.set_ylabel(r'$\pi_t$')
ax2.set_ylabel(r'$w_t$')
handles = ax.get_legend_handles_labels()[0] + ax2.get_legend_handles_labels()[0]
ax.legend(handles=handles, loc='center right')
plt.show()

for name, j in [('π_t → 1', j_up), ('π_t → 0', j_down)]:
    print(f"path with {name}: mean of w_t = {w_path[j, :].mean():.3f}")

up = π_path[:, -1] > 0.5
print(f"all paths with π_199 > 0.5: mean of w_t = {w_path[up, :].mean():.3f}")
print(f"all paths with π_199 < 0.5: mean of w_t = {w_path[~up, :].mean():.3f}")
print(f"means of f and g: {F_a / (F_a + F_b):.3f}, {G_a / (G_a + G_b):.3f}")
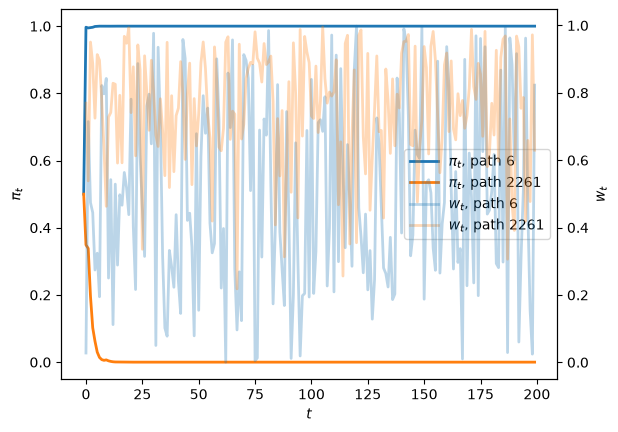
path with π_t → 1: mean of w_t = 0.496
path with π_t → 0: mean of w_t = 0.755
all paths with π_199 > 0.5: mean of w_t = 0.500
all paths with π_199 < 0.5: mean of w_t = 0.714
means of f and g: 0.500, 0.714
Across all paths, the mean of \(w_t\) along paths with \(\pi_{199} > 0.5\) is close to the mean of \(f\), and the mean of \(w_t\) along paths with \(\pi_{199} < 0.5\) is close to the mean of \(g\).
29.6. Initial prior is verified by paths drawn from subjective conditional densities#
Now let’s use our Python code to generate a table that checks out our earlier claims about the probability distribution of the pointwise limits \(\pi_{\infty}(\omega)\).
We’ll use our simulations to generate a histogram of this distribution.
In the following table, the left column in bold face reports an assumed value of \(\pi_{-1}\).
The second column reports the fraction of \(N = 10000\) simulations for which \(\pi_{t}\) had converged to \(0\) at the terminal date \(T=500\) for each simulation.
The third column reports the fraction of \(N = 10000\) simulations for which \(\pi_{t}\) had converged to \(1\) at the terminal date \(T=500\) for each simulation.
# create table
table = create_table(list(np.linspace(0,1,11)), rng, N=10000, T=500)
table
| 0.0 | 1.0 | |
|---|---|---|
| 0.0 | 1.0000 | 0.0000 |
| 0.1 | 0.9010 | 0.0990 |
| 0.2 | 0.7991 | 0.2009 |
| 0.3 | 0.6962 | 0.3038 |
| 0.4 | 0.6033 | 0.3967 |
| 0.5 | 0.5034 | 0.4966 |
| 0.6 | 0.3991 | 0.6009 |
| 0.7 | 0.2936 | 0.7064 |
| 0.8 | 0.2047 | 0.7953 |
| 0.9 | 0.0955 | 0.9045 |
| 1.0 | 0.0000 | 1.0000 |
The fraction of simulations for which \(\pi_{t}\) had converged to \(1\) is indeed always close to \(\pi_{-1}\), as anticipated.
29.7. Drilling down a little bit#
To understand how the local dynamics of \(\pi_t\) behaves, it is enlightening to consult the variance of \(\pi_{t}\) conditional on \(\pi_{t-1}\).
Under the subjective distribution this conditional variance is defined as
We can use a Monte Carlo simulation to approximate this conditional variance.
We approximate it for a grid of points \(\pi_{t-1} \in [0,1]\).
Then we’ll plot it.
@jit
def compute_cond_var(π, rng, mc_size=int(1e6)):
    # Create Monte Carlo draws
    mc_draws = np.zeros(mc_size)

    for i in range(mc_size):
        if rng.random() <= π:
            mc_draws[i] = rng.beta(F_a, F_b)
        else:
            mc_draws[i] = rng.beta(G_a, G_b)

    dev = π*f(mc_draws)/(π*f(mc_draws) + (1-π)*g(mc_draws)) - π
    return np.mean(dev**2)

π_array = np.linspace(0, 1, 40)
cond_var_array = []

for π in π_array:
    cond_var_array.append(compute_cond_var(π, rng))

fig, ax = plt.subplots()
ax.plot(π_array, cond_var_array, lw=2)
ax.set_xlabel(r'$\pi_{t-1}$')
ax.set_ylabel(r'$\sigma^{2}(\pi_{t}\vert \pi_{t-1})$')
plt.show()
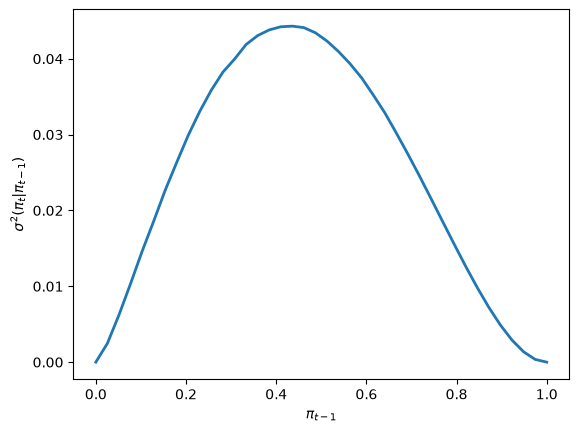
The shape of the conditional variance as a function of \(\pi_{t-1}\) is informative about the behavior of sample paths of \(\{\pi_t\}\).
Notice how the conditional variance approaches \(0\) for \(\pi_{t-1}\) near either \(0\) or \(1\).
The conditional variance is nearly zero only when the agent is almost sure that \(w_t\) is drawn from \(F\), or is almost sure it is drawn from \(G\).
The conditional variance is positive at every \(\pi_{t-1} \in (0,1)\).
Because \(\pi_t\) is a martingale, the expected sum of the conditional variances along a path is bounded:
So \(\sigma^2(\pi_t | \pi_{t-1}) \rightarrow 0\) along almost every path, and \(\pi_t\) must approach a point at which the conditional variance is zero, namely \(0\) or \(1\).
Exercise Exercise 29.2 fills in the details.
29.9. Exercises#
Exercise 29.1
Consider two ways to simulate a history \(w_0, w_1, \ldots, w_{T-1}\):
method (i): draw \(q\) once and for all with \({\rm Prob}(q = f) = \pi_{-1}\), then draw \(w_0, w_1, \ldots\) IID from \(q\)
method (ii): draw each \(w_t\) from the predictive density \(h(w_t|\pi_{t-1})\), as in
martingale_simulate
Prove that \(\prod_{s=0}^{t} h(w_s|\pi_{s-1}) = \pi_{-1} f(w^t) + (1 - \pi_{-1}) g(w^t)\), so that the two methods give the same joint distribution of \(w^t\) for every \(t\).
With \(\pi_{-1} = 0.3\), simulate \(10{,}000\) paths with each method. Compare the distributions of \(\pi_t\) at \(t = 1, 10, 100\) with two-sample Kolmogorov–Smirnov tests.
Under method (i), check that \(\pi_t\) approaches \(1\) along paths with \(q = f\) and approaches \(0\) along paths with \(q = g\).
Solution
Part 1.
Let \(D_s = \pi_{-1} f(w^s) + (1 - \pi_{-1}) g(w^s)\) for \(s \geq 0\), and let \(D_{-1} = 1\).
By (29.3), \(\pi_{s-1} = \pi_{-1} f(w^{s-1}) / D_{s-1}\) and \(1 - \pi_{s-1} = (1-\pi_{-1}) g(w^{s-1}) / D_{s-1}\).
Therefore
The product over \(s = 0, \ldots, t\) telescopes to \(D_t / D_{-1} = D_t\).
Part 2.
Both methods produce paths of log odds, and we compare log odds.
The Kolmogorov–Smirnov statistic is invariant to the increasing transformation that maps log odds into probabilities.
@jit
def draw_q_once(π_prior, rng, N, T):
    """
    Method (i). Returns log odds of π_t (column t+1 holds π_t)
    and the indicator of q = f for each path.
    """
    log_odds = np.empty((N, T+1))
    q_is_f = np.empty(N, dtype=np.bool_)
    for n in range(N):
        q_is_f[n] = rng.random() < π_prior
        log_odds[n, 0] = np.log(π_prior) - np.log(1 - π_prior)
        for t in range(T):
            if q_is_f[n]:
                w = rng.beta(F_a, F_b)
            else:
                w = rng.beta(G_a, G_b)
            log_odds[n, t+1] = update(log_odds[n, t], f(w) / g(w))
    return log_odds, q_is_f


@jit
def predictive_sampling(π_prior, rng, N, T):
    "Method (ii). Returns log odds of π_t (column t+1 holds π_t)."
    log_odds = np.empty((N, T+1))
    for n in range(N):
        log_odds[n, 0] = np.log(π_prior) - np.log(1 - π_prior)
        for t in range(T):
            π = 1 / (1 + np.exp(-log_odds[n, t]))
            if rng.random() < π:
                w = rng.beta(F_a, F_b)
            else:
                w = rng.beta(G_a, G_b)
            log_odds[n, t+1] = update(log_odds[n, t], f(w) / g(w))
    return log_odds


π_prior, N_ex, T_ex = 0.3, 10_000, 200
rng_ex = np.random.default_rng(1)
lo_i, q_is_f = draw_q_once(π_prior, rng_ex, N_ex, T_ex)
lo_ii = predictive_sampling(π_prior, rng_ex, N_ex, T_ex)

for t in [1, 10, 100]:
    res = ks_2samp(lo_i[:, t+1], lo_ii[:, t+1])
    print(f"t = {t:3d}: KS statistic = {res.statistic:.4f}, p-value = {res.pvalue:.3f}")
t =   1: KS statistic = 0.0182, p-value = 0.073
t =  10: KS statistic = 0.0143, p-value = 0.258
t = 100: KS statistic = 0.0125, p-value = 0.415
At the 5 percent level, the tests do not reject the hypothesis that the two methods produce the same distribution of \(\pi_t\).
Part 3.
π_T = expit(lo_i[:, -1])
print(f"fraction of paths with q = f: {q_is_f.mean():.4f}")
print(f"among paths with q = f, fraction with π_{T_ex-1} > 0.99: {np.mean(π_T[q_is_f] > 0.99):.4f}")
print(f"among paths with q = g, fraction with π_{T_ex-1} < 0.01: {np.mean(π_T[~q_is_f] < 0.01):.4f}")
fraction of paths with q = f: 0.3065
among paths with q = f, fraction with π_199 > 0.99: 1.0000
among paths with q = g, fraction with π_199 < 0.01: 1.0000
Under method (i), \(\pi_t\) discovers \(q\) along every simulated path, as Doob’s theorem asserts.
Exercise 29.2
Let \(\Delta_t = \pi_t - \pi_{t-1}\) for \(t \geq 0\).
Show that \(E[\Delta_t^2 \,|\, w^{t-1}] = \sigma^2(\pi_t|\pi_{t-1})\) and that
Use the martingale property to show that \(E_{-1} \sum_{s=0}^{t} \Delta_s^2 = E_{-1} \pi_t^2 - \pi_{-1}^2\). Deduce that \(E_{-1} \sum_{t=0}^{\infty} \Delta_t^2 = E_{-1} \pi_\infty^2 - \pi_{-1}^2 \leq \pi_{-1}(1 - \pi_{-1})\), with equality when \(\pi_\infty \in \{0, 1\}\) with probability one.
Verify the equality by simulation for \(\pi_{-1} = 0.3\) and \(\pi_{-1} = 0.5\).
Use parts 1 and 2 to give a second proof that \(\pi_\infty \in \{0, 1\}\) with probability one.
Solution
Part 1.
Conditional on \(w^{t-1}\), \(w_t\) has density \(h(w_t|\pi_{t-1})\) and \(E[\pi_t | w^{t-1}] = \pi_{t-1}\), so \(E[\Delta_t^2 | w^{t-1}]\) is the conditional variance \(\sigma^2(\pi_t|\pi_{t-1})\).
Write \(\pi = \pi_{t-1}\).
Then \(\pi_t - \pi = \pi f / h(w|\pi) - \pi = \pi (1 - \pi)(f - g) / h(w|\pi)\), and
The integral is positive when \(f \neq g\), so \(\sigma^2\) is positive on \((0,1)\).
A random variable with values in \([0,1]\) and mean \(\pi\) has variance at most \(\pi(1-\pi)\), so \(\sigma^2 \rightarrow 0\) as \(\pi \rightarrow 0\) or \(\pi \rightarrow 1\).
Part 2.
Since \(E[\Delta_t | w^{t-1}] = 0\),
Summing from \(0\) to \(t\) gives \(E_{-1} \sum_{s=0}^{t} \Delta_s^2 = E_{-1} \pi_t^2 - \pi_{-1}^2\).
Let \(t \rightarrow \infty\).
The left side converges by monotone convergence, and the right side converges to \(E_{-1} \pi_\infty^2 - \pi_{-1}^2\) by bounded convergence.
Because \(0 \leq \pi_\infty \leq 1\), \(\pi_\infty^2 \leq \pi_\infty\), so \(E_{-1} \pi_\infty^2 \leq E_{-1} \pi_\infty = \pi_{-1}\).
Equality holds if and only if \(\pi_\infty^2 = \pi_\infty\), that is, \(\pi_\infty \in \{0, 1\}\), with probability one.
Part 3.
for π_prior in [0.3, 0.5]:
    π_path_ex, _ = martingale_simulate(π_prior, rng_ex, N=20_000, T=500)
    sum_sq = np.sum(np.diff(π_path_ex, axis=1)**2, axis=1)
    print(f"π_-1 = {π_prior}: mean of sum of squared increments = {sum_sq.mean():.4f}, "
          f"π_-1 (1 - π_-1) = {π_prior * (1 - π_prior):.4f}")
π_-1 = 0.3: mean of sum of squared increments = 0.2094, π_-1 (1 - π_-1) = 0.2100
π_-1 = 0.5: mean of sum of squared increments = 0.2500, π_-1 (1 - π_-1) = 0.2500
Part 4.
By parts 1 and 2,
so \(\sum_{t} \sigma^2(\pi_t|\pi_{t-1}) < \infty\) and \(\sigma^2(\pi_t|\pi_{t-1}) \rightarrow 0\) with probability one.
The function \(\pi \mapsto \sigma^2\) is continuous on \([0,1]\), positive on \((0,1)\), and zero at \(0\) and \(1\).
Since \(\pi_t \rightarrow \pi_\infty\), continuity implies that \(\sigma^2\) evaluated at \(\pi_\infty\) is zero, so \(\pi_\infty \in \{0, 1\}\).
Exercise 29.3
Two Bayesians observe the same history \(w^t\) but start from different priors, \(\pi^1_{-1} = 0.2\) and \(\pi^2_{-1} = 0.8\).
Show that the difference between their log odds is the same at every date.
Show that \(\frac{1}{t+1} \log |\pi^1_t - \pi^2_t|\) converges to \(-KL(f, g)\) with probability one when nature draws from \(f\) and to \(-KL(g, f)\) with probability one when nature draws from \(g\).
Verify part 2 by simulation.
Merging of Opinions: The Blackwell–Dubins Theorem studies when the opinions of Bayesians with different priors merge in general.
Solution
Part 1.
By (29.6), each Bayesian adds the same \(\log \ell(w_{t})\) to his log odds at each date, so the difference \(c\) between their log odds equals its initial value \(\log \frac{0.2}{0.8} - \log \frac{0.8}{0.2} = -2 \log 4\).
Part 2.
Let \(x_i\) be the log odds of Bayesian \(i\), so that \(\pi^i_t = 1/(1 + e^{-x_i})\).
Direct computation gives
Since \(\log \cosh(x/2) = |x|/2 - \log 2 + o(1)\) as \(|x| \rightarrow \infty\) and \(x_i = x_i(-1) + \log L(w^t)\),
By the strong law of large numbers, \(\frac{1}{t+1} \log L(w^t)\) converges to \(KL(f, g)\) under \(f\) and to \(-KL(g, f)\) under \(g\).
Part 3.
We compute \(\log|\pi^1_t - \pi^2_t|\) from the formula in part 2.
Computing \(\pi^1_t - \pi^2_t\) directly would return zero once both probabilities round to \(1\) or to \(0\).
def log_gap(x1, x2):
    "log |expit(x1) - expit(x2)|, computed without cancellation."
    log_cosh_half = lambda x: np.logaddexp(x / 2, -x / 2) - np.log(2)
    c = x1 - x2
    return (np.log(np.abs(np.sinh(c / 2))) - np.log(2)
            - log_cosh_half(x1) - log_cosh_half(x2))

KL_fg = compute_KL(f, g)
KL_gf = compute_KL(g, f)

T_m, N_m = 200, 1000
t_m = np.arange(T_m)
fig, ax = plt.subplots()
for name, (a, b), KL in [('f', (F_a, F_b), KL_fg), ('g', (G_a, G_b), KL_gf)]:
    log_L = np.cumsum(np.log(simulate(a, b, rng_ex, T=T_m, N=N_m)), axis=1)
    gap = log_gap(logit(0.2) + log_L, logit(0.8) + log_L)
    med = np.median(gap, axis=0)
    slope = np.polyfit(t_m[50:], med[50:], 1)[0]
    ax.plot(t_m, med, lw=2, label=f'nature draws from ${name}$')
    print(f"nature draws from {name}: slope of median log gap = {slope:.3f}, "
          f"-KL = {-KL:.3f}")

ax.set_xlabel('$t$')
ax.set_ylabel(r'median of $\log|\pi^1_t - \pi^2_t|$')
ax.legend()
plt.show()
nature draws from f: slope of median log gap = -0.768, -KL = -0.759
nature draws from g: slope of median log gap = -0.344, -KL = -0.344
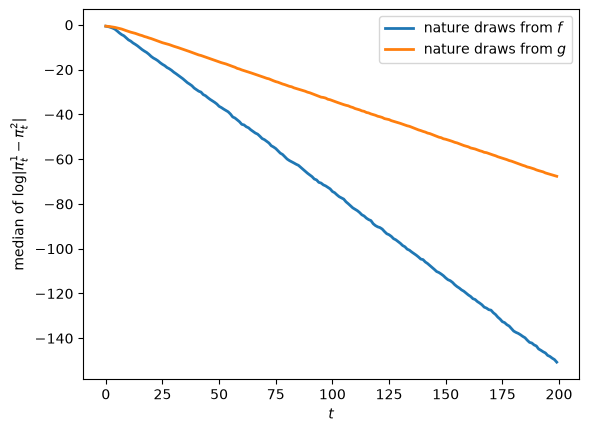
The slopes match \(-KL(f, g)\) and \(-KL(g, f)\).
The two Bayesians’ opinions merge exponentially fast, faster when nature draws from \(f\) than when nature draws from \(g\).