31. Information and Market Equilibrium#
31.1. Overview#
This lecture studies two questions about the informational role of prices posed and answered by Kihlstrom and Mirman [1975].
When do prices transmit inside information?
An informed insider observes a private signal correlated with an unknown state of the world and adjusts demand accordingly.
Equilibrium prices shift.
Under what conditions can an outside observer infer the insider’s posterior distribution from the equilibrium price?
Do Bayesian price expectations converge?
In a stationary stochastic exchange economy, an uninformed observer uses the history of market prices and Bayes’ Law to form beliefs about the economy’s structure and hence about its induced price distribution.
Do those expectations eventually agree with those of a fully informed observer?
Kihlstrom and Mirman’s answers rely on two classical ideas from statistics:
Blackwell sufficiency: a random variable \(\tilde{y}\) is said to be sufficient for a random variable \(\tilde{y}'\) with respect to an unknown state if knowing \(\tilde{y}\) gives all the information about the state that \(\tilde{y}'\) contains.
Bayesian consistency: as the sample grows, posterior beliefs eliminate models that imply the wrong price distribution, so even when structure is not identified from prices the posterior mass on the true reduced form still converges to one.
Important findings of Kihlstrom and Mirman [1975] are:
Equilibrium prices transmit inside information if and only if the map from the insider’s posterior distribution to the equilibrium price is one-to-one on the set of posteriors that can actually arise from the signal.
For the two-state case (\(S = 2\)), invertibility holds when the informed agent’s utility is homothetic and the elasticity of substitution is everywhere either below one or above one.
In the dynamic economy, as information accumulates, Bayesian price expectations converge to rational expectations, even when the deep structure is not identified from prices alone.
Note
Kihlstrom and Mirman [1975] use the terms “structure” and “reduced form” as careful econometricians do.
A structure is a complete specification of the economy’s primitives, here a parameter vector \(\lambda\).
Each structure implies a probability distribution of observable variables, here the distribution of equilibrium prices, and that distribution is the reduced form.
Several structures can imply the same reduced form.
We call the set of structures that imply the same reduced form a reduced-form class; price data identify the class but not the structure within it.
The lecture is organized as follows.
Set up the static two-commodity model and define equilibrium.
State the price-revelation theorem and the invertibility conditions.
Illustrate invertibility and its failure with numerical examples using CES and Cobb-Douglas preferences.
Introduce the dynamic stochastic economy and derive the Bayesian convergence result.
Simulate Bayesian learning from price observations.
This lecture builds on ideas in Blackwell’s Theorem on Comparing Experiments and Likelihood Ratio Processes and Bayesian Learning.
We start by importing some Python packages.
import numpy as np
import matplotlib.pyplot as plt
from scipy.optimize import brentq
from scipy.stats import norm
31.2. Setup#
31.2.1. Preferences, endowments, and the unknown state#
The economy has two goods.
Good 2 is the numeraire (price normalized to 1).
Good 1 trades at price \(p > 0\).
An unknown parameter \(\bar{a}\) affects the value of good 1.
Agent \(i\)’s expected utility from a bundle \((x_1^i, x_2^i)\) is
where \(P^i\) is agent \(i\)’s subjective probability distribution over the finite state space \(A = \{a_1, \ldots, a_S\}\).
Each agent starts with an endowment \(w^i\) of good 2 and a share \(\theta^i\) of the representative firm.
In the paper’s formal model, a single firm transforms good 2 into good 1 according to \(y_1 = f(y_2)\) with \(f' < 0\) and chooses production to maximize
The firm’s profit \(\pi\) is then distributed to households according to the shares \(\theta^i\).
Agent \(i\)’s budget constraint is
Agents maximize expected utility subject to their budget constraints.
A competitive equilibrium is a price \(\hat{p}\) that clears both markets simultaneously.
Under the maintained convexity assumptions equilibrium exists, and following Kihlstrom and Mirman [1975] we assume the equilibrium price is unique.
We write \(\hat p = p(\mu, P^2, \ldots, P^n)\) for the equilibrium price when agent 1 holds beliefs \(\mu\) and the other agents hold beliefs \(P^2, \ldots, P^n\).
The beliefs \(P^2, \ldots, P^n\) stay fixed throughout the static analysis, so we abbreviate the price function to \(p(\mu)\).
For most of what follows, the production side matters only through the induced equilibrium price map, so when we turn to numerical illustrations we will suppress production and use a pure-exchange / portfolio interpretation to keep the calculations transparent.
31.2.2. The informed agent’s problem#
Suppose agent 1 (the insider) observes a private signal \(\tilde{y}\) correlated with \(\bar{a}\) before trading, where \(\tilde{y}\) takes values in a finite set \(Y\).
Before the signal arrives, agent 1 has prior beliefs \(\mu_0 = P^1\).
Upon observing \(\tilde{y} = y\), agent 1 updates to the posterior \(\mu_y = (\mu_{y1}, \ldots, \mu_{yS})\) via Bayes’ rule:
Because agent 1’s demand depends on \(\mu_y\), the new equilibrium price satisfies
Outside observers who see \(\hat{p}\) but not \(\tilde{y}\) can try to back out the insider’s posterior from the price.
Define the set of realized posteriors
The key question is whether the map \(\mu \mapsto p(\mu)\) is one-to-one on \(M\).
To answer that question, we now translate “information in prices” into Blackwell’s language of sufficiency.
31.3. Price revelation#
31.3.1. Blackwell sufficiency#
The price variable \(p(\mu_{\tilde{y}})\) accurately transmits the insider’s private information if observing the equilibrium price is just as informative about \(\bar{a}\) as observing the signal \(\tilde{y}\) directly.
In Blackwell’s language (Blackwell [1951] and Blackwell [1953]), this means \(p(\mu_{\tilde{y}})\) is sufficient for \(\tilde{y}\).
Definition 31.1 (Sufficiency)
A random variable \(\tilde{y}\) is sufficient for \(\tilde{y}'\) with respect to \(\bar{a}\) if there exists a conditional distribution \(P(y' \mid y)\), independent of \(\bar{a}\), such that
where \(\phi_a(y) = P(\tilde{y} = y \mid \bar{a} = a)\).
Thus, once \(\tilde{y}\) is known, \(\tilde{y}'\) provides no additional information about \(\bar{a}\).
This is the garbling relation of Definition 30.1 in Blackwell’s Theorem on Comparing Experiments: the likelihoods \(\phi_a(y)\) form the more informative experiment, the likelihoods \(\phi'_a(y')\) form its garbling, and \(P(y' \mid y)\) is the Markov matrix \(Q\).
Kihlstrom and Mirman [1975] show that
Lemma 31.1 (Posterior Sufficiency)
The posterior distribution \(\mu_{\tilde{y}}\) is a sufficient statistic for \(\tilde{y}\).
Proof. (Sketch) The posterior \(\mu_{\tilde{y}}\) satisfies
This identity says that once the posterior is known, conditioning on the original signal \(\tilde y\) does not change beliefs about \(\bar a\).
Equivalently, the conditional law of \(\tilde y\) given \(\mu_{\tilde y}\) is independent of \(\bar a\), so \(\mu_{\tilde y}\) is sufficient for \(\tilde y\) in Blackwell’s sense.
The lemma is Kihlstrom’s standard-experiment point, described under “Posteriors and standard experiments” in Blackwell’s Theorem on Comparing Experiments: replacing each signal by the posterior it induces loses no information about \(\bar a\).
Now let’s think about the mapping from belief to price.
Theorem 31.1 (Price Revelation)
In the model outlined above, the price random variable \(p(\mu_{\tilde{y}})\) is sufficient for the random variable \(\tilde{y}\) if and only if the function \(p(\cdot)\) is invertible on the set of prices
The logic is
The first arrow loses no information about \(\bar a\) by Lemma 31.1, and the theorem asks when the second arrow also loses no information.
The proof has two parts.
If \(p(\cdot)\) is one-to-one on \(M\), then observing the price is equivalent to observing the posterior itself because
This conditional distribution is independent of the state, so price is sufficient for the posterior; together with Lemma 31.1, price is therefore sufficient for the signal.
Conversely, suppose that two different posteriors \(\mu_y \neq \mu_{y'}\) in \(M\) generate the same price \(p\).
Conditional on that price, an observer’s posterior about \(\bar a\) is a mixture, with positive weights, of the posteriors \(\mu_z\) for which \(p(\mu_z) = p\).
A mixture with positive weight on two different posteriors cannot equal both of them, so learning \(\tilde y\) after seeing \(p\) would change the observer’s beliefs about \(\bar a\) for at least one of \(y\) and \(y'\).
The price is therefore not sufficient for \(\tilde y\).
Before turning to invertibility itself, it helps to keep in mind the two economic interpretations emphasized in the paper.
31.3.2. Two interpretations#
31.3.2.1. Insider trading in a stock market#
Good 1 is a risky asset with random return \(\bar{a}\); good 2 is “money”.
An insider’s demand reveals private information about the return.
If the invertibility condition holds, outside observers can read the insider’s posterior distribution – the useful information the insider’s signal carries about \(\bar a\) – from the equilibrium stock price.
31.3.2.2. Price as a quality signal#
Good 1 has uncertain quality \(\bar{a}\).
Experienced consumers (who have sampled the good) observe a signal correlated with quality and buy accordingly.
Uninformed consumers can infer quality from the market price, provided invertibility holds.
31.3.3. Uninformed traders who learn from prices#
Kihlstrom and Mirman’s uninformed traders hold fixed beliefs \(P^2, \ldots, P^n\) and do not learn from the price.
Theorem 31.1 describes what an outside observer who knows the map \(p(\cdot)\) could infer.
If the uninformed traders themselves knew \(p(\cdot)\) and conditioned on the price, their beliefs and demands would depend on the price, and equilibrium would become a rational expectations equilibrium.
Grossman [1976] constructs a rational expectations equilibrium in which the price fully reveals the informed traders’ information.
Radner [1979] shows that with finitely many states fully revealing rational expectations equilibria exist generically.
Grossman and Stiglitz [1980] add a cost of acquiring information.
If the price revealed everything, no trader would pay for information; if no trader paid for information, the price would have nothing to reveal.
They resolve the paradox with a noisy supply of the risky asset, which makes the price reveal information only partially.
Rational Learning and Rational Expectations studies Bayesian traders who learn from prices inside a rational expectations equilibrium.
31.4. Invertibility and the elasticity of substitution#
When does the belief-to-price map fail to be invertible?
Theorem 31.2 shows that for a two-state economy (\(S = 2\)), the answer depends on the elasticity of substitution \(\sigma\) of agent 1’s utility function.
Before stating the theorem, it helps to see the two intermediate steps in the paper’s argument.
Lemma 31.2 (Same Price Implies Same Allocation)
Assume that \(u^i\) has continuous first partial derivatives and that \(u^i\) is strictly quasi-concave.
Let \(p \in \mathcal{P}\).
If there exist two measures \(\mu^*\) and \(\mu'\) in \(M\) such that \(p(\mu^*) = p(\mu') = p\), then
where \(x^i(\mu)\) is trader \(i\)’s equilibrium bundle when agent 1’s beliefs are \(\mu\) and the other agents’ beliefs are \(P^2, \ldots, P^n\).
Fix the beliefs of all agents except agent 1.
The lemma says that if two posterior beliefs \(\mu^*\) and \(\mu'\) for agent 1 both support the same equilibrium price \(p\), then they support the same equilibrium allocation for every trader.
The intuition is that when the price is unchanged, the demands of the uninformed traders are unchanged too, so market clearing forces the informed agent’s bundle to be unchanged as well.
Strict quasi-concavity makes each trader’s demand a single-valued function of the price, and the uninformed traders’ beliefs \(P^2, \ldots, P^n\) do not move with the price.
This lemma lets us define the informed agent’s equilibrium bundle as a function of price alone:
Throughout, \(u^i_j\) denotes the partial derivative of \(u^i\) with respect to its \(j\)-th argument.
Whenever the informed agent consumes positive amounts of both goods, optimality of \(x(p)\) under posterior \(\mu\) gives the interior first-order condition
For a fixed price \(p\), the bundle \(x(p)\) is fixed too, so invertibility boils down to whether this equation admits a unique posterior \(\mu\).
Lemma 31.3 (Unique Posterior at a Given Price)
Assume that the first partial derivatives of \(u^1\) exist and that \(u^1\) is strictly quasi-concave.
Also assume that agent 1 always consumes positive quantities of both goods.
Then \(p(\cdot)\) is invertible on \(\mathcal{P}\) if for each \(p \in \mathcal{P}\) there exists a unique probability measure \(\mu \in M\) such that
If two different posteriors gave the same price, then by Lemma 31.2 they would share the same bundle \(x(p)\), contradicting uniqueness of the posterior that solves the first-order condition at that price.
31.4.1. The two-state first-order condition#
With \(S = 2\) and \(\mu = (q,\, 1-q)\), define
Then the first-order condition becomes
At a fixed price \(p\), the quantities \(\alpha_s(p)\) and \(\beta_s(p)\) are constants, so uniqueness of the posterior is the same as uniqueness of the scalar \(q\) solving this equation.
Theorem 31.2 (Invertibility Conditions)
Assume that the first partial derivatives of \(u^1\) exist and that \(u^1\) is quasi-concave and homothetic.
Also suppose that the informed agent always consumes positive quantities of both goods in all equilibrium allocations.
If \(S = 2\) and the elasticity of substitution of \(u^1\) is either always less than one or always greater than one, then \(p(\cdot)\) is invertible on \(\mathcal{P}\).
If \(u^1\) is Cobb-Douglas (elasticity of substitution constant and equal to one), then \(p(\cdot)\) is constant on \(M\).
When \(\sigma = 1\) the income and substitution effects exactly cancel, so agent 1’s demand for good 1 does not respond to changes in beliefs about \(\bar{a}\).
Because the demand is unchanged, the market-clearing price is unchanged too, and the price reveals nothing about the insider’s signal.
31.4.2. CES utility#
For concreteness we work with a simplified example with the constant-elasticity-of-substitution (CES) utility function
whose elasticity of substitution is \(\sigma = 1/(1-\rho)\).
\(\rho \to 0\): Cobb-Douglas (\(\sigma = 1\)), \(u \to \sqrt{c_1 c_2}\).
\(\rho < 0\): \(\sigma < 1\) (complements).
\(0 < \rho < 1\): \(\sigma > 1\) (substitutes).
The factor \(1/2\) inside the parentheses makes \(u\) converge to \(\sqrt{c_1 c_2}\) as \(\rho \to 0\); without it, \(u\) diverges as \(\rho \downarrow 0\) and vanishes as \(\rho \uparrow 0\).
The factor rescales \(u_1\) and \(u_2\) by a common constant, so it does not affect marginal rates of substitution or prices.
Pertinent partial derivatives are
This CES example is only an illustration, because the theorem itself covers any homothetic utility with elasticity everywhere above one or everywhere below one.
With that example in hand, we can compute the equilibrium price directly as a function of the posterior.
31.4.3. Equilibrium price as a function of the posterior#
We suppress production.
Uninformed traders own one unit of good 1, have no use for it, and sell it at any positive price, so at equilibrium agent 1 absorbs the unit and \(x_1 = 1\).
Agent 1 owns \(W_1\) units of good 2 and no shares of the firm (\(\theta^1 = 0\)), so his wealth \(W_1 = w^1\) does not depend on \(p\).
Agent 1’s budget constraint then reduces to \(x_2 = W_1 - p\), and the equilibrium price is the unique \(p \in (0, W_1)\) satisfying the first-order condition
For Cobb-Douglas utility (\(\sigma = 1\)), the first-order condition becomes \(p = W_1 - p\), giving \(p^* = W_1/2\) regardless of the posterior \(q\), confirming that no information is transmitted through the price in the Cobb-Douglas case.
We compute first-order conditions numerically below.
def ces_derivatives(c1, c2, ρ):
    """
    Return CES marginal utilities.

    Use the Cobb-Douglas limit near rho = 0.
    """
    if abs(ρ) < 1e-4:
        u1 = 0.5 * np.sqrt(c2 / c1)
        u2 = 0.5 * np.sqrt(c1 / c2)
    else:
        common = 0.5 * ((c1**ρ + c2**ρ) / 2)**(1 / ρ - 1)
        u1 = common * c1**(ρ - 1)
        u2 = common * c2**(ρ - 1)
    return u1, u2


def eq_price(q, a1, a2, W1, ρ):
    """Return the equilibrium price for posterior q."""
    def residual(p):
        x2 = W1 - p
        u1_s1, u2_s1 = ces_derivatives(a1, x2, ρ)
        u1_s2, u2_s2 = ces_derivatives(a2, x2, ρ)
        lhs = p * (q * u2_s1 + (1 - q) * u2_s2)
        rhs = q * a1 * u1_s1 + (1 - q) * a2 * u1_s2
        return lhs - rhs

    try:
        return brentq(residual, 1e-6, W1 - 1e-6, xtol=1e-10)
    except ValueError:
        return np.nan
a1, a2 = 2.0, 0.5     # state values (a1 > a2)
W1 = 4.0

q_grid = np.linspace(0.05, 0.95, 200)

ρ_values = [-0.5, 0.0, 0.5]
ρ_labels = [
    r"$\rho = -0.5$ ($\sigma = 0.67$, complements)",
    r"$\rho = 0$ ($\sigma = 1$, Cobb-Douglas)",
    r"$\rho = 0.5$ ($\sigma = 2$, substitutes)",
]

fig, ax = plt.subplots(figsize=(8, 5))

for ρ, label in zip(ρ_values, ρ_labels):
    prices = [eq_price(q, a1, a2, W1, ρ) for q in q_grid]
    ax.plot(q_grid, prices, label=label, lw=2)

ax.set_xlabel(r"posterior probability $q = \Pr(\bar{a} = a_1)$", fontsize=12)
ax.set_ylabel("equilibrium price $p^*(q)$", fontsize=12)
ax.legend(fontsize=10)
plt.tight_layout()
plt.show()
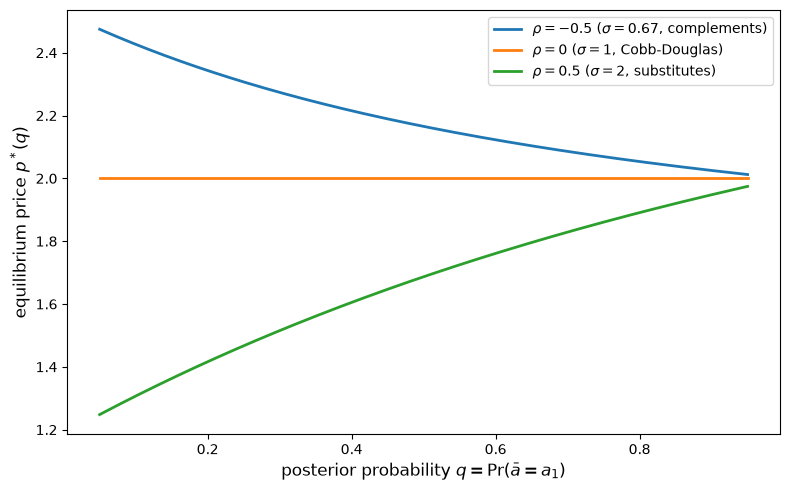
Fig. 31.1 equilibrium price vs posterior#
The plot confirms Theorem 31.2.
For CES with \(\sigma \neq 1\), the equilibrium price is strictly monotone in \(q\).
The price falls with \(q\) when \(\sigma < 1\) and rises with \(q\) when \(\sigma > 1\).
When the goods are complements, good news about \(\bar a\) lowers the price: a higher \(a_s\) lowers the marginal rate of substitution \(a_s u_1 / u_2\) (see Why monotonicity depends on \sigma), so the insider values the unit of good 1 less.
An outside observer who knows the equilibrium map \(p^*(\cdot)\) can therefore invert the price uniquely to recover \(q\), so the inside information is fully transmitted.
For Cobb-Douglas (\(\sigma = 1\)), the price is flat in \(q\), so information is never transmitted through the market.
p_cd = [eq_price(q, a1, a2, W1, ρ=0.0) for q in q_grid]

print(f"Cobb-Douglas (rho=0): min p* = {min(p_cd):.6f}, "
      f"max p* = {max(p_cd):.6f}, "
      f"range = {max(p_cd)-min(p_cd):.2e}")
print(f"Analytical CD price  = W1/2 = {W1/2:.6f}")
Cobb-Douglas (rho=0): min p* = 2.000000, max p* = 2.000000, range = 8.88e-16
Analytical CD price  = W1/2 = 2.000000
Every entry equals \(W_1/2 = 2.0\) up to rounding error, confirming numerically that the Cobb-Douglas equilibrium price is independent of \(q\) and of the state values \(a_1, a_2\).
The numerical plot shows monotonicity, and the next subsection connects that pattern back to the proof of Theorem 31.2.
31.4.4. Why monotonicity depends on \(\sigma\)#
Fix a price \(p\) and treat \(\alpha_s(p)\) and \(\beta_s(p)\) as constants.
The right-hand side of the two-state first-order condition
is then a function of \(q\) alone, with derivative
So the sign is determined by \(\alpha_1 \beta_2 - \alpha_2 \beta_1\), and if that sign is constant then for each fixed price there is at most one posterior weight \(q\) consistent with the first-order condition, which is exactly what Theorem 31.2 requires.
Using
one can show
For the CES specification, this derivative is positive when \(\sigma > 1\), negative when \(\sigma < 1\), and zero when \(\sigma = 1\).
In other words, for CES utility the ratio \(\alpha_s / \beta_s\) moves monotonically with the state value \(a_s\) unless \(\sigma = 1\), which makes the fixed-price first-order-condition expression monotone in \(q\) and in turn delivers invertibility.
The vanishing derivative in the Cobb-Douglas case means the marginal rate of substitution is independent of \(a_s\), so the informed agent’s demand, and hence the equilibrium price, does not respond to changes in beliefs.
Let us visualize the ratio \(\alpha_s / \beta_s\) as a function of \(a_s\) for different values of \(\sigma\):
a_vals = np.linspace(0.3, 3.0, 300)
x1_fix, x2_fix = 1.0, 1.0

fig, ax = plt.subplots(figsize=(7, 4))
for ρ in [-0.5, -1e-6, 0.5]:
    σ = 1 / (1 - ρ) if abs(ρ) > 1e-8 else 1.0
    ratios = []
    for a in a_vals:
        u1, u2 = ces_derivatives(a * x1_fix, x2_fix, ρ)
        ratios.append(a * u1 / u2)
    ax.plot(a_vals, ratios, label=rf"$\sigma = {σ:.2f}$", lw=2)

ax.set_xlabel(r"state value $a_s$", fontsize=12)
ax.set_ylabel(r"$\alpha_s / \beta_s = a_s u_1 / u_2$", fontsize=12)
ax.axhline(y=1.0, color="black", lw=0.8, ls="--")
ax.legend(fontsize=10)
plt.tight_layout()
plt.show()
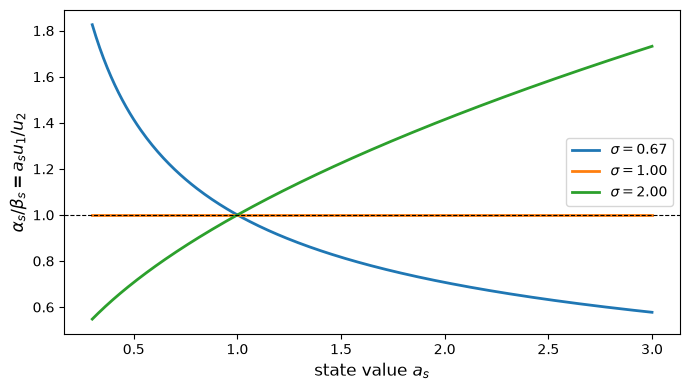
Fig. 31.2 marginal rate of substitution#
When \(\sigma = 1\) the ratio is constant across all \(a_s\) values, so information about the state has no effect on the marginal rate of substitution.
For \(\sigma < 1\) the ratio is decreasing in \(a_s\), and for \(\sigma > 1\) it is increasing, making the equilibrium price strictly monotone in the posterior \(q\) in both cases.
The static analysis asks whether a current price reveals current private information, whereas the next section asks what a whole history of prices reveals over time.
31.5. Bayesian price expectations in a dynamic economy#
We now turn to a question addressed in Section 3 of Kihlstrom and Mirman [1975].
31.5.1. A stochastic exchange economy#
Time is discrete: \(t = 1, 2, \ldots\)
In each period \(t\):
Consumer \(i\) receives a random endowment \(\omega_i^t\).
Markets open; competitive prices \(p^t = p(\omega^t)\) clear all markets.
Consumers trade and consume.
The structural parameter vector \(\lambda = (\lambda_1, \ldots, \lambda_K)\) is fixed but unknown; it takes values in a finite or countable set \(\Lambda \subset \mathbb{R}^K\).
Conditional on \(\lambda\), the endowment vectors \(\{\tilde{\omega}^t\}\) are i.i.d. with density \(f(\omega^t \mid \lambda)\).
The equilibrium price at time \(t\) is a deterministic function of \(\omega^t\), so conditional on \(\lambda\) the prices \(\{p^t\}\) are also i.i.d.
An observer who does not know \(\lambda\) and puts a prior over \(\Lambda\) regards the price sequence as exchangeable, a mixture of i.i.d. sequences, as in Exchangeability and Bayesian Updating.
Let \(P_\lambda\) denote the probability distribution of \(\{\omega^t, p^t\}_{t \geq 1}\) under structure \(\lambda\).
For any measurable set of prices \(B\), let
Then
The induced price density is denoted by \(g(p^t \mid \lambda)\).
For a given structure \(\lambda\), this density is the observable implication of the model, and when several structures imply the same density we group them into a single reduced-form class.
The next issue is therefore what an observer can and cannot infer about the structure from price data alone.
31.5.2. The identification problem#
Because price observations identify only the induced price density \(g(\cdot \mid \lambda)\), and because the structural-to-reduced-form map \(\lambda \mapsto g(\cdot \mid \lambda)\) may be many-to-one, price data may identify only a reduced-form class rather than the exact structure.
In particular, it may be impossible to recover \(\lambda\) from \(g(p \mid \lambda)\) even with infinite price data.
To handle this, partition \(\Lambda\) into equivalence classes \(\eta\) such that \(\lambda \in \eta\) and \(\lambda' \in \eta\) whenever \(g(p \mid \lambda) = g(p \mid \lambda')\) for all \(p\).
We use \(\eta\) for reduced-form classes to keep \(\mu\) for the insider’s posterior in the static model.
The equivalence class \(\eta\) containing the true \(\lambda\) is the reduced form relevant for price data.
An observer who knows the infinite price history learns \(\eta\) but not necessarily \(\lambda\).
Once that distinction is clear, Bayesian updating can be written down directly.
31.5.3. Bayesian updating#
An uninformed observer begins with a prior \(h(\lambda)\) over \(\lambda \in \Lambda\).
If the observer could see endowments directly, the posterior would be
and the paper appeals to a Bayesian consistency result to conclude that this posterior concentrates on the true structure \(\bar \lambda\).
That conclusion requires \(h(\bar\lambda) > 0\) and identification of the structure from endowments: \(f(\cdot \mid \lambda) \neq f(\cdot \mid \lambda')\) whenever \(\lambda \neq \lambda'\).
After observing the price sequence \((p^1, \ldots, p^t)\), the observer’s Bayesian posterior is
Price data cannot distinguish structures inside the same reduced-form class.
Indeed, if \(\lambda\) and \(\lambda'\) belong to the same class \(\eta\), then \(g(\cdot \mid \lambda) = g(\cdot \mid \lambda')\), so
for every sample history, so the relative odds within an observationally equivalent class never change.
At time \(t\), the observer’s price expectations for the next period are
31.5.4. The convergence theorem#
Theorem 31.3 (Bayesian Convergence)
Let \(\bar\lambda\) be the true structural parameter and \(\bar\eta\) the reduced form that contains \(\bar\lambda\).
Assume the prior assigns positive probability to the reduced-form class \(\bar\eta\).
Define the posterior mass on a reduced-form class by
Because all structures inside a class imply the same \(g(\cdot \mid \lambda)\), the predictive density can equivalently be written as
Then
with \(P_{\bar\lambda}\)-probability one.
Consequently,
where \(g(\cdot \mid \bar\eta)\) is the rational-expectations price distribution for a fully informed observer.
Note
The theorem only requires the prior to assign positive probability to the reduced-form class \(\bar\eta\) that contains the true structure \(\bar\lambda\).
This is the absolute-continuity condition of Merging of Opinions: The Blackwell–Dubins Theorem, explained below.
It is implied by, but weaker than, assigning positive probability to the true structural parameter \(\bar\lambda\) itself.
A prior could place zero mass on \(\bar\lambda\) while still placing positive mass on other structures inside \(\bar\eta\).
The important distinction is that price observers need not learn \(\bar \lambda\) itself.
They only learn which reduced-form class is correct.
That is enough for forecasting because every \(\lambda \in \bar \eta\) generates the same price density \(g(\cdot \mid \bar \eta)\).
Rational price expectations emerge from learning the reduced form, not from identifying every structural detail of the economy.
Here “rational expectations” means that the observer’s predictive distribution for next period’s price matches the objective price distribution generated by the true reduced form.
31.5.5. Connection to merging of opinions#
Theorem 31.3 is an instance of the merging theorem of Blackwell and Dubins [1962] studied in Merging of Opinions: The Blackwell–Dubins Theorem.
Let \(Q^*\) denote the distribution of the price sequence under the true structure, \(P_{\bar\lambda}\), and let \(P\) denote its distribution under the observer’s subjective mixture \(\sum_{\lambda} h(\lambda) P_\lambda\).
Every structure in \(\bar\eta\) induces the same distribution \(Q^*\) of prices, so \(P(A) \geq H_0(\bar\eta)\, Q^*(A)\) for every event \(A\), where \(H_0(\bar\eta) = \sum_{\lambda \in \bar\eta} h(\lambda)\).
Hence \(Q^*(A) \leq P(A) / H_0(\bar\eta)\), and \(Q^* \ll P\) whenever \(H_0(\bar\eta) > 0\).
Theorem 34.1 then implies that, \(Q^*\)-almost surely, the observer’s conditional distribution of the entire future price sequence merges in total variation with the true one.
For a class \(\eta \neq \bar\eta\), prices are i.i.d. with a density \(g(\cdot \mid \eta)\) that differs from \(g(\cdot \mid \bar\eta)\).
Theorem 34.2 then makes the two distributions of the price sequence mutually singular, and the likelihood ratio \(\prod_{\tau=1}^t g(p^\tau \mid \eta) / g(p^\tau \mid \bar\eta)\) converges to zero \(Q^*\)-almost surely.
With finitely many classes this gives \(H_t(\bar\eta) \to 1\).
Exercise 31.5 shows that the merging distance for the entire future equals \(1 - H_t(\bar\eta)\), so Blackwell and Dubins’s theorem delivers \(H_t(\bar\eta) \to 1\) with countably many classes as well.
Let’s now turn to a simple simulation.
31.6. Simulating Bayesian learning from prices#
We illustrate the theorem with a two-model example.
Two possible reduced forms \(\eta_1\) and \(\eta_2\) generate prices \(p^t \sim N(\bar{p}_i, \sigma_p^2)\) for \(i = 1, 2\) respectively.
The observer knows the two possible price distributions (the reduced forms) but not which one governs the data.
This is a Bayesian model selection problem we have seen in Likelihood Ratio Processes and Bayesian Learning.
With a prior \(h_0\) on \(\eta_1\) and the observed price \(p^t\), the posterior weight on \(\eta_1\) after period \(t\) is
We consider a numerical example with two normal distributions with different means
def simulate_bayesian_learning(
    p_bar_true, p_bar_alt, σ_p, T, h0, n_paths, seed=42
):
    """Simulate posterior learning between two Gaussian reduced forms."""
    rng = np.random.default_rng(seed)
    h_paths = np.zeros((n_paths, T + 1))
    h_paths[:, 0] = h0

    for path in range(n_paths):
        h = h0
        prices = rng.normal(p_bar_true, σ_p, size=T)
        for t, p in enumerate(prices):
            g_true = norm.pdf(p, loc=p_bar_true, scale=σ_p)
            g_alt = norm.pdf(p, loc=p_bar_alt, scale=σ_p)
            denom = h * g_true + (1 - h) * g_alt
            h = h * g_true / denom
            h_paths[path, t + 1] = h

    return h_paths


def plot_bayesian_learning(h_paths, p_bar_true, p_bar_alt, ax):
    """Plot posterior beliefs over time."""
    T = h_paths.shape[1] - 1
    t_grid = np.arange(T + 1)

    for path in h_paths:
        ax.plot(t_grid, path, alpha=0.25, lw=0.8, color="steelblue")

    median_path = np.median(h_paths, axis=0)
    ax.plot(t_grid, median_path, color="navy", lw=2, label="median posterior")

    ax.axhline(
        y=1.0,
        color="black",
        ls="--",
        lw=1.2,
        label="true model weight = 1",
    )
    ax.set_xlabel("period $t$", fontsize=12)
    ax.set_ylabel(r"$h_t$ = posterior weight on true model", fontsize=12)
    ax.legend(fontsize=10)
We consider two cases, one that is easy to learn and another one that is harder to learn, using \(T = 300\) periods, \(n = 40\) simulated paths, a diffuse prior \(h_0 = 0.5\), and common standard deviation \(\sigma_p = 0.4\).
Easy case: true model \(N(2.0,\, 0.4^2)\), alternative \(N(1.2,\, 0.4^2)\).
Hard case: true model \(N(2.0,\, 0.4^2)\), alternative \(N(1.8,\, 0.4^2)\).
Whether easy or hard to learn depends on “how close” the true distribution is compared to the alternative hypothesis, as measured by the Kullback–Leibler divergence of Statistical Divergence Measures (Exercise 31.2).
T = 300
h0 = 0.5     # diffuse prior
n_paths = 40
σ_p = 0.4

fig, axes = plt.subplots(1, 2, figsize=(12, 5))

# Distinct reduced forms
p_bar_true, p_bar_alt = 2.0, 1.2
h_paths = simulate_bayesian_learning(p_bar_true, p_bar_alt, σ_p, T, h0, n_paths)
plot_bayesian_learning(h_paths, p_bar_true, p_bar_alt, axes[0])

# Similar reduced forms
p_bar_true, p_bar_alt = 2.0, 1.8
h_paths_hard = simulate_bayesian_learning(
    p_bar_true, p_bar_alt, σ_p, T, h0, n_paths
)
plot_bayesian_learning(h_paths_hard, p_bar_true, p_bar_alt, axes[1])

plt.tight_layout()
plt.show()
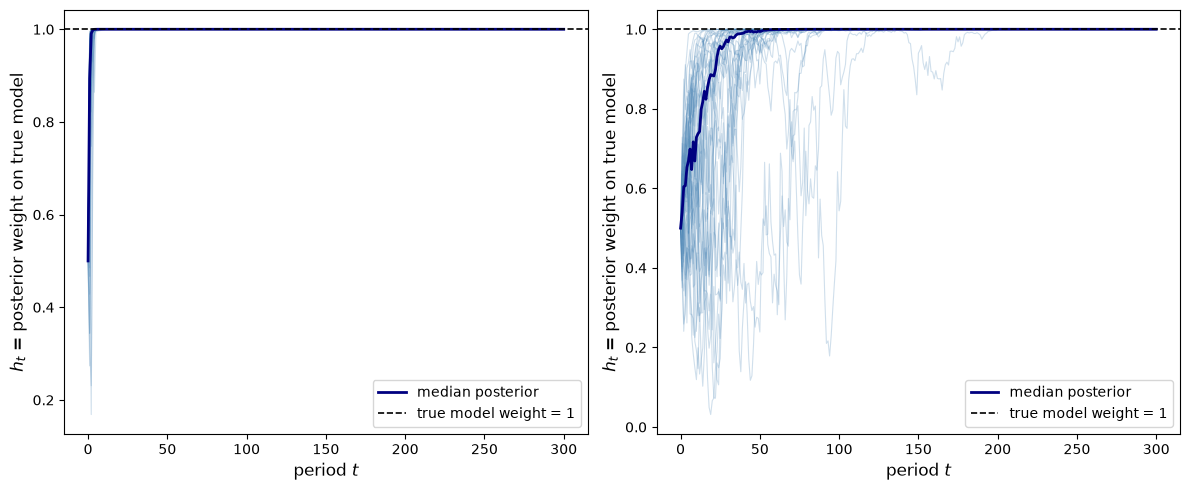
Fig. 31.3 bayesian learning across paths#
In both panels the posterior weight on the true model converges to 1 with probability one, though convergence is slower when the two price distributions are similar (right panel).
31.6.1. Price expectations vs. rational expectations#
We now verify that the observer’s price expectations converge to the rational-expectations distribution \(g(p \mid \bar\eta)\).
We use the parameterization of the “hard-to-learn” example above (\(\bar{p}_{\text{true}} = 2.0\), \(\bar{p}_{\text{alt}} = 1.8\), \(\sigma_p = 0.4\)), extending to \(T = 1{,}000\) periods with a single simulated path and prior \(h_0 = 0.5\)
def price_expectation(h_t, p_bar_true, p_bar_alt, σ_p, p_grid):
    """Return the predictive price density at posterior weight h_t."""
    return (
        h_t * norm.pdf(p_grid, loc=p_bar_true, scale=σ_p)
        + (1 - h_t) * norm.pdf(p_grid, loc=p_bar_alt, scale=σ_p)
    )


p_bar_true, p_bar_alt = 2.0, 1.8
σ_p = 0.4
n_paths = 1
T_long = 1000

h_paths_long = simulate_bayesian_learning(
    p_bar_true, p_bar_alt, σ_p, T_long, h0=0.5, n_paths=n_paths, seed=7
)

p_grid = np.linspace(0.0, 3.5, 300)
re_density = norm.pdf(p_grid, loc=p_bar_true, scale=σ_p)

fig, ax = plt.subplots(figsize=(8, 5))
snapshots = [0, 25, 100, 300, 1000]
palette   = plt.cm.Blues(np.linspace(0.3, 1.0, len(snapshots)))

for t_snap, col in zip(snapshots, palette):
    h_t = h_paths_long[0, t_snap]
    dens = price_expectation(h_t, p_bar_true, p_bar_alt, σ_p, p_grid)
    ax.plot(
        p_grid,
        dens,
        color=col,
        lw=2,
        label=rf"$t = {t_snap}$, $h_t = {h_t:.3f}$",
    )

ax.plot(p_grid, re_density, "k--", lw=2,
        label=r"rational expectations $g(p \mid \bar{\eta})$")
ax.set_xlabel("price $p$", fontsize=12)
ax.set_ylabel("density", fontsize=12)
ax.legend(fontsize=9)
plt.tight_layout()
plt.show()
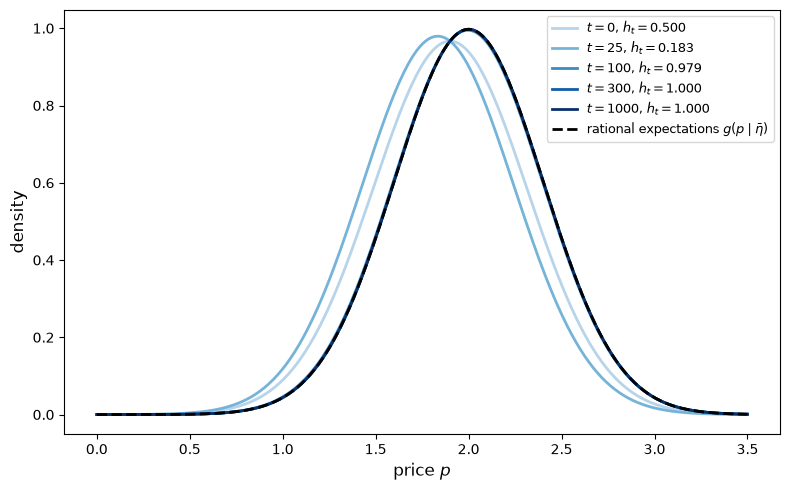
Fig. 31.4 price distribution convergence#
The sequence of predictive densities (shades of blue) converges to the rational-expectations density (dashed black line) as experience accumulates.
Convergence need not be monotone.
On this path \(h_{25} = 0.183\), below the prior \(h_0 = 0.5\), before \(h_t\) rises toward one, because the log posterior odds follow a random walk whose positive drift dominates only in long samples.
This illustrates Theorem 31.3.
We can now sharpen the point by looking at a case in which the reduced form is learned but the underlying structure is not.
31.6.2. Learning the reduced form without identifying the structure#
The convergence result is particularly striking because the observer converges to rational expectations even when the underlying structure \(\lambda\) is not identified by prices.
To illustrate this, consider a case with three possible structures \(\lambda^{(1)}, \lambda^{(2)}, \lambda^{(3)}\) but only two reduced forms \(\eta_1 = \{\lambda^{(1)}, \lambda^{(2)}\}\) and \(\eta_2 = \{\lambda^{(3)}\}\) (because \(\lambda^{(1)}\) and \(\lambda^{(2)}\) generate the same price distribution).
We continue with the hard-to-learn parameterization, so the three structures have price means \(\bar{p}_1 = \bar{p}_2 = 2.0\) and \(\bar{p}_3 = 1.8\), with common standard deviation \(\sigma_p = 0.4\), a uniform prior \(h_0 = (1/3, 1/3, 1/3)\), and \(T = 400\) periods over \(30\) paths.
The true structure is \(\lambda^{(1)}\).
def simulate_learning_3struct(
    T, h0_vec, p_bar_vec, σ_p, true_idx, n_paths, seed=0
):
    """Simulate learning with three structures and two reduced forms."""
    rng = np.random.default_rng(seed)
    h_paths = np.zeros((n_paths, T + 1, 3))
    h_paths[:, 0, :] = h0_vec

    for path in range(n_paths):
        h = np.array(h0_vec, dtype=float)
        prices = rng.normal(p_bar_vec[true_idx], σ_p, size=T)
        for t, p in enumerate(prices):
            likelihoods = norm.pdf(p, loc=p_bar_vec, scale=σ_p)
            h = h * likelihoods
            h /= h.sum()
            h_paths[path, t + 1, :] = h

    return h_paths


# Structures 0 and 1 share the same reduced form
p_bar_vec = np.array([2.0, 2.0, 1.8])
h0_vec = np.array([1 / 3, 1 / 3, 1 / 3])
σ_p = 0.4
T = 400
true_idx = 0     # Structure 0 is observationally equivalent to 1

h_paths_3 = simulate_learning_3struct(
    T, h0_vec, p_bar_vec, σ_p, true_idx, n_paths=30
)
t_grid = np.arange(T + 1)

fig, axes = plt.subplots(1, 3, figsize=(13, 4), sharey=True)
struct_labels = [
    r"$\lambda^{(1)}$",
    r"$\lambda^{(2)}$",
    r"$\lambda^{(3)}$",
]

for k, (ax, label) in enumerate(zip(axes, struct_labels)):
    for path in h_paths_3:
        ax.plot(t_grid, path[:, k], alpha=0.25, lw=0.8, color="steelblue")
    ax.plot(t_grid, np.median(h_paths_3[:, :, k], axis=0),
            color="navy", lw=2, label=f"median weight on {label}")
    ax.set_xlabel("period $t$", fontsize=11)
    ax.legend(fontsize=9)

axes[0].set_ylabel("posterior weight", fontsize=11)
plt.tight_layout()
plt.show()
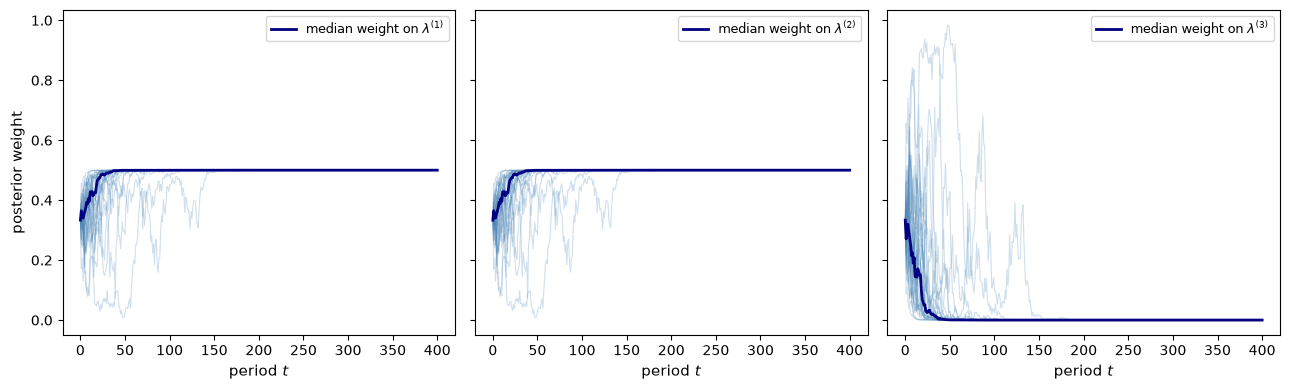
Fig. 31.5 learning with non-identification#
The observer correctly rules out \(\lambda^{(3)}\) (the wrong reduced form) with probability one, but cannot distinguish \(\lambda^{(1)}\) from \(\lambda^{(2)}\) because they generate an identical price distribution.
Nevertheless, the observer’s price expectations converge to rational expectations because both structures imply the same reduced form \(\bar\eta\).
The next figure plots the posterior mass on the true class, \(H_t(\bar\eta) = h_t(\lambda^{(1)}) + h_t(\lambda^{(2)})\), and the share of that mass assigned to \(\lambda^{(1)}\).
H_true = h_paths_3[:, :, 0] + h_paths_3[:, :, 1]
share_1 = h_paths_3[:, :, 0] / H_true

fig, axes = plt.subplots(1, 2, figsize=(11, 4))
for path_H, path_s in zip(H_true, share_1):
    axes[0].plot(t_grid, path_H, alpha=0.25, lw=0.8, color="steelblue")
    axes[1].plot(t_grid, path_s, alpha=0.25, lw=0.8, color="steelblue")
axes[0].plot(t_grid, np.median(H_true, axis=0), color="navy", lw=2,
             label="median")
axes[0].set_ylabel(r"$H_t(\bar\eta)$", fontsize=11)
axes[1].set_ylabel(r"$h_t(\lambda^{(1)}) / H_t(\bar\eta)$", fontsize=11)
axes[1].set_ylim(0, 1)
for ax in axes:
    ax.set_xlabel("period $t$", fontsize=11)
axes[0].legend(fontsize=9)
plt.tight_layout()
plt.show()

print(f"max over paths of 1 - H_T:         {(1 - H_true[:, -1]).max():.1e}")
print(f"max deviation of share from 1/2:  {np.abs(share_1 - 0.5).max():.1e}")
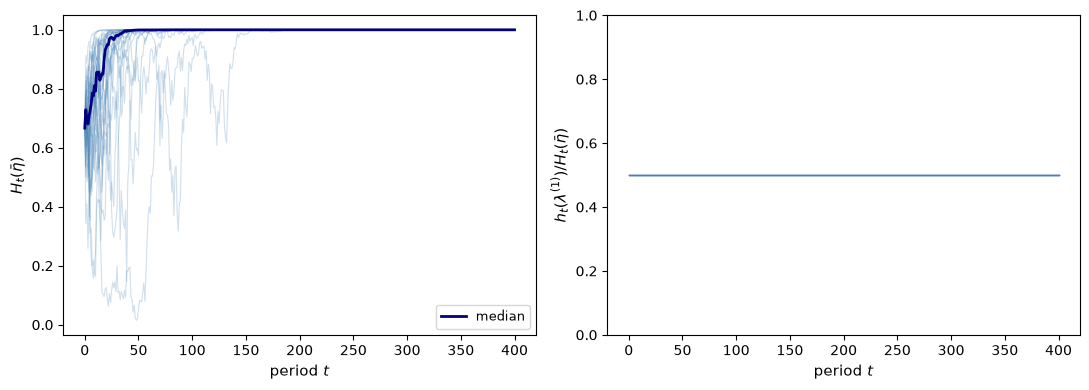
Fig. 31.6 posterior mass on the true reduced-form class#
max over paths of 1 - H_T:         1.3e-13
max deviation of share from 1/2:  0.0e+00
\(H_t(\bar\eta)\) converges to one on every path.
The share \(h_t(\lambda^{(1)}) / H_t(\bar\eta)\) stays at its prior value \(1/2\) for every \(t\), because \(\lambda^{(1)}\) and \(\lambda^{(2)}\) assign the same likelihood to every price.
31.7. Exercises#
Exercise 31.1
CARA portfolio utility and the stock-market interpretation.
Consider a two-state economy (\(a_1 = 2\), \(a_2 = 0.5\)) where the informed agent has CARA (constant absolute risk aversion) preferences over portfolio wealth:
The agent chooses \(x_1\) to maximize
subject to the budget constraint \(p\,x_1 + x_2 = w\).
Total supply of good 1 is \(X_1 = 1\).
Derive the first-order condition for the informed agent’s optimal \(x_1\).
Use the market-clearing condition \(x_1 = 1\) (the informed agent absorbs the entire supply) to obtain an implicit equation for the equilibrium price \(p^*(q)\), and solve it numerically for \(q \in (0,1)\) and several values of \(\gamma\).
Show analytically that \(p^*(q)\) admits the closed form
\[ p^*(q) = \frac{a_2 + R(q,\gamma)\, a_1}{1 + R(q,\gamma)}, \qquad R(q,\gamma) = \frac{q}{1-q}\, e^{-\gamma(a_1-a_2)}, \]and verify that \(p^*(q)\) is strictly increasing in \(q\).
Solution
For the first-order condition, define \(W_s = w + (a_s - p)\,x_1\) for \(s = 1, 2\).
Then the FOC is
or equivalently, after dividing both sides by \(\gamma e^{-\gamma w}\),
Setting \(x_1 = 1\) (the informed agent absorbs all supply), this becomes a scalar root-finding problem in \(p\):
def F_cara(p, q, a1, a2, γ, x1=1.0):
    """Residual for the CARA equilibrium condition."""
    return (q * (a1 - p) * np.exp(-γ * (a1 - p) * x1)
            - (1 - q) * (p - a2) * np.exp(γ * (p - a2) * x1))

a1, a2 = 2.0, 0.5
q_grid = np.linspace(0.05, 0.95, 200)
γ_values = [0.5, 1.0, 2.0, 5.0]
colors_sol = plt.cm.plasma(np.linspace(0.15, 0.85, len(γ_values)))

fig, ax = plt.subplots(figsize=(8, 5))
for γ, color in zip(γ_values, colors_sol):
    p_eq = [brentq(F_cara, a2, a1,
                   args=(q, a1, a2, γ))
            for q in q_grid]
    ax.plot(q_grid, p_eq, lw=2, color=color,
            label=rf"$\gamma = {γ}$")

ax.set_xlabel(r"posterior $q = \Pr(\bar a = a_1)$", fontsize=12)
ax.set_ylabel("equilibrium price $p^*(q)$", fontsize=12)
ax.set_title("CARA preferences: equilibrium prices", fontsize=12)
ax.legend(fontsize=10)
plt.tight_layout()
plt.show()
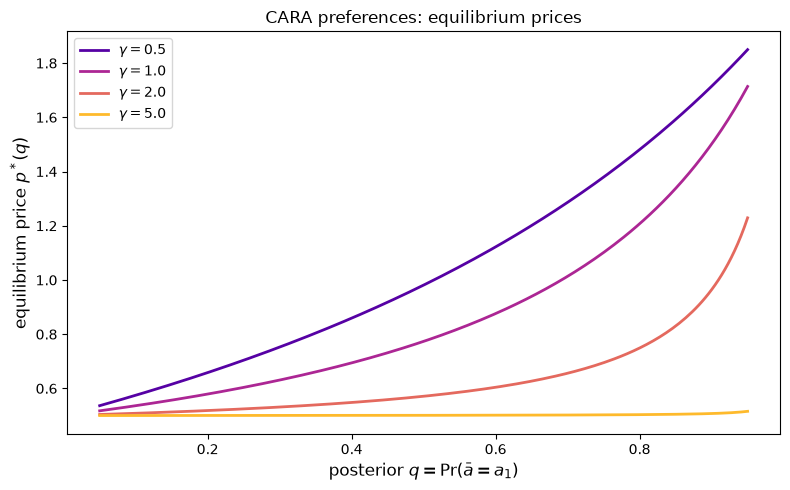
The price is strictly increasing in \(q\) for every \(\gamma > 0\).
For the closed form, start from the FOC at \(x_1 = 1\), divide both sides by \((1 - q)(p - a_2)e^{-\gamma(a_1 - p)}\), and combine the exponentials:
Rearranging gives
and solving the resulting linear equation in \(p\) yields
Since \(R(q,\gamma)\) is strictly increasing in \(q\) and \(dp^*/dR = (a_1 - a_2)/(1 + R)^2 > 0\), the equilibrium price \(p^*(q)\) is strictly increasing in \(q\).
The closed form is an exponentially tilted expectation.
With \(x_1 = 1\) we have \(e^{-\gamma W_s} = e^{-\gamma(w - p)} e^{-\gamma a_s}\), so the first-order condition is \(\sum_s \mu_s (a_s - p) e^{-\gamma a_s} = 0\) for a posterior \(\mu = (\mu_1, \ldots, \mu_S)\), and
The price is the expected value of \(\bar a\) under the probabilities \(\tilde\mu_s \propto \mu_s e^{-\gamma a_s}\), which tilt the insider’s posterior toward low-payoff states.
With \(\mu = (q, 1 - q)\), dividing the numerator and denominator by \((1 - q) e^{-\gamma a_2}\) gives the formula for \(p^*(q)\) above.
def p_tilted(μ, a, γ):
    """Equilibrium price as an exponentially tilted expectation."""
    weights = np.asarray(μ) * np.exp(-γ * np.asarray(a))
    return weights @ np.asarray(a) / weights.sum()


gap = max(abs(brentq(F_cara, a2, a1, args=(q, a1, a2, γ))
              - p_tilted([q, 1 - q], [a1, a2], γ))
          for γ in γ_values for q in q_grid)
print(f"largest gap between root-finding and closed form: {gap:.1e}")
largest gap between root-finding and closed form: 5.0e-13
This exercise uses the stock-market interpretation emphasized by Kihlstrom and Mirman [1975].
Portfolio wealth is \(W = x_2 + \bar{a}\, x_1\), so \(a x_1\) and \(x_2\) are perfect substitutes in each state.
Hence the elasticity of substitution between the two arguments of \(u(a x_1, x_2)\) is infinite, corresponding to the \(\sigma > 1\) side of Theorem 31.2.
The difference is that this example is not the full equilibrium model the theorem analyzes, but rather a partial equilibrium model with a single informed agent and a fixed supply of the risky asset.
Exercise 31.2
In the Bayesian learning simulation, the speed of convergence to rational expectations is determined by the Kullback-Leibler divergence (Statistical Divergence Measures) between the two reduced forms.
The KL divergence \(D_{KL}(\eta_1 \| \eta_2)\) from \(g(\cdot \mid \eta_1)\) to \(g(\cdot \mid \eta_2)\), for two normal distributions with means \(\bar{p}_1\) and \(\bar{p}_2\) and common variance \(\sigma_p^2\), is
which is symmetric in the two means under equal variances.
Let \(\eta_1\), with \(\bar p_1 = 2.0\), be the true reduced form, and set \(\sigma_p = 0.4\) and \(h_0 = 1/2\).
Compute \(D_{KL}\) for the “easy” case (\(\bar{p}_2 = 1.2\)), the “hard” case (\(\bar{p}_2 = 1.8\)), the intermediate cases \(\bar{p}_2 \in \{1.4, 1.6\}\), and a harder case \(\bar{p}_2 = 1.9\).
For each case simulate \(1{,}000\) paths and compute the first period \(T_{0.99}\) at which \(h_t \geq 0.99\).
Plot histograms of \(T_{0.99}\) for the easy and hard cases.
Show that under the true model the log posterior odds \(\ell_t = \log[h_t / (1 - h_t)]\) follow a random walk with drift \(D_{KL}\) and per-period variance \(2 D_{KL}\).
Use Wald’s identity to argue that
\[ \mathbb{E}[T_{0.99}] \approx \frac{\log\bigl[(0.99/0.01) \big/ \bigl(h_0/(1 - h_0)\bigr)\bigr]}{D_{KL}} \]when \(D_{KL}\) is small, so that \(T_{0.99} \approx C / D_{KL}\) with \(C \approx \log 99 \approx 4.6\) for \(h_0 = 1/2\).
Plot the mean and median of \(T_{0.99}\) against \(D_{KL}\) on log-log scales, together with the line \(\log 99 / D_{KL}\), and explain the deviations.
Solution
Here is one solution.
Write \(\Delta = \bar p_1 - \bar p_2\).
The log likelihood ratio of one price is
Under the true model \(p = \bar p_1 + \sigma_p \varepsilon\) with \(\varepsilon \sim N(0, 1)\), so \(\xi = \Delta^2/(2\sigma_p^2) + (\Delta/\sigma_p)\varepsilon\), which has mean \(D_{KL}\) and variance \(\Delta^2/\sigma_p^2 = 2 D_{KL}\).
Bayes’ law adds one such increment to \(\ell_t\) each period, so \(\ell_t\) is a random walk with drift \(D_{KL}\) and variance \(2 D_{KL}\) per period.
\(T_{0.99}\) is the first time \(\ell_t\) reaches \(b = \log 99\).
Wald’s identity gives \(\mathbb{E}[\ell_{T}] = \ell_0 + D_{KL}\, \mathbb{E}[T]\), so
The last term is the overshoot of the boundary.
It is of the order of one step’s standard deviation \(\sqrt{2 D_{KL}}\), so it vanishes relative to \(b - \ell_0\) as \(D_{KL} \to 0\).
def log_odds_paths(p_true, p_alt, σ, h0, n_paths, T, seed=42):
    """Paths of log posterior odds on the true model, t = 1, ..., T."""
    rng = np.random.default_rng(seed)
    p = rng.normal(p_true, σ, size=(n_paths, T))
    ξ = norm.logpdf(p, p_true, σ) - norm.logpdf(p, p_alt, σ)
    return np.log(h0 / (1 - h0)) + np.cumsum(ξ, axis=1)


def first_passage(ell, b):
    """First period with ell_t >= b, and the value of ell_t then."""
    hit = ell >= b
    assert hit.any(axis=1).all()            # every path crosses within T
    T_hit = hit.argmax(axis=1)
    return T_hit + 1, ell[np.arange(len(ell)), T_hit]


σ_p, h0, b = 0.4, 0.5, np.log(0.99 / 0.01)
p_alts = [1.2, 1.4, 1.6, 1.8, 1.9]
results = {}

print(f"{'p_alt':>6}{'D_KL':>8}{'mean T':>9}{'median T':>10}"
      f"{'mean T*D':>10}{'log 99 + overshoot':>20}{'median T*D':>12}"
      f"{'sqrt(2D)':>10}")
for p_alt in p_alts:
    D = (2.0 - p_alt)**2 / (2 * σ_p**2)
    ell = log_odds_paths(2.0, p_alt, σ_p, h0, n_paths=1_000, T=3_000)
    T99, ell_T = first_passage(ell, b)
    results[p_alt] = (D, T99)
    print(f"{p_alt:6.1f}{D:8.4f}{T99.mean():9.2f}{np.median(T99):10.1f}"
          f"{T99.mean() * D:10.3f}{b + (ell_T - b).mean():20.3f}"
          f"{np.median(T99) * D:12.3f}{np.sqrt(2 * D):10.3f}")

# Brownian limit: T is inverse Gaussian with mean b/D and shape b^2/(2D)
from scipy.stats import invgauss
print(f"\nlog 99 = {b:.3f};  median/mean in the Brownian limit = "
      f"{(b / 2) * invgauss(mu=2 / b).median():.3f}")
 p_alt    D_KL   mean T  median T  mean T*D  log 99 + overshoot  median T*D  sqrt(2D)
   1.2  2.0000     3.18       3.0     6.356               6.335       6.000     2.000
   1.4  1.1250     5.23       5.0     5.879               5.773       5.625     1.500
   1.6  0.5000    10.80       9.0     5.402               5.307       4.500     1.000
   1.8  0.1250    40.03      34.0     5.004               4.921       4.250     0.500
   1.9  0.0313   154.86     130.0     4.839               4.746       4.063     0.250

log 99 = 4.595;  median/mean in the Brownian limit = 0.825
fig, axes = plt.subplots(1, 3, figsize=(14, 4))
for ax, (name, p_alt) in zip(axes[:2], [("Easy", 1.2), ("Hard", 1.8)]):
    D, T99 = results[p_alt]
    ax.hist(T99, bins=30, color="steelblue", edgecolor="white", alpha=0.8)
    ax.axvline(np.median(T99), color="crimson", lw=2,
               label=fr"median $T_{{0.99}} = {np.median(T99):.0f}$")
    ax.set_title(f"{name}: $D_{{KL}} = {D:.4f}$", fontsize=11)
    ax.set_xlabel(r"$T_{0.99}$", fontsize=12)
    ax.set_ylabel("count", fontsize=11)
    ax.legend(fontsize=10)

D_vals = np.array([results[p][0] for p in p_alts])
axes[2].loglog(D_vals, [results[p][1].mean() for p in p_alts], "o-",
               label=r"mean $T_{0.99}$")
axes[2].loglog(D_vals, [np.median(results[p][1]) for p in p_alts], "s-",
               label=r"median $T_{0.99}$")
axes[2].loglog(D_vals, b / D_vals, "k--", label=r"$\log 99 / D_{KL}$")
axes[2].set_xlabel(r"$D_{KL}$", fontsize=12)
axes[2].legend(fontsize=10)
plt.tight_layout()
plt.show()
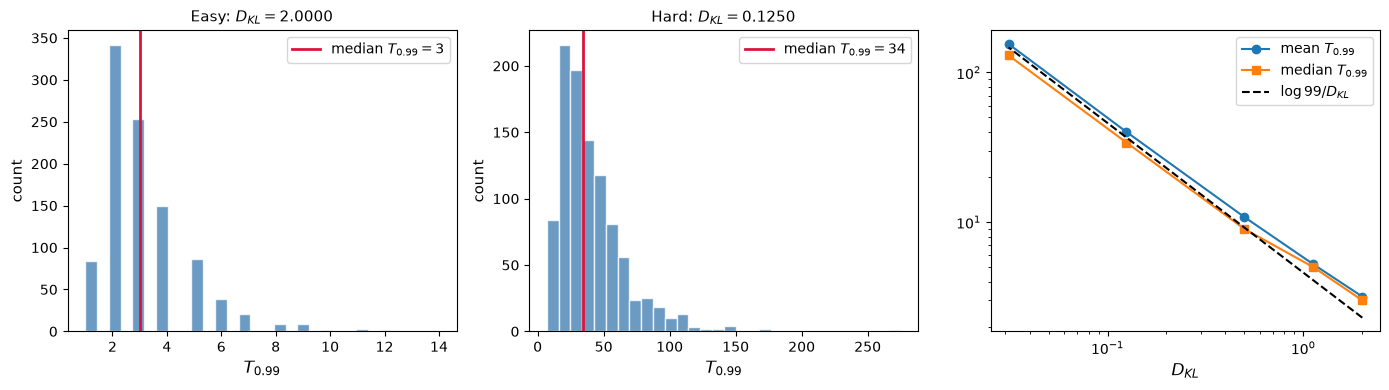
Both the mean and the median of \(T_{0.99}\) fall roughly in proportion to \(1/D_{KL}\), so learning is faster when the two reduced forms are easier to distinguish.
The product \(\mathbb{E}[T_{0.99}] D_{KL}\) falls toward \(\log 99 = 4.6\) as \(D_{KL}\) shrinks.
By Wald’s identity the gap equals the expected overshoot, and the columns “mean T*D” and “log 99 + overshoot” agree up to sampling error.
In the easy case a single price moves \(\ell_t\) by about two units, so the boundary is overshot by a wide margin and \(\mathbb{E}[T_{0.99}] D_{KL}\) exceeds \(\log 99\) substantially.
The median lies below the mean because the first-passage time is skewed to the right.
In the small-\(D_{KL}\) limit \(\ell_t\) behaves like a Brownian motion with drift, \(T_{0.99}\) is inverse Gaussian with mean \(\log 99 / D_{KL}\) and shape \((\log 99)^2 / (2 D_{KL})\), and its median is \(0.825 \log 99 / D_{KL}\).
Exercise 31.3
Theorem 31.3 requires the prior to assign positive probability to the true reduced-form class \(\bar\eta\), equivalently to some structure that generates the true price distribution \(g(\cdot \mid \bar\eta)\).
In this exercise the true reduced form itself is excluded from the prior support, so we investigate what happens when no model in the prior generates the true price distribution.
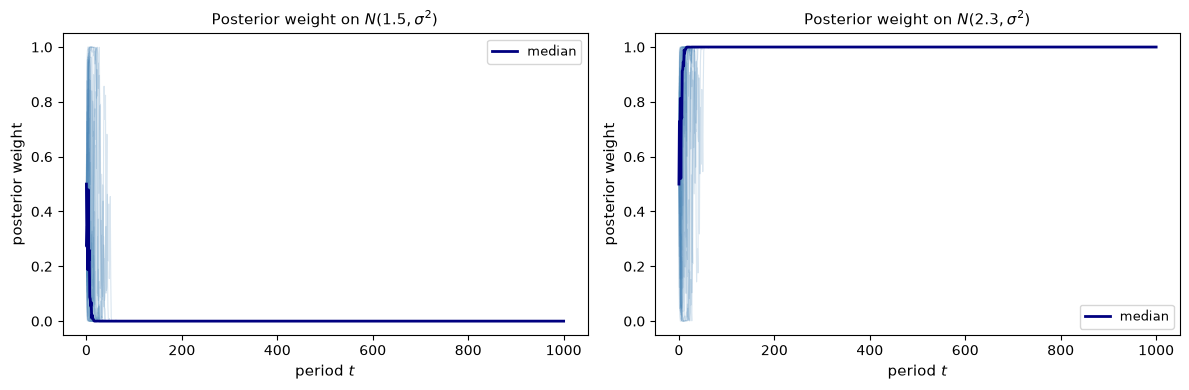
Simulate \(T = 1,000\) periods of prices from \(N(2.0, 0.4^2)\) but use a prior that places equal weight on two wrong models: \(N(1.5, 0.4^2)\) and \(N(2.3, 0.4^2)\).
Plot the posterior weight on each model over time.
Discuss your findings.
Solution
Here is one solution:
def simulate_misspecified(
    T, p_bar_true, p_bar_wrong, σ_p, h0, n_paths, seed=0
):
    """Simulate learning under a misspecified two-model prior."""
    rng = np.random.default_rng(seed)
    h_paths = np.zeros((n_paths, T + 1, 2))
    h_paths[:, 0, :] = h0

    for path in range(n_paths):
        h = np.array(h0, dtype=float)
        prices = rng.normal(p_bar_true, σ_p, size=T)
        for t, price in enumerate(prices):
            likes = norm.pdf(price, loc=p_bar_wrong, scale=σ_p)
            h = h * likes
            h /= h.sum()
            h_paths[path, t + 1, :] = h

    return h_paths


def predictive_density(weights, means, σ_p, p_grid):
    """Return the predictive density under the current posterior weights."""
    density = np.zeros_like(p_grid)
    for weight, mean in zip(weights, means):
        density += weight * norm.pdf(p_grid, loc=mean, scale=σ_p)
    return density


T = 1000
p_true = 2.0
p_wrong = np.array([1.5, 2.3])
σ_p = 0.4
h0 = np.array([0.5, 0.5])
n_paths = 30

h_misspec = simulate_misspecified(T, p_true, p_wrong, σ_p, h0, n_paths)

kl_vals = (p_true - p_wrong)**2 / (2 * σ_p**2)
for mean, kl in zip(p_wrong, kl_vals):
    print(f"KL(true || N({mean:.1f}, σ^2)) = {kl:.4f}")

t_grid = np.arange(T + 1)
fig, axes = plt.subplots(1, 2, figsize=(12, 4))

labels = [r"$N(1.5, \sigma^2)$", r"$N(2.3, \sigma^2)$"]
for ax, k, label in zip(axes, [0, 1], labels):
    for path in h_misspec:
        ax.plot(t_grid, path[:, k], alpha=0.2, lw=0.8, color="steelblue")
    ax.plot(t_grid, np.median(h_misspec[:, :, k], axis=0),
            color="navy", lw=2, label="median")
    ax.set_title(f"Posterior weight on {label}", fontsize=11)
    ax.set_xlabel("period $t$", fontsize=11)
    ax.set_ylabel("posterior weight", fontsize=11)
    ax.legend(fontsize=9)

plt.tight_layout()
plt.show()

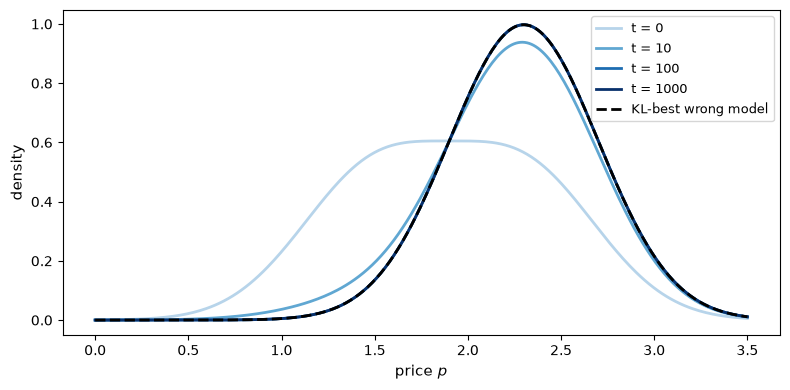
# Predictive density and mean along the median posterior path
median_path = np.median(h_misspec, axis=0)
p_grid = np.linspace(0.0, 3.5, 300)
closer_idx = np.argmin(kl_vals)

fig, ax = plt.subplots(figsize=(8, 4))
colors = plt.cm.Blues(np.linspace(0.3, 1.0, 4))
for t_snap, color in zip([0, 10, 100, T], colors):
    dens = predictive_density(median_path[t_snap], p_wrong, σ_p, p_grid)
    ax.plot(p_grid, dens, color=color, lw=2, label=f"t = {t_snap}")

ax.plot(
    p_grid,
    norm.pdf(p_grid, loc=p_wrong[closer_idx], scale=σ_p),
    "k--",
    lw=2,
    label="KL-best wrong model",
)
ax.set_xlabel("price $p$", fontsize=11)
ax.set_ylabel("density", fontsize=11)
ax.legend(fontsize=9)
plt.tight_layout()
plt.show()

pred_mean = np.median(
    h_misspec[:, :, 0] * p_wrong[0] + h_misspec[:, :, 1] * p_wrong[1], axis=0
)
print(f"True mean: {p_true}")
print(f"Predictive mean at T={T}: {pred_mean[-1]:.4f}")
print(f"Closer misspecified mean: {p_wrong[np.argmin(kl_vals)]:.1f}")
KL(true || N(1.5, σ^2)) = 0.7812
KL(true || N(2.3, σ^2)) = 0.2812
True mean: 2.0
Predictive mean at T=1000: 2.3000
Closer misspecified mean: 2.3
Here
so the model with mean \(2.3\) is the KL-best approximation among the two wrong models, and in the simulation posterior weight concentrates on that model.
Posterior odds are cumulative likelihood ratios.
Write \(g_\star\) for the true price density \(N(2.0, 0.4^2)\), write \(g_1\) and \(g_2\) for the wrong models \(N(1.5, 0.4^2)\) and \(N(2.3, 0.4^2)\), and write \(h_t^{(1)}, h_t^{(2)}\) for the posterior weights on them.
The log posterior odds on \(g_2\) against \(g_1\) are
Under \(g_\star\) each term in the sum has mean \(D_{KL}(g_\star \| g_1) - D_{KL}(g_\star \| g_2) = 0.78125 - 0.28125 = 0.5 > 0\), by the formula in A helpful formula of Likelihood Ratio Processes.
So the odds drift toward \(g_2\), the model that is closer to \(g_\star\) in Kullback–Leibler divergence, and \(h_t^{(2)} \to 1\).
The predictive density converges to \(g_2\) rather than to \(g_\star\): price expectations settle down, but not on rational expectations.
The prior puts no mass on the true reduced form, so the absolute-continuity condition behind Theorem 31.3 fails.
Incorrect Models studies the same mechanism when the true distribution is a mixture that lies outside the agent’s set of models.
Exercise 31.4
Theorem 31.2 covers two states.
This exercise shows what changes with three.
Use the CES economy of the lecture with \(\sigma = 2\) (\(\rho = 0.5\)), \(W_1 = 4\), and three states \((a_1, a_2, a_3) = (2, 1, 0.5)\).
Show that at a fixed price \(p\) the first-order condition is linear in the posterior \(\mu\), so the set of posteriors that support \(p\) is the intersection of a line with the simplex.
Write a function that computes the equilibrium price for any posterior \(\mu\), find two distinct posteriors that support the same price, and verify the result numerically.
Plot the level sets of \(p(\mu)\) over the simplex.
Explain why \(p(\cdot)\) can nonetheless be one-to-one on the finite set \(M\) of posteriors generated by a signal with finitely many values, and why the two-state theorem is not contradicted.
Check the claim with randomly drawn signal likelihoods.
Solution
Here is one solution.
At a fixed price the bundle \(x(p) = (1, W_1 - p)\) is fixed, and the first-order condition reads
The numbers \(c_s(p)\) do not depend on \(\mu\).
Together with \(\sum_s \mu_s = 1\), this is two linear equations in three unknowns.
Their solutions form a line, and the line meets the simplex in a segment of posteriors that all support the price \(p\).
With two states the simplex is itself a segment, and the single equation \(q\, c_1(p) + (1 - q)\, c_2(p) = 0\) has at most one solution unless \(c_1(p) = c_2(p) = 0\), which a constant sign of \(\alpha_1 \beta_2 - \alpha_2 \beta_1\) rules out.
def eq_price_S(μ, a, W1, ρ):
    """Equilibrium price when agent 1 holds posterior μ over states a."""
    μ, a = np.asarray(μ, dtype=float), np.asarray(a, dtype=float)

    def residual(p):
        u1, u2 = ces_derivatives(a, W1 - p, ρ)
        return μ @ (a * u1 - p * u2)

    return brentq(residual, 1e-6, W1 - 1e-6, xtol=1e-12)


a3, W1_3, ρ_3 = np.array([2.0, 1.0, 0.5]), 4.0, 0.5
μ_star = np.array([0.5, 0.2, 0.3])
p_star = eq_price_S(μ_star, a3, W1_3, ρ_3)

u1, u2 = ces_derivatives(a3, W1_3 - p_star, ρ_3)
c = a3 * u1 - p_star * u2
v = np.cross(c, np.ones(3))            # v @ c = 0 and v.sum() = 0

# range of t with μ_star + t v in the simplex
t_lo = max(-μ_star[i] / v[i] for i in range(3) if v[i] > 0)
t_hi = min(-μ_star[i] / v[i] for i in range(3) if v[i] < 0)

print(f"p(μ_star) = {p_star:.10f}\n")
for t in [0.8 * t_lo, 0.4 * t_lo, 0.0, 0.4 * t_hi, 0.8 * t_hi]:
    μ_t = μ_star + t * v
    print(f"μ = {np.round(μ_t, 4)}   p(μ) = {eq_price_S(μ_t, a3, W1_3, ρ_3):.10f}")
p(μ_star) = 1.7388112483

μ = [0.3737 0.5663 0.06  ]   p(μ) = 1.7388112483
μ = [0.4369 0.3831 0.18  ]   p(μ) = 1.7388112483
μ = [0.5 0.2 0.3]   p(μ) = 1.7388112483
μ = [0.5276 0.12   0.3524]   p(μ) = 1.7388112483
μ = [0.5552 0.04   0.4048]   p(μ) = 1.7388112483
Five distinct posteriors support the same price to ten decimal places.
n = 81
grid = np.linspace(0, 1, n)
P = np.full((n, n), np.nan)
for i, m1 in enumerate(grid):
    for j, m3 in enumerate(grid):
        if m1 + m3 <= 1:
            P[j, i] = eq_price_S([m1, 1 - m1 - m3, m3], a3, W1_3, ρ_3)

fig, ax = plt.subplots(figsize=(6, 5))
cs = ax.contour(grid, grid, P, levels=15, cmap="viridis")
ax.clabel(cs, fontsize=8, fmt="%.2f")
ends = np.array([μ_star + t * v for t in [t_lo, t_hi]])
ax.plot(ends[:, 0], ends[:, 2], "r--", lw=2, label=fr"$p(\mu) = {p_star:.3f}$")
ax.plot(μ_star[0], μ_star[2], "ro")
ax.plot([0, 1, 0, 0], [0, 0, 1, 0], color="black", lw=1)
ax.set_xlabel(r"$\mu_1$", fontsize=12)
ax.set_ylabel(r"$\mu_3$", fontsize=12)
ax.legend(fontsize=10)
plt.tight_layout()
plt.show()
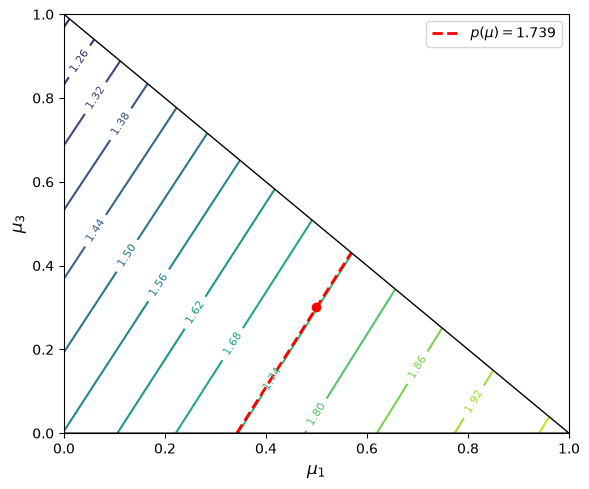
The level sets of \(p(\mu)\) are straight lines across the simplex, so \(p(\cdot)\) is not one-to-one on the whole simplex.
Theorem 31.1 requires less: \(p(\cdot)\) must be one-to-one on the finite set \(M\) of posteriors that the signal can generate.
Two posteriors in \(M\) share a price only if one lies on the level line through the other.
That coincidence imposes one equation on the signal likelihoods, and a small perturbation of the likelihoods destroys it.
rng = np.random.default_rng(1)
μ0 = np.ones(3) / 3
gaps = []
for _ in range(500):
    φ = rng.dirichlet(np.ones(4), size=3)       # P(signal | state), 4 signals
    joint = μ0[:, None] * φ
    posteriors = (joint / joint.sum(axis=0)).T  # one posterior per signal
    prices = np.sort([eq_price_S(m, a3, W1_3, ρ_3) for m in posteriors])
    gaps.append(np.diff(prices).min())

print(f"smallest price gap within a draw, over 500 draws: {min(gaps):.2e}")
smallest price gap within a draw, over 500 draws: 8.10e-05
In every draw the four posteriors support four distinct prices, so the price is sufficient for the signal.
With finitely many signal values, invertibility on \(M\) holds generically even though it fails on the simplex.
Exercise 31.5
This exercise measures merging of opinions in the two-model example.
Take the hard case: the true reduced form \(\bar\eta = \eta_1\) has \(\bar p_1 = 2.0\), the alternative \(\eta_2\) has \(\bar p_2 = 1.8\), \(\sigma_p = 0.4\), and \(h_0 = 1/2\).
Write \(H_t = H_t(\bar\eta)\).
Show that \(\| g(\cdot \mid p^1, \ldots, p^t) - g(\cdot \mid \bar\eta) \|_{\mathrm{TV}} = (1 - H_t)\, \| g(\cdot \mid \eta_2) - g(\cdot \mid \bar\eta) \|_{\mathrm{TV}}\), and evaluate the last factor for two normal densities with a common variance.
Show that for the joint distribution of the next \(k\) prices the distance is $(1 - H_t)\bigl[2\Phi\bigl(\sqrt{k}, |\bar p_1 - \bar p_2| / (2\sigma_p)\bigr)
1\bigr]\(, where \)\Phi$ is the standard normal distribution function.
Conclude that the distance \(d_t\) between the observer’s and the true conditional distributions of the entire future price sequence is \(1 - H_t\).
Compute and plot both distances along 40 simulated paths of length 300.
Relate the results to Theorem 34.1 and Theorem 34.2 in Merging of Opinions: The Blackwell–Dubins Theorem.
Solution
Here is one solution.
The predictive density is \(H_t\, g(\cdot \mid \bar\eta) + (1 - H_t)\, g(\cdot \mid \eta_2)\), so
and the total variation distance scales by \(1 - H_t\).
Two normal densities with a common variance cross at the midpoint of their means, so
Conditional on the reduced form, the next \(k\) prices are i.i.d., so the same argument applies to their joint density.
Their sum is a sufficient statistic for the mean, so the distance between the two \(k\)-fold products equals the distance between \(N(k \bar p_1, k\sigma_p^2)\) and \(N(k \bar p_2, k\sigma_p^2)\), which is \(2\Phi(\sqrt{k}\, |\bar p_1 - \bar p_2| / (2\sigma_p)) - 1\).
As \(k \to \infty\) this distance rises to one.
The two i.i.d. price laws are mutually singular, as Theorem 34.2 asserts, so \(d_t = 1 - H_t\).
from scipy.special import expit

Δ = 2.0 - 1.8
tv_one = 2 * norm.cdf(Δ / (2 * σ_p)) - 1
print(f"one-period distance between the two models: {tv_one:.4f}")
for k in [1, 10, 100, 1_000]:
    print(f"  k = {k:5d}:  2Φ(√k Δ / 2σ) - 1 = "
          f"{2 * norm.cdf(np.sqrt(k) * Δ / (2 * σ_p)) - 1:.4f}")

ell = log_odds_paths(2.0, 1.8, σ_p, h0=0.5, n_paths=40, T=300)
one_minus_H = expit(-ell)                      # 1 - H_t, computed stably
t_vals = np.arange(1, 301)

fig, ax = plt.subplots(figsize=(8, 4.5))
for path in one_minus_H:
    ax.semilogy(t_vals, path, color="steelblue", alpha=0.2, lw=0.8)
ax.semilogy(t_vals, np.median(one_minus_H, axis=0), color="navy", lw=2,
            label=r"median $d_t = 1 - H_t$ (entire future)")
ax.semilogy(t_vals, tv_one * np.median(one_minus_H, axis=0), color="crimson",
            lw=2, label="median one-period distance")
D_hard = Δ**2 / (2 * σ_p**2)
ax.semilogy(t_vals, np.exp(-D_hard * t_vals), "k--", lw=1.5,
            label=r"$e^{-D_{KL} t}$")
ax.set_xlabel("period $t$", fontsize=12)
ax.set_ylabel("total variation distance", fontsize=12)
ax.legend(fontsize=10)
plt.tight_layout()
plt.show()
one-period distance between the two models: 0.1974
  k =     1:  2Φ(√k Δ / 2σ) - 1 = 0.1974
  k =    10:  2Φ(√k Δ / 2σ) - 1 = 0.5708
  k =   100:  2Φ(√k Δ / 2σ) - 1 = 0.9876
  k =  1000:  2Φ(√k Δ / 2σ) - 1 = 1.0000
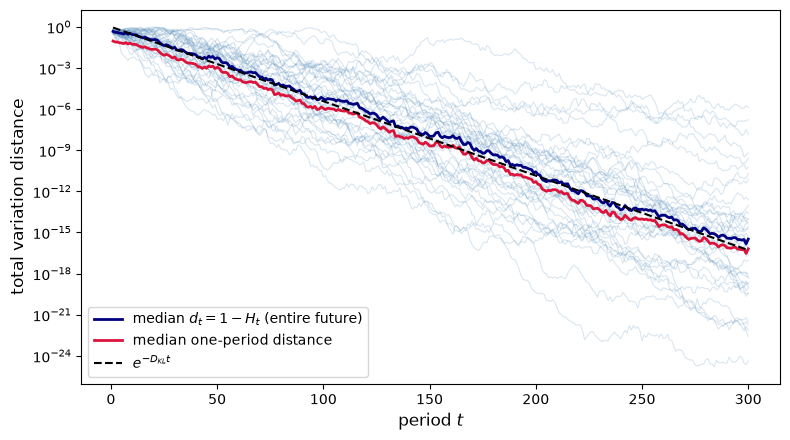
The observer’s subjective distribution of the price sequence is \(P = h_0 Q^* + (1 - h_0) Q_2\), where \(Q^*\) and \(Q_2\) make prices i.i.d. with densities \(g(\cdot \mid \bar\eta)\) and \(g(\cdot \mid \eta_2)\).
Because \(h_0 > 0\), \(Q^* \ll P\), and Theorem 34.1 asserts that \(d_t \to 0\) almost surely under \(Q^*\).
Because \(Q^*\) and \(Q_2\) are mutually singular, \(d_t = 1 - H_t\), so merging of opinions about the entire future and \(H_t \to 1\) are the same event.
With countably many classes the argument is the same.
Each class \(\eta \neq \bar\eta\) assigns probability zero to some event of \(Q^*\)-probability one, and the intersection of these countably many events still has \(Q^*\)-probability one, so again \(d_t = 1 - H_t(\bar\eta)\).
The one-period distance is smaller than \(d_t\) by the factor \(0.197\), because one price distinguishes \(N(2.0, 0.4^2)\) from \(N(1.8, 0.4^2)\) poorly.
Both distances fall at the exponential rate \(D_{KL} = 0.125\) per period, the drift of the log posterior odds.