90. A Peculiar Definition of Bounded Rationality#
90.1. Overview#
This lecture opens a series based on Sargent [1993] about Bounded Rationality in Macroeconomics, from one point of view in the late 1980s and early 1990s.
Those were years when the Soviet Union ended and formerly Warsaw Pact countries were rearranging their political economies.
For those countries, those were thus truly regime changes in the technical sense of modern dynamic macroeconomics.
As What the program is good for explains, rational expectations models handle such changes less comfortably than their users usually suppose.
Two generations of work on economic dynamics — in game theory, macroeconomics, and general equilibrium theory — had produced theories that embraced the rational expectations assumption, models that were designed to understand settings in which people face recurrent situations they have lived through many times before.
The transitions across regimes underway in Eastern Europe in the early 1990s were not like that.
People there were confronted with unprecedented opportunities, new and ill-defined rules, and a daily struggle to figure out the mechanism that would eventually govern trade and production.
Economists with good models of a market economy had ample equilibrium theories describing how a system behaves once it has fully adjusted to a new and coherent set of rules and expectations.
They knew much less about the dynamics of transitions from a Soviet system to a market economy.
They might hold prejudices and anecdotes about how to manage such a transition, but no empirically confirmed formal theory of it.
Against this background, some economists ventured into what Sims [1980] called the “wilderness” of irrational expectations and bounded rationality.
The aim was partly to build theories of transition dynamics, partly to understand the properties of equilibrium dynamics themselves, and partly to study systems that never settle down.
This series follows Sargent [1993] a little way into that wilderness.
90.1.1. The knowledge that rational expectations imputes#
To see what bounded rationality retreats from, start with rational expectations, which imposes two requirements:
Individual rationality — each artificial agent’s behavior maximizes an objective function subject to perceived constraints.
Mutual consistency — the constraints perceived by everybody in the system agree with one another and with the outcomes that their decisions jointly generate.
The second requirement is Muth’s rational expectations assumption [Muth, 1961].
In an economy one person’s decisions are part of another person’s constraints, so consistency requires each person to hold correct beliefs about everyone else’s decisions, decision processes, and beliefs.
Consistency is also what gives rational expectations its power: without some restriction on perceptions, a model in which behavior depends on arbitrary assumptions about subjective beliefs can produce almost any outcome at all.
But look at what that requirement imputes to people once a model is taken to data.
The agents inside a rational expectations model evaluate their Euler equations using equilibrium probability distributions.
Those are the very distributions that the econometrician studying them is still struggling to estimate.
The agents, in other words, have somehow already solved the inference problem that the economist is only part way through.
90.1.2. Sargent’s formulation of bounded rationality#
Sargent’s bounded rationality program keeps individual rationality and retreats from mutual consistency in a particular way, chosen to remove the asymmetry just described between the agents in a model and the econometrician who studies them.
Sargent’s version of a bounded rationality program is (Sargent [1993], ch. 1):
I interpret a proposal to build models with ‘boundedly rational’ agents as a call to retreat from the second piece of rational expectations (mutual consistency of perceptions) by expelling rational agents from our model environments and replacing them with ‘artificially intelligent’ agents who behave like econometricians. These ‘econometricians’ theorize, estimate, and adapt in attempting to learn about probability distributions which, under rational expectations, they already know.
The agents are made more like the people who build the models: they gather data, form theories, estimate, and adapt.
Note
Why “peculiar”?
For Herbert Simon, who coined the term, bounded rationality meant limits on people’s capacity to gather and process information, so that they satisfice rather than optimize.
Sargent’s agents are bounded in a different way: they compute like econometricians, but they do not know the equilibrium probability distributions.
The book credits Simon with the aim of removing the asymmetry between agents and econometrician, but Simon rejected this way of doing it.
After he saw the manuscript of the book, Simon wrote Sargent a letter objecting to the formulation and recommending that Sargent not call it “bounded rationality”.
Simon particularly disliked making the agents inside the model act like econometricians, a pretense that he found preposterous.
Rational expectations and bounded rationality share a birthplace: in the 1950s Muth and Simon were colleagues and coauthors at the Carnegie Institute of Technology, now Carnegie Mellon University [Holt et al., 1960].
Sargent’s proposal makes work harder for the model builder, not easier.
Withdrawing the assumption of a commonly understood environment means we must put something in its place, and there are many plausible somethings to choose among (Sargent [1993], ch. 1):
This area is wilderness because the researcher faces so many choices after he decides to forgo the discipline provided by equilibrium theorizing. The commitment to equilibrium theorizing made many choices for him by requiring that people be modelled as optimal decision-makers within a commonly understood environment. When we withdraw the assumption of a commonly understood environment, we have to replace it with something, and there are so many plausible possibilities.
90.1.3. What the program is good for#
Chapter 2 of Sargent [1993] lists four payoffs that might justify the effort.
Equilibrium selection. When a model has many equilibria, adaptive agents may converge to only some of them, turning learning into a device for selecting among rational expectations equilibria; where the equilibrium is unique, agents who learn their way to it lend it a plausibility it lacked as a mere assumption.
Computation. Learning algorithms double as algorithms for computing equilibria too complicated to solve by hand, and the literatures that supply the agents’ “brains” also supply economists with new methods of optimization and estimation.
Transition dynamics and regime changes. Adaptive dynamics hold out the hope of a theory of the out-of-equilibrium adjustment that the Eastern European reformers had to manage blind.
New sources of dynamics. Where rational expectations makes a sharp prediction that the data reject, adaptive agents can supply what is missing; the book’s leading example is the no-trade theorem of finance, under which no trade can occur in equilibrium.
The third payoff answers a criticism that the book levels at standard practice.
A common use of rational expectations models is to compute one equilibrium under a “pre-reform” policy rule and another under a “post-reform” rule, and to read the difference as the effect of the reform.
That comparison is itself inconsistent with rational expectations: each equilibrium assumes a government committed forever to its rule, so the comparison predicts what would happen if the government did what the agents were certain it never would.
The book illustrates with the abrupt ends of the German and Austrian hyperinflations, where the shortcut seems to cost little, and with two stories about the onset of the Great Depression, each of which works only by backing off rational expectations at some point.
A theory of how people learn their way into a new regime would fill that gap.
That promise is the least fulfilled, as the series will acknowledge; selection and computation are the surer payoffs.
This lecture sets up the selection problem in its sharpest form: models with too many equilibria.
When a rational expectations model has a continuum of equilibria, the physical description of the economy plus the equilibrium concept fail to pin down what happens.
Something else must choose, and a plausible account of how people grope toward equilibrium is a natural candidate for that something.
We build two monetary examples that later lectures return to, both with a continuum of rational expectations equilibria:
a quantity-theory model of money and prices in which the price level is determined only up to an arbitrary bubble term, and
a two-currency version in which the exchange rate is completely unrestricted.
Along the way we set up the machinery — the fixed-point view of equilibrium, the relaxation algorithm, adaptive expectations, Muth’s inverse optimal-prediction problem, and the stochastic-approximation recursion whose associated differential equation governs where adaptive agents end up — that later lectures use to expel the rational agents and put adaptive ones in their place.
90.1.4. The rest of the series#
Adaptive Agents in an Overlapping Generations Monetary Economy — adaptive households in Samuelson’s overlapping generations monetary model.
Least squares learning selects the low-inflation equilibrium that the rational expectations dynamics reject, and laboratory subjects go the same way.
A government learning a Phillips curve closes the lecture.
Learning, Approximation, and Equilibrium Computation — what an agent must give up when the state is continuous and a separate response for each contingency is out of the question, which brings in approximate equilibria and the resemblance between learning algorithms and equilibrium computation algorithms.
Exchange Rate Indeterminacy, Learning, and Experiments — the two-currency model of this lecture with adaptive agents, where learning pins the exchange rate down only by making it depend on history, while a genetic-algorithm economy instead produces volatility that never dies.
Networks, Genetic Algorithms, and Classifier Systems — a catalogue of candidate brains, from Holland and the connectionists: perceptrons, associative memories, genetic algorithms, classifier systems.
Money as a Medium of Exchange among Artificially Intelligent Agents — populations of classifier systems that discover, from scratch, which good will serve as money.
1993 Prospects for Bounded Rationality in Macroeconomics — the 1993 ledger of what the program achieved and what it did not, and a postscript on the three decades since.
The lectures are ordered by how much the modeller tells the agents, a gradient of prompting:
Bray’s least squares learners, met below, know everything about their environment except one coefficient.
The Robbins–Monro agents of Adaptive Agents in an Overlapping Generations Monetary Economy know their utility function but not the distribution of the returns they face.
The agents of Learning, Approximation, and Equilibrium Computation must also choose a functional form for what they learn.
The Newton learners of Exchange Rate Indeterminacy, Learning, and Experiments know the gradient of their own payoff; its genetic-algorithm strings, like the classifier systems of Networks, Genetic Algorithms, and Classifier Systems and Money as a Medium of Exchange among Artificially Intelligent Agents, see only a payoff signal.
1993 Prospects for Bounded Rationality in Macroeconomics then enters the prompting on the debit side of the ledger.
90.1.5. Notation across the series#
Each lecture follows the notation of its sources, so some symbols change jobs from lecture to lecture.
From Adaptive Agents in an Overlapping Generations Monetary Economy on, \(R\) is reserved for gross returns and \(M\) for estimated moment or curvature matrices.
Adaptive expectations means Cagan’s and Friedman’s geometric distributed lag below, while adaptive agents means agents who revise any rule — a forecast, a regression coefficient, the strength of a rule of thumb — in light of experience.
The learning gain is written \(\lambda_t\) here, because \(\gamma\) is taken, and \(\gamma_t\) from Adaptive Agents in an Overlapping Generations Monetary Economy on.
Let’s start with some imports.
import numpy as np
import pandas as pd
import matplotlib.pyplot as plt
from scipy.signal import lfilter
90.2. Rational expectations as a fixed point#
90.2.1. A static market#
Take a competitive industry with a large number \(n\) of identical firms.
Each firm chooses output \(x\) to maximize
where \(c\) is an increasing, convex cost function, and price is determined by a downward-sloping inverse demand curve
in which \(X\) is the output of the average firm.
Each firm is a price-taker and an \(X\)-taker: it takes \(p\) as given and sets marginal cost equal to price, \(p = c'(x)\).
Write the solution as \(x = g(p)\).
Substituting the demand curve gives the best-response map
which sends a conjectured industry average \(X\) to the individual output an optimizing firm would choose against it.
That is the first component of rational expectations, and it is all that individual rationality delivers.
The second component — consistency — requires that what each firm chooses coincides with what it assumed the average firm was choosing:
A static rational expectations equilibrium is a fixed point of the best-response map.
For a concrete example, take a quadratic cost function \(c(x) = \tfrac{\gamma}{2} x^2\) and a linear inverse demand curve \(p = a - b n X\).
Then \(p = c'(x) = \gamma x\) gives \(x = p / \gamma\), so
a, b, n, γ = 10.0, 0.3, 5, 1.0

def h(X):
    "Best response of an individual firm to an industry average X."
    return (a - b * n * X) / γ

X_star = a / (γ + b * n)
print(f"X*     = {X_star}")
print(f"h(X*)  = {h(X_star)}")
print(f"h'(X)  = {-b * n / γ}")
X*     = 4.0
h(X*)  = 4.0
h'(X)  = -1.5
90.2.2. Computing the fixed point#
Now suppose we want to find \(X^*\) without solving for it in closed form.
A natural starting point is the relaxation algorithm: carry an estimate \(X^*_k\) of the equilibrium, compute the best response to it, and move part of the way toward that best response,
where \(\lambda \in (0, 1]\) is a relaxation parameter.
With \(\lambda = 1\) this is simple iteration on \(h\), the classic cobweb.
def relax(λ, X0=1.0, n_iter=12):
    "Iterate the relaxation algorithm, returning the whole path."
    path = np.empty(n_iter + 1)
    path[0] = X0
    for k in range(n_iter):
        path[k + 1] = path[k] + λ * (h(path[k]) - path[k])
    return path


fig, axes = plt.subplots(1, 2, figsize=(11, 4))

axes[0].plot(relax(1.0), 'o-', ms=4, lw=1, color='C0',
             label=r"$\lambda = 1.0$ (cobweb)")
axes[0].set_title(r"$\lambda = 1$: the cobweb")
axes[0].set_ylabel("$X^*_k$")

for i, λ in enumerate((0.8, 0.5, 0.3)):
    axes[1].plot(relax(λ), 'o-', ms=4, lw=1, color=f'C{i+1}',
                 label=fr"$\lambda = {λ}$")
axes[1].set_title(r"$\lambda < 1$: relaxation")
axes[1].set_ylim(-1, 9)

for ax in axes:
    ax.axhline(X_star, color='k', lw=0.8, ls='--', label="$X^*$")
    ax.set_xlabel("$k$")
    ax.legend(frameon=False, fontsize=9)
plt.tight_layout()
plt.show()
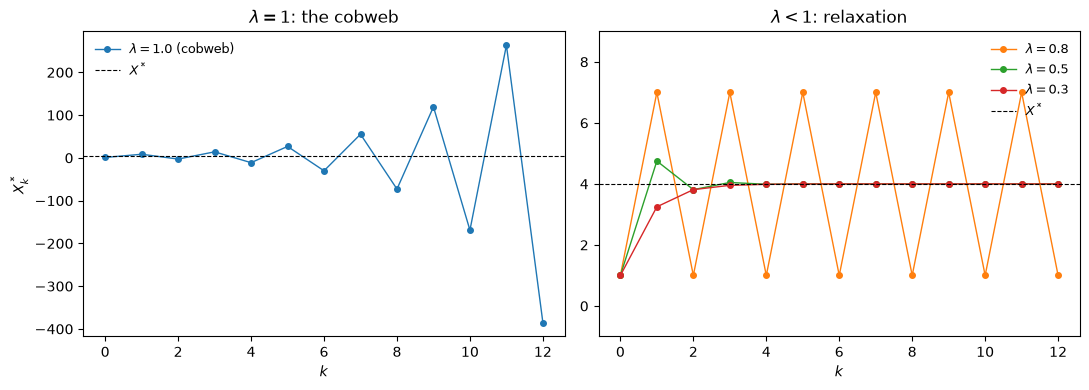
Fig. 90.1 Relaxation algorithm paths: the cobweb and three smaller relaxation parameters#
The naive cobweb \(\lambda = 1\) diverges, oscillating ever further away from the equilibrium it is trying to find; note the scale on the left panel.
Since \(h\) is affine, iteration (90.3) has multiplier \(1 + \lambda(h' - 1)\), so it converges if and only if
λ_max = 2 / (1 + b * n / γ)
print(f"converges iff λ < {λ_max}")
print(f"λ = 1.0 : multiplier = {1 + 1.0 * (-b*n/γ - 1):+.2f}   (diverges)")
print(f"λ = 0.8 : multiplier = {1 + 0.8 * (-b*n/γ - 1):+.2f}   (period-2 cycle)")
print(f"λ = 0.5 : multiplier = {1 + 0.5 * (-b*n/γ - 1):+.2f}   (converges)")
converges iff λ < 0.8
λ = 1.0 : multiplier = -1.50   (diverges)
λ = 0.8 : multiplier = -1.00   (period-2 cycle)
λ = 0.5 : multiplier = -0.25   (converges)
At \(\lambda = 0.8\) the multiplier is exactly \(-1\): the scheme maps \(X \mapsto 8 - X\) and so bounces forever between \(1\) and \(7\) without either converging or diverging, which is the zigzag that never dies down in the right panel.
Damping the adjustment enough makes the algorithm find the equilibrium; not damping it enough makes the algorithm chase its own tail.
Hold on to that observation.
A recurring theme of this series is that how you adapt determines where, and whether, you end up.
90.2.3. Adaptive expectations#
Equation (90.3) was introduced as an algorithm running in iteration count \(k\).
Reinterpret \(k\) as calendar time \(t\), read \(X^*_t\) as the value people expect, and \(X_t = h(X^*_{t-1})\) as what actually happens, and it becomes a theory of expectation formation:
This is the adaptive expectations scheme that Cagan [Cagan, 1956] used to study hyperinflations and that Friedman [1957] used to study consumption.
Expectations are a geometrically declining distributed lag of past observations, with a single free parameter \(\lambda\) describing beliefs.
Cagan and Friedman took \(\lambda\) as a free parameter and left open the question of why anyone would form expectations this way.
90.2.4. Muth’s inverse problem#
Muth [1960] set out to eliminate \(\lambda\) as a free parameter by turning the question around.
Instead of asking what forecasts a given environment implies, he asked: for what environment would exponential smoothing be the optimal forecast?
His answer is that (90.4) is the least-squares forecast of \(X_{t+k}\) at every horizon \(k\) if and only if \(X_t\) follows
with \(\{\epsilon_t\}\) a martingale difference sequence and \(\theta \in [0, 1)\), and the smoothing weight tied to the moving-average coefficient by
Note
Sargent writes both the smoothing weight in (90.4) and the moving-average coefficient in (90.5) as \(\lambda\).
We use \(\theta\) for the second to keep the relationship \(\lambda = 1 - \theta\) visible; Notation across the series lists the other symbols that change jobs.
The forecasting rule inherits its one parameter from the stochastic process being forecast.
Let’s confirm this numerically at horizon \(k = 1\) (Exercise 90.4 checks a longer horizon): simulate (90.5), run exponential smoothing at a range of weights, and see which weight forecasts best.
def smoothing_mse(x, λ, k=1):
    "MSE of exponential smoothing with weight λ as a forecast k steps ahead."
    # f_i = λ x_i + (1 - λ) f_{i-1}, started at f_0 = x_0
    f, _ = lfilter([λ], [1, λ - 1], x, zi=[(1 - λ) * x[0]])
    return np.mean((x[k:] - f[:-k]) ** 2)


rng = np.random.default_rng(0)
T = 200_000
ε = rng.standard_normal(T + 1)           # one shock path, shared across all λ
grid = np.linspace(0.02, 0.98, 97)

fig, ax = plt.subplots(figsize=(7, 4))
for θ in (0.2, 0.5, 0.8):
    X = np.cumsum(ε[1:] - θ * ε[:-1])    # Muth's process
    mse = np.array([smoothing_mse(X, λ) for λ in grid])
    line, = ax.plot(grid, mse, lw=1.2, label=fr"$\theta = {θ}$")
    ax.axvline(1 - θ, color=line.get_color(), lw=0.8, ls='--')
    print(f"θ = {θ}:  best λ = {grid[mse.argmin()]:.2f},  1 - θ = {1 - θ:.2f},"
          f"  min MSE = {mse.min():.4f}")
ax.set_xlabel(r"smoothing weight $\lambda$")
ax.set_ylabel("forecast MSE")
ax.set_ylim(0.9, 3)
ax.legend(frameon=False)
plt.show()
θ = 0.2:  best λ = 0.80,  1 - θ = 0.80,  min MSE = 1.0024
θ = 0.5:  best λ = 0.50,  1 - θ = 0.50,  min MSE = 1.0024
θ = 0.8:  best λ = 0.20,  1 - θ = 0.20,  min MSE = 1.0024
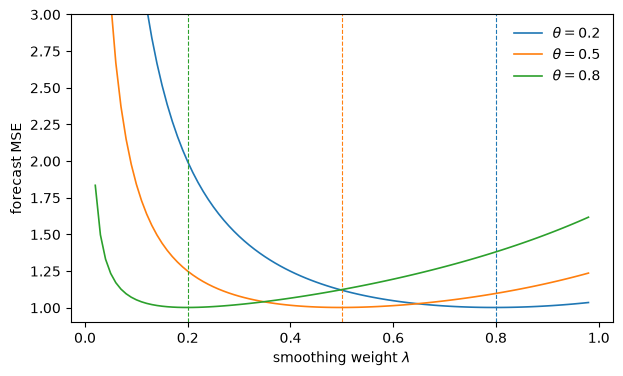
Fig. 90.2 Forecast MSE of exponential smoothing#
Each curve bottoms out exactly at its dashed line \(\lambda = 1 - \theta\), and the minimized mean squared error is \(\mathbb{V}[\epsilon_t] = 1\) up to simulation noise — exponential smoothing at that weight is the conditional expectation, and nothing can beat it.
Muth’s exercise was the first application of the rational expectations idea in the form that became standard: find the restrictions that link a forecasting scheme to the environment in which it is used.
It also pushed later researchers [Lucas and Prescott, 1971] to treat the forecasting scheme itself as the object in terms of which equilibrium is defined.
90.2.5. The dynamic analogue#
That is exactly what happens when we move from static to dynamic models.
Let each agent choose a sequence rather than a single action, a contingency plan for \(x_t\) that maximizes
taking as given a price equation \(p_t = p(X_t, u_t)\) and a perceived law of motion for the aggregate state,
where \(\{u_t\}\) is IID and \(\beta \in (0, 1)\) is a discount factor.
The Euler equation for this problem is
where \(\Pi_i\) is the derivative with respect to the \(i\)th argument and \(F(\cdot \mid X_t)\) is the distribution of next period’s price that the perceived law of motion \(H\) induces.
In a rational expectations equilibrium \(F\) is the equilibrium distribution, the very object that, as we saw at the start, the econometrician is still trying to estimate.
Solving the agent’s dynamic program yields an individual decision rule \(x_t = h(x_{t-1}, X_{t-1}, u_t)\).
Imposing that the representative agent is representative, \(x_t = X_t\), delivers the actual law of motion
and hence a map from perceived to actual laws of motion,
A dynamic rational expectations equilibrium is a fixed point \(H = T(H)\), the same idea as (90.2), but the fixed point now lives in a space of functions rather than a space of numbers.
The relaxation algorithm carries over unchanged,
except that it now revises entire expectations-generating functions in response to the gap between what they predicted and what happened.
The econometric learners of this series are versions of (90.7) in which the revision is driven by data rather than by an exact evaluation of \(T\), and in which the gain \(\lambda\) sometimes declines over time and sometimes stays constant.
The next section makes that family precise.
See also
Rational Expectations Equilibrium develops the \(T\) map in detail for a Lucas–Prescott industry model and computes its fixed point, and Investment Under Uncertainty studies the Lucas–Prescott model itself.
Least Squares Learning in Self-Referential Models studies what happens when agents estimate the perceived law of motion by least squares while living inside the system their estimates help determine.
90.3. One recursion, many learners#
The relaxation algorithm is the simplest member of a family of recursions that runs through the whole series; to see the family, put some noise into the static market and let the firms learn.
90.3.1. From relaxation to learning: Bray’s market#
Suppose firms must commit to output before they see what the average firm produces.
Each firm enters period \(t\) with a belief \(X^*_{t-1}\) about average output, formed from data through \(t-1\), and produces its best response \(h(X^*_{t-1})\); a common supply shock \(u_t\), IID with mean zero and variance \(\sigma_u^2\), then determines what actually happens, and firms revise their belief toward it:
Without the shock and with a constant gain \(\lambda_t = \lambda\), this is the relaxation algorithm (90.3) run in calendar time, that is, adaptive expectations.
With the gain \(\lambda_t = 1/t\), \(X^*_t\) is the sample mean of \(X_1, \ldots, X_t\), the least squares estimate of a constant, and the model is, up to notation, that of Bray [1982], whose feedback coefficient is our \(h'\) (Bray writes it \(b\), a letter that here denotes the slope of demand).
The belief error \(e_t = X^*_t - X^*\) obeys
so each period applies the relaxation multiplier at that period’s gain.
A constant gain above the bound \(2/(1 + bn/\gamma)\) makes beliefs explode, as the cobweb did; below the bound they do not explode, but each shock moves them by \(\lambda u_t\), so they wander forever in a band around \(X^*\).
A declining gain eventually falls below any bound, and as \(\lambda \to 0\) the stability condition \(|1 + \lambda(h' - 1)| < 1\) collapses to \(h' < 1\), Bray’s condition for least squares learners to converge, which the cobweb market, with \(h' = -bn/\gamma < 0\), satisfies however steep it is.
The next cell puts firms in this lecture’s market, where \(h' = -1.5\) and fixed gains above \(0.8\) explode, and compares three gains on one path of shocks.
def learn(gain, u, X0=1.0):
    "Beliefs X*_t of firms that update with gain(t) in the market with shocks u."
    X = np.empty(len(u) + 1)
    X[0] = X0
    for t in range(1, len(u) + 1):
        X_t = h(X[t-1]) + u[t-1]                    # what actually happens
        X[t] = X[t-1] + gain(t) * (X_t - X[t-1])    # belief revision
    return X


σ_u, T_b = 0.5, 2_000
u = σ_u * np.random.default_rng(1).standard_normal(T_b)
t_b = np.arange(1, T_b + 1)

fig, ax = plt.subplots(figsize=(8, 4))
for label, gain, lw in [(r"$\lambda_t = 0.9$", lambda t: 0.9, 1.0),
                        (r"$\lambda_t = 0.3$", lambda t: 0.3, 0.5),
                        (r"$\lambda_t = 1/t$", lambda t: 1 / t, 1.0)]:
    ax.plot(t_b, np.abs(learn(gain, u)[1:] - X_star), lw=lw, label=label)
ax.plot(t_b, σ_u / np.sqrt(t_b), 'k--', lw=0.8, label=r"$\sigma_u / \sqrt{t}$")
ax.set_xscale('log')
ax.set_yscale('log')
ax.set_ylim(1e-4, 1e3)
ax.set_xlabel("$t$")
ax.set_ylabel(r"$|X^*_t - X^*|$")
ax.legend(frameon=False, fontsize=9, ncol=2)
plt.show()
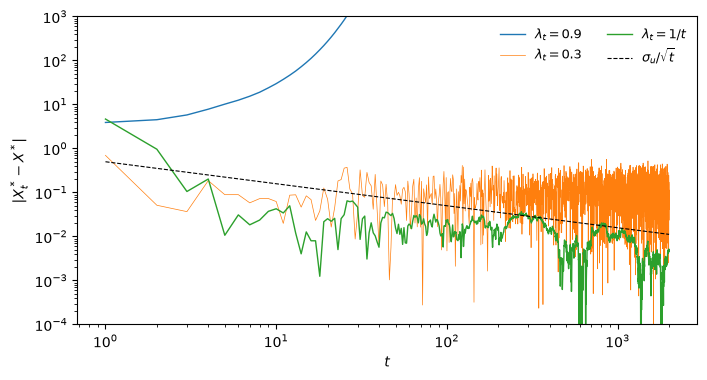
Fig. 90.3 Belief errors in Bray’s market under fixed and declining gains#
The fixed gain above the bound explodes, and the fixed gain below it hovers in a band whose width is set by the gain (Exercise 90.5 computes it).
Only the declining gain converges, with an error that shrinks like \(t^{-1/2}\), the rate at which a sample mean settles down.
Least Squares Learning in Self-Referential Models analyzes Bray’s model in detail, including the case \(h' > 1\) in which least squares diverges, and Optimal Misspecified Beliefs revisits it with a constant gain.
90.3.2. Stochastic approximation and E-stability#
Most learners in this series update a vector of beliefs \(\theta_t\) by a recursion of the form
where \(x_t\) is the latest data, \(\lambda_t\) is the gain, and \(Q\) is a direction of improvement, such as a forecast error or a gradient, sometimes premultiplied by the inverse of an estimated moment or curvature matrix, as in recursive least squares and Newton’s method.
Equation (90.8) is the case \(\theta = X^*\) and \(Q = X_t - X^*_{t-1}\).
Robbins and Monro [1951] introduced such recursions to find a zero of a function observed only with noise, and Ljung [1977] showed that for small gains they follow, on average, the differential equation \(d\theta/d\tau = E\, Q(\theta, x)\) in the rescaled time \(\tau_t = \lambda_1 + \cdots + \lambda_t\), with the expectation taken holding \(\theta\) fixed.
When agents estimate a perceived law of motion by least squares, the average update points from the perceived law toward the actual one, and the differential equation becomes
where \(T\) is the map (90.6) from perceived to actual laws of motion.
For Bray’s market \(T = h\), and (90.10) is \(dX/d\tau = h(X) - X\), the equation that Sargent [1993] (ch. 2) already attaches to the relaxation algorithm.
A fixed point \(\theta^* = T(\theta^*)\) is a rational expectations equilibrium; it is E-stable (expectationally stable) if it is a stable rest point of (90.10), which requires every eigenvalue of the Jacobian \(DT(\theta^*)\) to have real part less than one.
What learners do near an E-stable equilibrium depends on the gain.
With a decreasing gain (\(\sum_t \lambda_t = \infty\) and \(\sum_t \lambda_t^2 < \infty\), as for \(\lambda_t = 1/t\)), recursive least squares converges to an E-stable equilibrium, under regularity conditions that may include a projection facility keeping beliefs in bounds, and it converges to an E-unstable one with probability zero.
With a constant gain in a stochastic environment, beliefs never settle: they fluctuate around the E-stable equilibrium in an ergodic distribution whose variance is proportional to the gain when the gain is small, with occasional large escapes [Cho et al., 2002, Sargent, 1999, Williams, 2019].
In a deterministic environment there is nothing to average away, and a small enough constant gain converges too, as the relaxation algorithm does.
E-stability is the right condition for least squares learning near an equilibrium, but it is not a theorem about every algorithm: stochastic-gradient learners can fail to converge to an E-stable equilibrium [Giannitsarou, 2005].
Population algorithms, such as the genetic algorithms and classifier systems of later lectures, lie outside the theory; drawing on Arifovic’s 1991 dissertation, the book (ch. 5) reports that a genetic-algorithm population can sometimes learn its way to the equilibrium of Bray’s model even when \(h' > 1\).
The core of the theory predates the book, whose chapter 5 (footnote 73 and the section “An associated ordinary differential equation”) uses (90.10) to study least squares learning.
The idea goes back to DeCanio [1979] and Evans [1985], Evans [1989], who used the \(T\) map to define expectational stability, and to Marcet and Sargent [1989] and Woodford [1990], who showed that it governs the convergence of least squares learning, using the method of Ljung [1977]; Evans and Honkapohja [2001] later systematized and generalized the theory.
Least Squares Learning in Self-Referential Models develops it, and Adaptive Learning and Escape Dynamics gives a compact primer on recursive algorithms, mean dynamics, and constant-gain escapes.
90.3.3. How the series uses it#
lecture |
learners and gains |
what the differential equation explains |
|---|---|---|
Adaptive Agents in an Overlapping Generations Monetary Economy |
Robbins–Monro saving rules, declining gain |
convergence to the stationary equilibrium |
least squares on inflation, weights growing with the price level (an effectively constant gain) |
the stability reversal: \(T' = \tfrac12 < 1\) at the low steady state \(\pi = 2\), \(T' = 2 > 1\) at the high one \(\pi = 3\) |
|
a government learning a Phillips curve, constant gain |
recurrent escapes |
|
online parameterized expectations, declining gain |
slow convergence, at a rate set by the largest eigenvalue of \(DT\) |
|
Newton–Raphson portfolio rules, constant gain |
a continuum of rest points with no drift along it, so the limit depends on where beliefs started |
|
a genetic algorithm |
outside the theory |
|
Networks, Genetic Algorithms, and Classifier Systems, Money as a Medium of Exchange among Artificially Intelligent Agents |
classifier systems, \(1/\tau\) averaging of rule strengths |
rest points that value future payoffs as if the agents were very impatient |
90.4. Money and prices#
We now build the first of the two models that motivate everything that follows.
A representative money-holder chooses nominal balances \(m_t\) to carry from \(t\) to \(t+1\) to maximize
where \(p_t\) is the current price level and \(p^*_{t+1}\) is the price level expected next period.
The first term is consumption today, reduced by the real resources \(m_t / p_t\) given up to acquire currency; the second is consumption tomorrow, augmented by the goods \(m_t / p^*_{t+1}\) that the currency is expected to command.
Differentiating (90.11) with respect to \(m_t\) and rearranging gives the demand for money
Real balances fall when currency is expected to lose value faster.
This is a version of the demand function Cagan [Cagan, 1956] used to study hyperinflations, and it also arises in Samuelson’s [Samuelson, 1958] overlapping generations model.
Following the book, the endowments are written \(2 w_1\) and \(2 w_2\), so that the demand for real balances is \(w_1 - w_2 \pi\) with \(\pi = p^*_{t+1}/p_t\).
From Adaptive Agents in an Overlapping Generations Monetary Economy on the endowments are \(w_1\) and \(w_2\), so the same household saves \((w_1 - w_2 \pi)/2\).
To close the model we need a theory of \(p^*_{t+1}\).
Suppose the money supply grows at a constant rate,
and that the household believes the price level is related to the money supply by
for constants \((\gamma, \lambda, c)\) that summarize its beliefs, with \(\gamma > 0\), \(\lambda > 0\) and \(c \geq 0\) so that the price level stays positive.
Knowing \(\mu\), the household forecasts \(p^*_{t+1} = \gamma \mu M_t + \lambda^{t+1} c\).
Substituting the forecast and (90.14) into (90.12) gives money demand as a function of the current money supply,
Notice a feature common to models in which expectations matter: the demand for money depends on its supply, because today’s demand depends on tomorrow’s expected price level, which is believed to depend on tomorrow’s money supply.
90.4.1. Equilibrium#
Setting demand equal to supply, \(m_t = M_t\), turns (90.15) into a functional equation,
which must hold at every date.
Matching the two terms gives
so the equilibrium price level is
The parameters \(\gamma\) and \(\lambda\) are pinned down.
The constant \(c\) is not.
Every \(c \geq 0\) is a rational expectations equilibrium, and expectations formed from (90.14) are always exactly right in each of them.
Let’s verify that the residual really does vanish for any \(c\) we care to try.
w1, w2, μ, M0 = 2.0, 1.0, 1.5, 1.0
γ_m, λ_m = 1 / (w1 - μ * w2), w1 / w2

t = np.arange(12)
M = M0 * μ ** t

def price_path(c):
    "Equilibrium price level for bubble constant c."
    return γ_m * M + λ_m ** t * c

for c in (0.0, 0.5, 3.0, 25.0):
    p = price_path(c)
    p_star = γ_m * μ * M + λ_m ** (t + 1) * c     # forecast of next period's price
    m = w1 * p - w2 * p_star                      # money demand
    print(f"c = {c:5}:  max |demand - supply| = {np.max(np.abs(m - M)):.2e}")
c =   0.0:  max |demand - supply| = 0.00e+00
c =   0.5:  max |demand - supply| = 0.00e+00
c =   3.0:  max |demand - supply| = 0.00e+00
c =  25.0:  max |demand - supply| = 0.00e+00
Money demand equals money supply exactly, at every date, for every \(c\).
90.4.2. The bubble#
Since \(w_1 > w_2\), the second term in (90.17) grows at the gross rate \(\lambda = w_1 / w_2 > 1\).
In the equilibrium with \(c = 0\) the price level is proportional to the money supply: the quantity theory in its textbook form.
In every other equilibrium the price level carries a component that has nothing to do with the money supply and grows exponentially: a purely speculative bubble.
fig, axes = plt.subplots(1, 2, figsize=(11, 4))

for c in (0.0, 0.5, 3.0):
    lab = f"$c = {c}$" + (" (quantity theory)" if c == 0 else "")
    axes[0].plot(t, price_path(c), 'o-', ms=3, lw=1, label=lab)
    axes[1].plot(t, M / price_path(c), 'o-', ms=3, lw=1, label=lab)

axes[0].set_yscale('log')
axes[0].set_ylabel("$p_t$  (log scale)")
axes[1].set_ylabel("real balances  $M_t / p_t$")
axes[1].axhline(w1 - μ * w2, color='k', lw=0.8, ls='--')
axes[1].set_ylim(0, 0.6)
for ax in axes:
    ax.set_xlabel("$t$")
    ax.legend(frameon=False, fontsize=9)
plt.tight_layout()
plt.show()
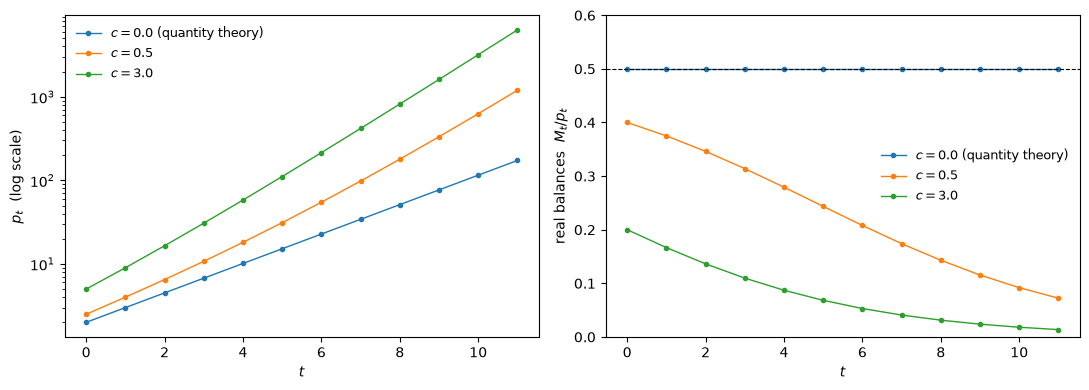
Fig. 90.4 Price levels and real balances under bubbles#
The left panel shows the price level diverging further and further from the quantity-theory path as \(c\) rises.
The right panel shows what that does to the real value of the money stock: with \(c = 0\) real balances are constant at \(w_1 - \mu w_2\), while with \(c > 0\) the bubble drives them steadily toward zero.
Along a bubble path the gross inflation rate climbs toward \(w_1 / w_2\), which from (90.12) is precisely the rate at which the demand for real balances vanishes.
The economy demonetizes itself, purely because everyone expects it to.
infl = pd.DataFrame(
    {f"c = {c}": price_path(c)[1:] / price_path(c)[:-1] for c in (0.0, 0.5, 3.0)},
    index=pd.Index(t[1:], name="t"),
).round(3)
infl
| c = 0.0 | c = 0.5 | c = 3.0 | |
|---|---|---|---|
| t | |||
| 1 | 1.5 | 1.600 | 1.800 |
| 2 | 1.5 | 1.625 | 1.833 |
| 3 | 1.5 | 1.654 | 1.864 |
| 4 | 1.5 | 1.686 | 1.890 |
| 5 | 1.5 | 1.721 | 1.913 |
| 6 | 1.5 | 1.757 | 1.932 |
| 7 | 1.5 | 1.792 | 1.947 |
| 8 | 1.5 | 1.826 | 1.959 |
| 9 | 1.5 | 1.857 | 1.969 |
| 10 | 1.5 | 1.885 | 1.976 |
| 11 | 1.5 | 1.908 | 1.982 |
There is nothing in the model — no preference, no technology, no policy — that says which \(c\) we are in.
As Sargent puts it, “Rational expectations alone is not a sufficiently restrictive principle to determine outcomes.”
Adaptive Agents in an Overlapping Generations Monetary Economy returns to this household with a constant money supply (\(\mu = 1\), which is a zero deficit there).
Its two stationary inflation rates are then \(\pi = 1\), the bubbleless equilibrium here, and \(\pi = w_1/w_2\), the limit of every bubble path.
Perfect-foresight dynamics lead away from \(\pi = 1\), but that lecture shows that least squares learners converge to it: learning kills the bubble.
90.5. Two currencies#
The indeterminacy gets worse when we allow more than one currency.
Versions of the result below are due to Russell Boyer (1971) and Kareken and Wallace [1981].
Keep (90.12) as the demand for currency in total, and suppose there are two fiat currencies in supplies \(M_{1t}\) and \(M_{2t}\) that are perfect substitutes as long as their rates of return are equal:
This indifference about which currency to hold is what makes the exchange rate indeterminate.
Let people believe the price levels are given by
where \(e\) is a constant exchange rate.
Requiring that the demand for currency, valued in units of currency 1, equal the total supply \(M_{1t} + e M_{2t}\) gives
These equations are remarkable for what they leave out.
The exchange rate \(e\) is entirely unrestricted — if the equations have a solution for one \(e\), they have a solution for every other — and the formulas for \(\gamma_1\) and \(\gamma_2\) do not involve \(e\) at all.
Take the simplest case: two currencies in fixed supply, \(\mu_1 = \mu_2 = 1\), and set \(c = 0\).
Then \(\gamma_1 = \gamma_2 = (w_1 - w_2)^{-1}\) and the price levels are constant.
w1, w2 = 2.0, 1.0
H1, H2 = 100.0, 120.0                 # fixed supplies of the two currencies
γ_e = 1 / (w1 - w2)

def two_currency(e):
    "Price levels and the real allocation at exchange rate e."
    p1 = γ_e * (H1 + e * H2)
    p2 = p1 / e
    supply = H1 + e * H2              # total currency, in units of currency 1
    demand = (w1 - w2) * p1           # money demand, with p* = p since prices are constant
    return p1, p2, supply / p1, demand - supply

pd.DataFrame(
    [two_currency(e) for e in (0.25, 0.5, 1.0, 2.0, 4.0)],
    index=pd.Index([0.25, 0.5, 1.0, 2.0, 4.0], name="e"),
    columns=["$p_1$", "$p_2$", "real balances", "excess demand"],
).round(4)
| $p_1$ | $p_2$ | real balances | excess demand | |
|---|---|---|---|---|
| e | ||||
| 0.25 | 130.0 | 520.0 | 1.0 | 0.0 |
| 0.50 | 160.0 | 320.0 | 1.0 | 0.0 |
| 1.00 | 220.0 | 220.0 | 1.0 | 0.0 |
| 2.00 | 340.0 | 170.0 | 1.0 | 0.0 |
| 4.00 | 580.0 | 145.0 | 1.0 | 0.0 |
Every row is an equilibrium.
The nominal price levels move around a great deal as \(e\) varies.
Since \(e\) is the value of a unit of currency 2 in units of currency 1, a larger \(e\) means currency 2 is worth more, which raises \(p_1\) and lowers \(p_2\).
But the last two columns tell the real story: total real balances are \(w_1 - w_2 = 1\) regardless of \(e\), and markets clear exactly.
The real allocation is identical in every one of these equilibria.
The model determines what people consume and how much purchasing power the currency stock commands; it says nothing whatever about the rate at which the two monies exchange.
This is a sharp version of a problem that has haunted international monetary theory.
The indeterminacy is not a matter of a few isolated equilibria: every \(e \geq 0\) is one.
That \(e\) leaves the real allocation untouched does depend on equal money growth rates, as Exercise 90.3 shows.
90.6. Where this leaves us#
We now have two models in which rational expectations is silent about something we would very much like to predict.
There are three ways to respond.
The first is to add restrictions to the environment until the equilibrium becomes unique.
The second is to declare the indeterminacy a genuine feature of the world and, in a tradition that runs back to Ricardo and Wicksell, to criticize the arrangements that cause it; the book calls a regime that leaves the exchange rate history-dependent “an ill-formed mechanism”.
The third — the one this series pursues — is to ask what happens when we replace the rational agents with adaptive ones and watch where the system goes.
This is a substantive change, not a technicality.
An adaptive agent is not endowed with the equilibrium; it has beliefs, a rule for revising them, and initial conditions.
Those extra objects are exactly what the rational expectations equilibrium conditions failed to pin down, so a system of adaptive agents can select an outcome where rational expectations could not.
The rest of this series takes that idea seriously, and the results are mixed in an instructive way.
In the overlapping generations monetary economy of Adaptive Agents in an Overlapping Generations Monetary Economy, least squares learning selects the opposite equilibrium from the one the rational expectations dynamics converge to (with no deficit, the bubbleless one), and human experimental subjects side with the adaptive model.
In the two-currency model of Exchange Rate Indeterminacy, Learning, and Experiments, adaptive agents do pin the exchange rate down, but only by making it depend on where their beliefs started and on how their algorithm is tuned.
The rest points of the learning algorithm reproduce the indeterminacy exactly; what fixes the outcome is what the book calls the dead hand of history, and it grants that this “may seem a weak reed on which to base exchange rate determination.”
Learning does not select an exchange rate so much as remember one.
In a Kiyotaki–Wright search economy, the classifier-system agents of Money as a Medium of Exchange among Artificially Intelligent Agents learn to use a medium of exchange.
But in one of its economies, where the speculative equilibrium is the unique stationary equilibrium for patient agents, they settle on the fundamental pattern of trade instead.
That is not learning selecting among equilibria; it is convergence to an outcome that is not an equilibrium of the economy the agents live in.
Marimon, McGrattan and Sargent suspected early myopia, and that lecture shows why: the way the classifier systems assign credit makes the agents effectively very impatient.
In the first two cases the algorithm supplies what the equilibrium concept did not; in the third it overrides the equilibrium concept.
Whether such outcomes are discoveries about economies or artifacts of the algorithm is the question the series keeps returning to, and 1993 Prospects for Bounded Rationality in Macroeconomics renders a verdict.
90.7. Exercises#
Exercise 90.1
The relaxation algorithm (90.3) converges for the static market if and only if \(\lambda < 2 / (1 + bn/\gamma)\).
The ratio \(bn/\gamma\) measures the slope of demand relative to the curvature of costs, so a market with steep demand and near-linear costs is one in which the naive cobweb (\(\lambda = 1\)) is badly behaved.
Verify the stability boundary numerically: for a grid of values of \(bn/\gamma\), find the largest \(\lambda\) (on a fine grid) for which the algorithm converges, and compare with the analytical prediction.
Now let the relaxation parameter decline with the iteration count, \(\lambda_k = 1/k\). Show that the algorithm converges to \(X^*\) for every slope, including slopes at which the cobweb and most fixed values of \(\lambda\) fail. Explain why, using the differential equation \(dX/d\tau = h(X) - X\) of One recursion, many learners.
Solution
For part 1, we test convergence by iterating 400 times and asking whether the last step is smaller than \(10^{-8}\).
def converges(slope, λ, n_iter=400, tol=1e-8):
    """Does the relaxation algorithm converge when h'(X) = -slope?"""
    a_, X = 10.0, 1.0
    for _ in range(n_iter):
        X_new = X + λ * ((a_ - slope * X) - X)
        if not np.isfinite(X_new) or abs(X_new) > 1e12:
            return False
        X, X_prev = X_new, X
    return abs(X - X_prev) < tol


λ_grid = np.linspace(0.01, 1.5, 300)
rows = []
for slope in (0.5, 1.0, 1.5, 2.0, 4.0):
    ok = [λ for λ in λ_grid if converges(slope, λ)]
    rows.append((slope, max(ok) if ok else np.nan, 2 / (1 + slope)))

pd.DataFrame(rows, columns=["$bn/\\gamma$", "largest $\\lambda$ found",
                            "$2/(1 + bn/\\gamma)$"]).round(3)
| $bn/\gamma$ | largest $\lambda$ found | $2/(1 + bn/\gamma)$ | |
|---|---|---|---|
| 0 | 0.5 | 1.296 | 1.333 |
| 1 | 1.0 | 0.972 | 1.000 |
| 2 | 1.5 | 0.777 | 0.800 |
| 3 | 2.0 | 0.648 | 0.667 |
| 4 | 4.0 | 0.389 | 0.400 |
The numerical boundary sits consistently a little below the analytical one, and that gap is not grid spacing; it is a real feature of the test.
As \(\lambda\) approaches the boundary the multiplier \(m = 1 - \lambda(1 + bn/\gamma)\) approaches \(-1\), so convergence becomes arbitrarily slow, and a test with a fixed iteration count and tolerance declares failure just before the true boundary.
The size of the gap is predictable.
Starting from \(X_0 = 1\), the last step of the test has size \(|X_{400} - X_{399}| = \lambda \, |9 - bn/\gamma| \, |m|^{399}\), so the test passes only while that is below \(10^{-8}\).
fine = np.linspace(0.01, 1.5, 1_000_001)
predicted = []
for slope in (0.5, 1.0, 1.5, 2.0, 4.0):
    m = np.abs(1 - fine * (1 + slope))
    with np.errstate(over='ignore'):
        passes = (m < 1) & (fine * abs(9 - slope) * m ** 399 < 1e-8)
    predicted.append(fine[passes].max())

pd.DataFrame({"$bn/\\gamma$": [0.5, 1.0, 1.5, 2.0, 4.0],
              "found": [r[1] for r in rows],
              "predicted by the test": predicted,
              "true boundary": [r[2] for r in rows]}).round(3)
| $bn/\gamma$ | found | predicted by the test | true boundary | |
|---|---|---|---|---|
| 0 | 0.5 | 1.296 | 1.299 | 1.333 |
| 1 | 1.0 | 0.972 | 0.975 | 1.000 |
| 2 | 1.5 | 0.777 | 0.780 | 0.800 |
| 3 | 2.0 | 0.648 | 0.650 | 0.667 |
| 4 | 4.0 | 0.389 | 0.391 | 0.400 |
The predicted cutoffs lie just above the grid values found, within one grid step.
Note the first row: when \(bn/\gamma < 1\) the boundary exceeds one, so the naive cobweb converges on its own and no damping is needed.
Damping is what buys convergence in the steep markets, and with a fixed \(\lambda\) the steeper the market the more damping is required.
For part 2, we run the declining-gain version from the same starting point and report the distance from \(X^*\) after 400 and 4000 iterations.
def relax_declining(slope, n_iter):
    "Distance from X* after n_iter steps of relaxation with λ_k = 1/k."
    a_, X = 10.0, 1.0
    for k in range(1, n_iter + 1):
        X = X + (1 / k) * ((a_ - slope * X) - X)
    return abs(X - a_ / (1 + slope))


slopes = (0.25, 0.5, 1.5, 4.5, 19.5)
pd.DataFrame({"$bn/\\gamma$": slopes,
              "fixed-λ bound": [2 / (1 + s_) for s_ in slopes],
              "error, k = 400": [relax_declining(s_, 400) for s_ in slopes],
              "error, k = 4000": [relax_declining(s_, 4000) for s_ in slopes]})
| $bn/\gamma$ | fixed-λ bound | error, k = 400 | error, k = 4000 | |
|---|---|---|---|---|
| 0 | 0.25 | 1.600000 | 7.986362e-04 | 4.489482e-05 |
| 1 | 0.50 | 1.333333 | 2.000047e-04 | 6.319365e-06 |
| 2 | 1.50 | 0.800000 | 3.985628e-07 | 1.255046e-09 |
| 3 | 4.50 | 0.363636 | 6.861178e-14 | 1.088019e-14 |
| 4 | 19.50 | 0.097561 | 1.110223e-16 | 1.110223e-16 |
Every slope converges, including \(bn/\gamma = 19.5\), where any fixed \(\lambda\) above \(0.1\) fails.
With \(\lambda_k = 1/k\) the error is multiplied at step \(k\) by \(1 - (1 + bn/\gamma)/k\); once \(k > (1 + bn/\gamma)/2\) every step contracts, and the product of the multipliers behaves like \(k^{-(1 + bn/\gamma)}\), which goes to zero whatever the slope.
The differential equation says the same thing: in the rescaled time \(\tau_k = 1 + \tfrac12 + \cdots + \tfrac1k \approx \log k\) the iteration tracks \(dX/d\tau = h(X) - X\), whose solution \(X(\tau) - X^* = e^{(h' - 1)\tau}\bigl(X(0) - X^*\bigr) \approx k^{h' - 1}\bigl(X(0) - X^*\bigr)\) is stable whenever \(h' < 1\), which every downward-sloping \(h\) satisfies.
With a declining gain, then, a steeper market converges faster, the reverse of the fixed-gain case; the cost is that in flat markets the error shrinks only like a power of \(k\) (compare the two error columns in the first row), where a well-chosen fixed \(\lambda\) would shrink it geometrically.
Exercise 90.2
The equilibrium (90.16) was derived without checking that it makes economic sense.
Show that a monetary equilibrium requires \(\mu < w_1 / w_2\), by finding what goes wrong with the demand for real balances when money grows faster than that.
Solution
Along the \(c = 0\) equilibrium, real balances are constant at \(M_t / p_t = \gamma^{-1} = w_1 - \mu w_2\).
This is positive only when \(\mu < w_1 / w_2\).
If money grows faster, (90.16) still “solves” the functional equation, but it asks the household to hold a negative quantity of currency.
w1, w2 = 2.0, 1.0
μ_grid = np.array([0.5, 1.0, 1.5, 1.9, 2.0, 2.5])

with np.errstate(divide='ignore'):        # γ is infinite exactly at μ = w1/w2
    table = pd.DataFrame({
        "$\\mu$": μ_grid,
        "$\\gamma = (w_1 - \\mu w_2)^{-1}$": 1 / (w1 - μ_grid * w2),
        "real balances $w_1 - \\mu w_2$": w1 - μ_grid * w2,
        "monetary equilibrium?": np.where(μ_grid < w1 / w2, "yes", "no"),
    }).round(3)
table
| $\mu$ | $\gamma = (w_1 - \mu w_2)^{-1}$ | real balances $w_1 - \mu w_2$ | monetary equilibrium? | |
|---|---|---|---|---|
| 0 | 0.5 | 0.667 | 1.5 | yes |
| 1 | 1.0 | 1.000 | 1.0 | yes |
| 2 | 1.5 | 2.000 | 0.5 | yes |
| 3 | 1.9 | 10.000 | 0.1 | yes |
| 4 | 2.0 | inf | 0.0 | no |
| 5 | 2.5 | -2.000 | -0.5 | no |
At \(\mu = w_1 / w_2 = 2\) the demand for real balances hits zero and \(\gamma\) blows up; beyond it, both are negative.
The intuition runs through (90.12): the household holds currency only if the expected loss of purchasing power, \(p^*_{t+1} / p_t\), is smaller than \(w_1 / w_2\).
Money growing at rate \(\mu\) produces inflation at rate \(\mu\), so \(\mu \geq w_1 / w_2\) drives the demand for money to zero, the same boundary that the bubble equilibria approach asymptotically from below.
Exercise 90.3
In the two-currency example we set \(\mu_1 = \mu_2 = 1\) and found that the real allocation was the same at every exchange rate.
That is special.
Repeat the calculation with \(\mu_1 \neq \mu_2\) — say \(\mu_1 = 1.0\) and \(\mu_2 = 1.3\), with \(w_1 = 2\), \(w_2 = 1\), \(M_{1,0} = M_{2,0} = 100\), and \(c = 0\) — and compute total real balances at several exchange rates over the first several periods.
Does the choice of \(e\) still leave the real allocation untouched?
Solution
With \(c = 0\), total real balances in units of currency 1 are \((M_{1t} + e M_{2t}) / (\gamma_1 M_{1t} + \gamma_2 e M_{2t})\).
w1, w2 = 2.0, 1.0
μ1, μ2 = 1.0, 1.3
γ1, γ2 = 1 / (w1 - μ1 * w2), 1 / (w1 - μ2 * w2)
t = np.arange(10)
M1, M2 = 100.0 * μ1 ** t, 100.0 * μ2 ** t

def real_balances(e):
    p1 = γ1 * M1 + γ2 * e * M2
    return (M1 + e * M2) / p1

pd.DataFrame({f"e = {e}": real_balances(e) for e in (0.25, 1.0, 4.0)},
             index=pd.Index(t, name="t")).round(4)
| e = 0.25 | e = 1.0 | e = 4.0 | |
|---|---|---|---|
| t | |||
| 0 | 0.9211 | 0.8235 | 0.7447 |
| 1 | 0.9049 | 0.8050 | 0.7356 |
| 2 | 0.8871 | 0.7879 | 0.7282 |
| 3 | 0.8681 | 0.7725 | 0.7221 |
| 4 | 0.8485 | 0.7591 | 0.7173 |
| 5 | 0.8290 | 0.7476 | 0.7135 |
| 6 | 0.8101 | 0.7380 | 0.7105 |
| 7 | 0.7926 | 0.7301 | 0.7081 |
| 8 | 0.7767 | 0.7237 | 0.7063 |
| 9 | 0.7627 | 0.7186 | 0.7049 |
The same paths in a figure:
fig, ax = plt.subplots(figsize=(7, 4))
for e in (0.25, 1.0, 4.0):
    ax.plot(t, real_balances(e), 'o-', ms=3, lw=1, label=f"$e = {e}$")
ax.axhline(1 / γ1, color='k', lw=0.8, ls='--', label=r"$1/\gamma_1$")
ax.axhline(1 / γ2, color='gray', lw=0.8, ls=':', label=r"$1/\gamma_2$")
ax.set_xlabel("$t$")
ax.set_ylabel("total real balances")
ax.legend(frameon=False)
plt.show()
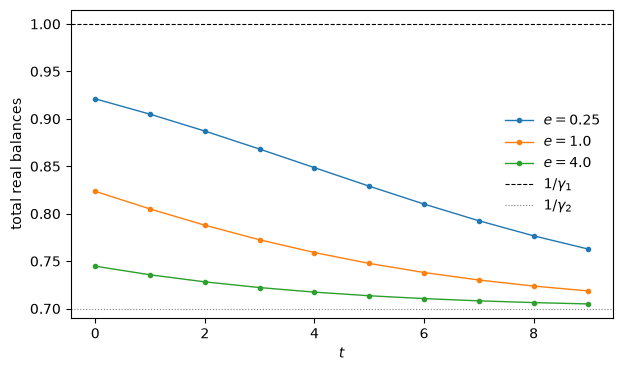
No.
With unequal money growth rates the exchange rate affects the real allocation, and the allocation is no longer even constant over time.
The reason is that \(\gamma_1 \neq \gamma_2\): the two currencies are valued differently because they are expected to be diluted at different rates, so the composition of the currency stock matters, and \(e\) is what fixes that composition.
Since currency 2 grows faster, it comes to dominate the stock whatever \(e\) we choose, and real balances converge to \(1/\gamma_2\) from wherever \(e\) starts them.
So the irrelevance of \(e\) for the real allocation is a knife-edge: it needs \(\mu_1 = \mu_2\) (with any common growth rate \(\mu\), real balances are \(w_1 - \mu w_2\) at every \(e\)).
The indeterminacy of \(e\) is not a knife-edge: every \(e\) in the table is still an equilibrium, but now the choice among them has real consequences.
Exercise 90.4
Muth’s result says that exponential smoothing with \(\lambda = 1 - \theta\) is the optimal forecast of \(X_{t+k}\) at every horizon \(k\), but Fig. 90.2 checked only \(k = 1\).
Show that for (90.5) the conditional expectation \(E_t X_{t+k}\) is the same for every \(k \geq 1\), that it equals the exponentially smoothed value with \(\lambda = 1 - \theta\), and that the \(k\)-step forecast error has variance \(1 + (k - 1)(1 - \theta)^2\) when \(\mathbb{V}[\epsilon_t] = 1\).
Verify the result numerically at \(k = 4\), reusing
smoothing_mse.
Solution
Write \(X_{t+k} = X_t + \sum_{j=1}^{k} (\epsilon_{t+j} - \theta \epsilon_{t+j-1})\).
Every shock dated after \(t\) has conditional mean zero, so \(E_t X_{t+k} = X_t - \theta \epsilon_t \equiv f_t\) for every \(k \geq 1\).
Since \(\epsilon_t = X_t - f_{t-1}\), we have \(f_t = X_t - \theta(X_t - f_{t-1}) = (1 - \theta) X_t + \theta f_{t-1}\), which is (90.4) with \(\lambda = 1 - \theta\).
The forecast error is
whose variance is \(1 + (k - 1)(1 - \theta)^2\).
Here is the numerical check, on the same shocks as the figure.
k = 4
rows = []
for θ in (0.2, 0.5, 0.8):
    X = np.cumsum(ε[1:] - θ * ε[:-1])
    mse = np.array([smoothing_mse(X, λ, k) for λ in grid])
    rows.append((θ, grid[mse.argmin()], 1 - θ, mse.min(), 1 + (k - 1) * (1 - θ) ** 2))

pd.DataFrame(rows, columns=["$\\theta$", "best $\\lambda$", "$1 - \\theta$",
                            "min MSE", "$1 + (k-1)(1-\\theta)^2$"]).round(3)
| $\theta$ | best $\lambda$ | $1 - \theta$ | min MSE | $1 + (k-1)(1-\theta)^2$ | |
|---|---|---|---|---|---|
| 0 | 0.2 | 0.79 | 0.8 | 2.916 | 2.92 |
| 1 | 0.5 | 0.50 | 0.5 | 1.749 | 1.75 |
| 2 | 0.8 | 0.20 | 0.2 | 1.121 | 1.12 |
At horizon 4 the best weight is again \(1 - \theta\), up to the grid and sampling noise, and the minimized mean squared error matches the formula.
The error variance grows with the horizon, but the forecast does not change: the same smoothed value is optimal at every horizon.
Exercise 90.5
In Bray’s market (90.8) with a constant gain \(\lambda\) below the stability bound, beliefs never settle down.
Show that the belief error \(e_t = X^*_t - X^*\) is a stationary first-order autoregression with variance
\[ V(\lambda) = \frac{\lambda \sigma_u^2}{(1 - h')\bigl(2 - \lambda(1 - h')\bigr)} . \]Using
learnfrom From relaxation to learning: Bray’s market, simulate 100,000 periods for \(\lambda \in \{0.025, 0.05, 0.1, 0.2, 0.4\}\) and compare the sample variance of \(e_t\) with \(V(\lambda)\). How does the spread of beliefs scale with the gain?
Solution
From (90.8), \(e_t = \rho e_{t-1} + \lambda u_t\) with \(\rho = 1 - \lambda(1 - h')\).
Below the bound \(|\rho| < 1\), so \(e_t\) is a stationary autoregression with variance \(\lambda^2 \sigma_u^2 / (1 - \rho^2)\), and \(1 - \rho^2 = \lambda (1 - h')\bigl(2 - \lambda(1 - h')\bigr)\) gives the formula.
The simulation starts beliefs at \(X^*\) and drops the first 1,000 periods.
u_long = σ_u * np.random.default_rng(2).standard_normal(100_000)
h_prime = -b * n / γ

rows = []
for λ in (0.025, 0.05, 0.1, 0.2, 0.4):
    e = learn(lambda t: λ, u_long, X0=X_star)[1_000:] - X_star
    V = λ * σ_u**2 / ((1 - h_prime) * (2 - λ * (1 - h_prime)))
    rows.append((λ, e.var(), V, e.var() / λ))

pd.DataFrame(rows, columns=["gain $\\lambda$", "sample variance", "$V(\\lambda)$",
                            "variance / $\\lambda$"]).round(5)
| gain $\lambda$ | sample variance | $V(\lambda)$ | variance / $\lambda$ | |
|---|---|---|---|---|
| 0 | 0.025 | 0.00129 | 0.00129 | 0.05147 |
| 1 | 0.050 | 0.00266 | 0.00267 | 0.05318 |
| 2 | 0.100 | 0.00570 | 0.00571 | 0.05704 |
| 3 | 0.200 | 0.01332 | 0.01333 | 0.06661 |
| 4 | 0.400 | 0.03991 | 0.04000 | 0.09978 |
The sample variances match the formula.
For small gains \(V(\lambda) \approx \lambda \sigma_u^2 / \bigl(2(1 - h')\bigr)\), so the variance of beliefs is proportional to the gain and their standard deviation to its square root; the ratio in the last column creeps up at larger gains because of the second factor in the denominator.
A constant-gain learner therefore converges only in distribution, to a cloud around \(X^*\) that collapses to a point only as \(\lambda \to 0\).
Adaptive Learning and Escape Dynamics shows what such a cloud can do in a model with richer feedback: escape.