101. Optimal Misspecified Beliefs#
101.1. Overview#
This lecture continues the study of Phillips curve tradeoffs.
It follows chapter 6 of Sargent [1999].
In Adaptive Expectations and the Phelps Problem the public forecast inflation with a fixed adaptive rule whose parameter \(\lambda\) we simply chose.
That was unsatisfying in a way the vindication story of The Rise and Fall of U.S. Inflation cannot afford: a free parameter describing expectations is exactly what rational expectations was meant to eliminate.
Here we take the first step toward earning that parameter, by letting agents choose it to fit the data their own beliefs generate.
We describe three conceptual issues that recur throughout this suite of lectures:
how to formulate equilibria in which agents share a common misspecified least squares forecasting model,
how expectations can contribute independent dynamics within equilibria, and
how the classic adaptive expectations scheme can use second moments to approximate a first moment.
To expose these issues we temporarily set aside the Phillips curve and work with Bray [1982]’s simple model of the price of a single good, a workhorse for studying bounded rationality.
From relaxation to learning: Bray’s market presents Bray’s model as the relaxation algorithm with a gain of \(1/t\), and Least Squares Learning in Self-Referential Models studies least squares learning in it.
We alter Bray’s model to illustrate an equilibrium concept that merges aspects of rational and adaptive expectations in a new way, and that we apply to the Phillips curve in Self-Confirming Equilibria.
The focus is on market equilibrium with optimal but misspecified forecasts.
Optimal means the free parameters of the forecasting scheme are chosen by (nonlinear) least squares.
Misspecified means the forecasting model is wrong in functional form, or uses too small an information set.
A distinctive feature is that the true model depends on how the agents’ model is misspecified: agents’ beliefs affect their behavior, which shapes the data they then fit.
We will also see that the equilibrium depends on a detail of the agents’ model, a root \(\rho\) that they place just below one, and that the forecasting gain it delivers vanishes as \(\rho \to 1\).
We work in the frequency domain, so let’s import what we need:
import matplotlib.pyplot as plt
import numpy as np
from scipy.optimize import minimize_scalar
from scipy.signal import lfilter
101.2. An experiment in Bray’s lab#
Following Bray [1982], assume that
where \(u_t\) is IID with mean zero and variance \(\sigma_u^2\), \(a > 0\), \(b \in (0, 1)\), \(p_t\) is the market price, and \(p_{t+1}^e\) is the market’s expectation of next period’s price.
In the notation of From relaxation to learning: Bray’s market, Bray’s \(b\) is the feedback coefficient \(h'\).
The rational expectations equilibrium has \(p_{t+1}^e = \frac{a}{1-b}\) and \(p_t = \frac{a}{1-b} + u_t\).
Bray posited that \(p_{t+1}^e\) is the empirical average of past prices, and showed that when \(0 < b < 1\) this decreasing-gain scheme converges almost surely to the rational expectation \(\frac{a}{1-b}\).
During the transition, the state variable \(p_t^e\) contributes dynamics and makes the price serially correlated, but these dynamics are transitory: at the rational expectations equilibrium, \(p_t\) is a constant plus a serially uncorrelated shock.
101.2.1. Constant-gain adaptive expectations#
To let expectations impart persistent serial correlation, we depart from Bray and assume that the market has constant-gain adaptive expectations,
Bray’s scheme replaces \(C\) by \(\frac{1}{t}\), so that \(p_{t+1}^e\) becomes a sample average.
Fixing \(C\) instead discounts past observations, which arrests convergence to rational expectations and prevents \(p_{t+1}^e\) from converging to a constant.
Written as a distributed lag,
where \(L\) is the lag operator.
Equation (101.2) would be the linear least squares forecast if the price followed the integrated moving-average process
so the market perceives the price as composed of purely permanent and transitory components.
This is the answer to Muth [1960]’s inverse optimal-prediction problem in A Peculiar Definition of Bounded Rationality, with Muth’s moving-average coefficient equal to \(1 - C\).
Equivalently, the perceived model is a local-level model, a random walk observed with white noise.
For it, (101.2) is the steady-state Kalman filter of Convergence, and the gain \(C\) is tied to the ratio \(q/r\) of the variance of the random-walk innovation to that of the noise by \(q/r = C^2/(1 - C)\) (Exercise 101.4).
Muth asked for which process a given smoothing rule is optimal.
Here the process is generated by the rule, and agents choose the rule to fit the process.
101.2.2. The actual law of motion#
Substituting the belief (101.3) into (101.1) shows that when the market forecasts this way, its actions make the actual law of motion for the price
where \(\nu = \frac{a}{1-b}\) and \(f(L)\) is defined to match.
The price has mean \(\nu\) and spectral density
Notice that \(F\) depends on \(C\) through \(f\).
Let’s encode the true process.
class BrayModel:
    """
    Bray's price model with constant-gain adaptive expectations.

    ρ is the root of the agents' perceived ARMA(1,1) model, which stands in
    for the unit root of the integrated moving-average model (see below).
    """

    def __init__(self, a=1.0, b=0.5, σ_u=1.0, ρ=0.995, N=1024):
        self.a, self.b, self.σ_u, self.ρ, self.N = a, b, σ_u, ρ, N
        self.ν = a / (1 - b)
        ω = 2 * np.pi * np.arange(N) / N
        self.ω = ω
        self.z = np.exp(1j * ω)

    def true_spectrum(self, C):
        "Spectral density F(ω) of the actual price process, given belief C."
        b, z = self.b, self.z
        φ = (1 - C) / (1 - b * C)
        scale = 1 / (1 - b * C)
        f = scale * (1 - (1 - C) * z) / (1 - φ * z)
        return np.abs(f)**2 * self.σ_u**2

    def approx_spectrum(self, c, σ_ε2=1.0):
        "Spectral density G(ω) of the agent's approximating model."
        g = (1 - (1 - c) * self.z) / (1 - self.ρ * self.z)
        return np.abs(g)**2 * σ_ε2
101.3. Optimal misspecification#
Two facts about the actual law (101.5) motivate an equilibrium restriction on \(C\):
Given that the price obeys (101.5), the true linear least squares one-step forecasting rule is not a geometric distributed lag like (101.2).
Even restricting the forecast to the form (101.2), the best such rule would make \(C\) solve a forecast-error-minimization problem, so \(C\) is an outcome, not a free parameter.
A rational expectations equilibrium would repair both features.
Chapter 6 of Sargent [1999] softens the equilibrium concept, proceeding “in the spirit (but not the letter)” of Lucas and Prescott [1971] and Brock [1972]: we leave feature 1 untouched (agents keep the wrong functional form) while fixing feature 2 (they choose the best parameter within that form).
Think of putting a single individual into a market where everyone else (the “representative agent”) uses \(C\), so the price obeys (101.5).
This “big \(C\), little \(c\)” device is the “big \(Y\), little \(y\)” trick of Rational Expectations Equilibrium, applied to a forecasting rule rather than to a decision rule.
The individual chooses \(c\) to fit the best model of the form
by minimizing the one-step-ahead forecast error variance.
101.3.1. The perceived model and its root \(\rho\)#
A model with the exact unit root of (101.6) cannot be fitted to data that have a mean, and its spectral density is infinite at frequency zero.
Following Sargent [1999] (chapter 6, footnotes 4 and 5), the agents’ perceived model replaces the unit root by a root \(\rho\) slightly below one:
This is a stationary, mean-zero ARMA(1,1) model.
It has no constant, so it must use the near-unit-root persistence of \(1/(1 - \rho L)\) to fit the nonzero mean \(\nu\) of the price.
We treat \(\rho\) as a primitive of the perceived model, part of what agents believe, not as a numerical device: the equilibrium depends on it, as How the equilibrium depends on \rho shows.
Definition 101.1 (Best-estimate map)
Given \(C\) and the consequent price process (101.5), the individual’s best forecast parameter \(c = B(C)\) is the nonlinear least squares estimator of \(c\) in (101.7), where the data are generated by (101.5).
Inverting (101.7) gives the perceived model’s one-step-ahead forecast error \(\epsilon_t = g(L)^{-1} p_t\).
Applied to the actual price, this error has mean \(\nu / g(1) = \nu (1 - \rho)/c\) and a variance that we can compute from the spectral density \(F\).
Following the frequency-domain method of Hansen and Sargent [Hansen and Sargent, 1993], the best approximating \((c, \sigma_\epsilon^2)\) minimizes
where \(\omega_j = \frac{2\pi j}{N}\) and \(G(\omega, c) = |g(e^{i\omega})|^2 \sigma_\epsilon^2\) is the spectral density of the perceived model.
The term \(\frac{\nu^2}{G(0)} = \frac{\nu^2 (1 - \rho)^2}{c^2 \sigma_\epsilon^2}\) charges the perceived model for the squared mean of its forecast errors; this is how the model is made to use its near-unit root to fit the mean.
Concentrating out \(\sigma_\epsilon^2\) sets it equal to the mean square forecast error
The average of \(\log |g(e^{i\omega})|^2\) over frequencies is zero, by Kolmogorov’s formula for an invertible filter with \(g(0) = 1\).
So minimizing (101.8) over \(c\) is the same as minimizing \(\sigma_\epsilon^2(c)\): the agent chooses the \(c\) that minimizes the mean square one-step-ahead forecast error, computed under his model (101.7).
The mean term shows where \(\rho\) enters: a larger \(c\) shrinks the squared mean \(\nu^2 (1 - \rho)^2/c^2\), so the closer \(\rho\) is to one, the weaker the pull toward a large \(c\).
Definition 101.2 (Equilibrium under forecast misspecification)
An equilibrium under forecast misspecification is a fixed point \(C = B(C)\).
At such a fixed point the representative agent is representative: the single individual’s best parameter equals the one everyone uses.
def forecast_mse(F, ν, c, ρ, z):
    """
    Mean square one-step forecast error σ_ε^2(c) of the perceived model
    g(L) = (1 - (1-c)L)/(1 - ρL), when the true process has mean ν and
    spectral density F on the grid z = exp(iω).  ρ = 1 is allowed.
    """
    W = np.abs((1 - ρ * z) / (1 - (1 - c) * z))**2     # |1/g(e^{iω})|^2
    return np.mean(F * W) + ν**2 * W[0]                # variance + squared mean

def best_estimate(model, C):
    "The best-estimate map c = B(C)."
    F = model.true_spectrum(C)
    res = minimize_scalar(lambda c: forecast_mse(F, model.ν, c, model.ρ, model.z),
                          bounds=(1e-4, 0.99), method='bounded',
                          options={'xatol': 1e-10})
    return res.x

def solve_equilibrium(model, C0=0.3, tol=1e-10, maxit=500):
    "Iterate the best-estimate map to a fixed point."
    C = C0
    for _ in range(maxit):
        C_new = best_estimate(model, C)
        if abs(C_new - C) < tol:
            break
        C = C_new
    return C_new
Now we solve for the equilibrium of the baseline model.
bray = BrayModel(a=1.0, b=0.5, σ_u=1.0, ρ=0.995)
C_star = solve_equilibrium(bray)
print(f"equilibrium belief   C = {C_star:.4f}")
equilibrium belief C = 0.0805
For these parameters the equilibrium belief is \(C \approx 0.08\), reproducing the value reported in chapter 6 of Sargent [1999].
101.3.2. Forecast errors#
Three standard deviations of one-step-ahead forecast errors describe the equilibrium:
\(\bar\sigma_\epsilon\), the root mean square forecast error of the perceived model (101.7) at \(c = C\), including the mean of its errors: the square root of the minimized (101.9).
the root mean square error of the rule (101.2) that agents actually use. Its weights sum to one, so its errors have mean zero; it is \(\sigma_\epsilon\) computed with \(\rho = 1\).
\(\sigma_u / (1 - bC)\), the standard deviation of the innovation in the true process (101.5), the smallest one-step error that any forecaster who knew the true law could attain.
F_star = bray.true_spectrum(C_star)
c_star = best_estimate(bray, C_star)

σ_bar = np.sqrt(forecast_mse(F_star, bray.ν, c_star, bray.ρ, bray.z))
σ_rule = np.sqrt(forecast_mse(F_star, bray.ν, C_star, 1.0, bray.z))
σ_true = bray.σ_u / (1 - bray.b * C_star)

print(f"perceived model (ρ = {bray.ρ}):    {σ_bar:.4f}")
print(f"rule actually used (ρ = 1):     {σ_rule:.4f}")
print(f"true innovation σ_u/(1 - bC):   {σ_true:.4f}")
perceived model (ρ = 0.995):    1.0579
rule actually used (ρ = 1):     1.0530
true innovation σ_u/(1 - bC):   1.0419
The first number is the \(\bar\sigma_\epsilon\) that chapter 6 of Sargent [1999] reports.
The book gives \(1.0208\) for the last one, which is the square root of the value printed here.
The forecasts that agents actually make are only slightly worse than the best attainable ones.
101.3.3. What kind of equilibrium is this?#
The fixed point \(C = B(C)\) has several names in the later literature, each emphasizing a different feature.
It is a restricted-perceptions equilibrium (Evans and Honkapohja [2001], chapter 13): forecasts are optimal within a restricted class of models that excludes the truth.
For given \(C\), the best estimate \(c\) is a pseudo-true value in the sense of White [1982], the parameter of a misspecified model that comes closest to the truth. Unlike in White’s setting, here the truth itself depends on the agents’ parameter, through \(C\).
Up to constants, criterion (101.8) is the frequency-domain (Whittle) form of the Kullback–Leibler divergence of the perceived model from the true process. So the fixed point is also a Berk–Nash equilibrium in the sense of Esponda and Pouzo [2016], with the forecasting rule as the agents’ action.
Learning, Approximation, and Equilibrium Computation computes the same kind of object, which it calls an approximate equilibrium, for a saving rule restricted to a polynomial family.
There the agents’ fit is a least squares projection onto a basis; here it is a nonlinear fit of an ARMA model across the whole spectrum.
Because \(B\) works like a best-response map, we can ask whether agents who nudge their gain toward the best estimate would find the equilibrium.
The associated differential equation \(dC/d\tau = B(C) - C\) is the E-stability condition of One recursion, many learners: the fixed point is E-stable when \(B'(C^*) < 1\).
h = 1e-4
B_prime = (best_estimate(bray, C_star + h) - best_estimate(bray, C_star - h)) / (2 * h)
print(f"B'(C*) = {B_prime:.3f}")
B'(C*) = 0.148
Here \(0 < B'(C^*) < 1\), so the equilibrium is E-stable, and iterating \(B\) converges to it monotonically, which is how solve_equilibrium found it.
Why don’t the agents eventually discover that their model is wrong?
Kalai and Lehrer [1993] applied a merging theorem of Blackwell and Dubins [1962] to establish conditions under which forecasts must eventually merge with rational expectations.
The present model shuts off that mechanism at the outset: the agents’ model puts zero probability on events that have positive probability under the truth, violating the absolute continuity condition that merging requires.
With enough data, appropriate statistical tests would eventually tell agents how to improve their forecasts.
Kreps [1998] argues that sensible agents would eventually abandon a misspecified model that the data reject; Exercise 101.3 estimates how much data that would take here.
The answer lies in how far apart the true and approximating spectral densities are, which we now study.
101.4. Comparing the true and forecasting models#
For the equilibrium \(C\), we plot the equilibrium spectral densities of the true and approximating models.
G = bray.approx_spectrum(c_star, σ_bar**2)

half = bray.N // 2
fig, ax = plt.subplots(figsize=(8, 5))
ax.plot(bray.ω[:half], np.log(F_star[:half]), 'C0', label='true model', lw=2)
ax.plot(bray.ω[:half], np.log(G[:half]), 'C1--', label='forecasting model', lw=2)
ax.set_xlabel(r'angular frequency $\omega$')
ax.set_ylabel('log spectral density')
ax.legend()
plt.show()
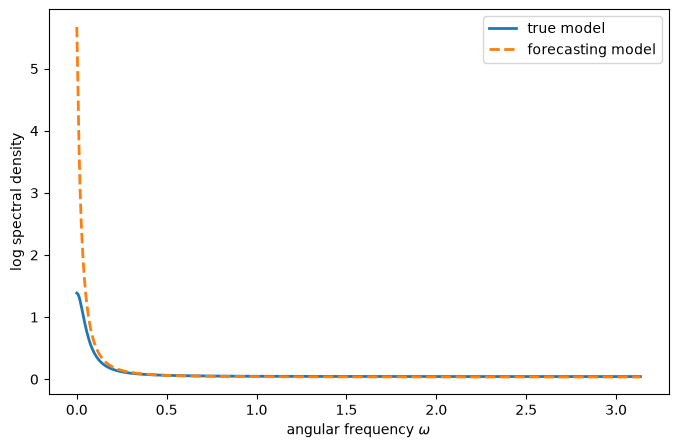
Fig. 101.1 Spectral densities of the true price process and of the agents’ approximating model#
In minimizing (101.8), the approximating model uses its near-unit-root to fit the mean.
The large gap between the spectral densities at low frequencies reflects how the approximating model fits a first moment (the mean \(\nu\)) with features of second moments (a spike in the spectral density at frequency zero).
The true spectral density decreases sharply with frequency — Granger’s “typical spectral shape” [Granger, 1966] — revealing substantial positive serial correlation in the price, because agents’ belief that the price is subject to permanent shocks makes shocks persist.
101.4.1. Impulse responses#
We compare the impulse response functions of the two models by feeding a unit shock through each moving-average representation.
The true process (101.5) and the perceived model (101.7) are driven by different shocks, \(u_t\) and \(\epsilon_t\).
To compare like with like, we normalize the true response by its impact effect \(f(0) = 1/(1 - bC)\), so that both models respond to a unit one-step-ahead forecast error.
def impulse_response(num, den, T=25):
    "IRF of (1 - num L)/(1 - den L)."
    h = np.empty(T)
    h[0] = 1.0
    for k in range(1, T):
        h[k] = den * h[k - 1]
    h[1:] -= num * h[:-1]           # apply the numerator (1 - num L)
    return h

φ = (1 - C_star) / (1 - bray.b * C_star)
irf_true = impulse_response(1 - C_star, φ)              # f(L) / f(0)
irf_approx = impulse_response(1 - c_star, bray.ρ)       # g(L)

lags = np.arange(len(irf_true))
fig, axes = plt.subplots(1, 2, figsize=(11, 4.5))
for ax, start in zip(axes, [0, 1]):
    ax.plot(lags[start:], irf_true[start:], 'C0o-', ms=4, label='true model', lw=2)
    ax.plot(lags[start:], irf_approx[start:], 'C1s--', ms=4,
            label='approximating model', lw=2)
    ax.set_xlabel('lag')
    ax.set_ylabel('response')
axes[0].set_title('all lags')
axes[1].set_title('lags 1 and beyond')
axes[0].legend()
plt.tight_layout()
plt.show()

print(f"response at lag 1:  true {irf_true[1]:.3f},  approximating {irf_approx[1]:.3f}")
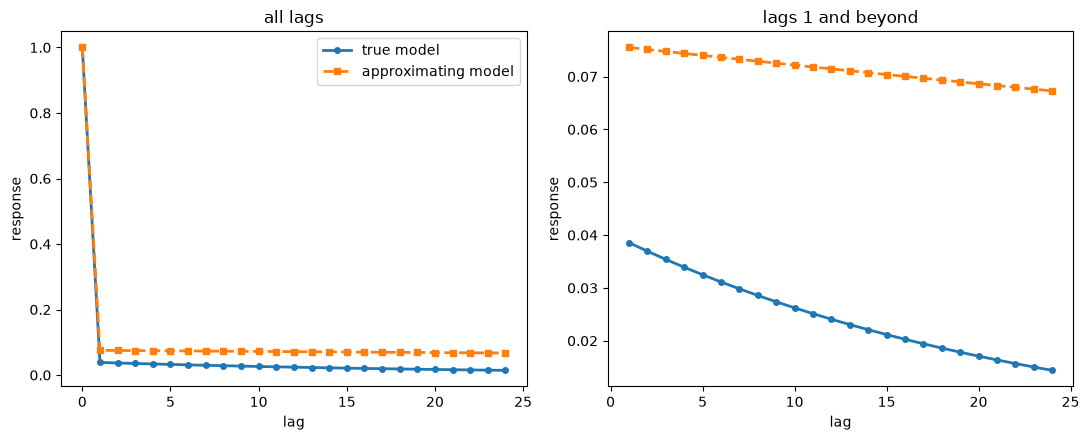
Fig. 101.2 Impulse responses of the true and approximating models to a unit one-step-ahead forecast error#
response at lag 1: true 0.039, approximating 0.076
The impulse response of the true model affirms the serial correlation in the price.
From lag one on, the true response lies below the approximating one: the approximating model over-predicts the effects of a shock at every horizon, and its near unit root makes those effects die out much more slowly, at rate \(\rho\) rather than \(\phi = (1 - C)/(1 - bC)\).
Chapter 6 of Sargent [1999] says that the approximating model under-predicts short-term consequences; that statement rests on comparing impact effects without the normalization, and so reflects only the different scales of the two shocks.
101.5. How the equilibrium depends on \(\rho\)#
Every number so far was computed with the perceived root \(\rho = 0.995\).
The next cell recomputes the equilibrium for values of \(\rho\) closer to one, and then for the exact unit root \(\rho = 1\) of the rule (101.2) itself.
We use a finer frequency grid, because the perceived spectral density has a spike at frequency zero whose width is about \(1 - \rho\).
print(f"{'ρ':>7} {'C*':>8} {'weight sum':>11} {'RMSE of rule':>13}")
for ρ in [0.98, 0.99, 0.995, 0.999, 0.9995]:
    m = BrayModel(a=1.0, b=0.5, σ_u=1.0, ρ=ρ, N=2**14)
    C = solve_equilibrium(m, C0=0.1)
    rmse = np.sqrt(forecast_mse(m.true_spectrum(C), m.ν, C, 1.0, m.z))
    print(f"{ρ:>7} {C:>8.4f} {1 - (1 - ρ) / C:>11.3f} {rmse:>13.4f}")

m1 = BrayModel(a=1.0, b=0.5, σ_u=1.0, ρ=1.0, N=2**14)
C_grid = np.linspace(0.005, 0.4, 40)
ratio = max(best_estimate(m1, C) / C for C in C_grid)
print(f"\nρ = 1: largest value of B(C)/C on the grid = {ratio:.3f}")
print(f"ρ = 1: best c given C = {C_star:.4f} is {best_estimate(m1, C_star):.4f}")
      ρ       C*  weight sum  RMSE of rule
   0.98   0.1901       0.895        1.1352
   0.99   0.1245       0.920        1.0846
  0.995   0.0805       0.938        1.0530
  0.999   0.0284       0.965        1.0181
 0.9995   0.0180       0.972        1.0114

ρ = 1: largest value of B(C)/C on the grid = 0.365
ρ = 1: best c given C = 0.0805 is 0.0274
As \(\rho\) rises toward one, the equilibrium gain \(C^*\) falls toward zero.
With the exact unit root, \(B(C) < C\) for every \(C\) on the grid, so iterating \(B\) drives \(C\) to zero, and the only fixed point is \(C = 0\).
That is the rational expectations equilibrium: with \(C = 0\) expectations stop moving, and the price is \(p_t = \nu + u_t\).
Accordingly, the root mean square error of the rule in the last column falls toward \(\sigma_u = 1\) as \(\rho \to 1\).
The mechanism is the mean term in (101.9).
A perceived model with \(\rho < 1\) forecasts with weights that sum to \(1 - (1 - \rho)/c < 1\) (the column “weight sum”), so its errors have mean \(\nu(1 - \rho)/c\).
A larger \(c\) shrinks that bias, and this pull toward a large \(c\) is what keeps \(C^*\) away from zero; as \(\rho \to 1\) the bias, and the pull, vanish.
There is a tension in the construction.
The price (101.5) is generated by the rule (101.2), whose weights sum to one, but the gain is chosen by fitting the \(\rho\)-model.
An agent who chose \(c\) to minimize the actual mean square error of the rule he uses would, in effect, set \(\rho = 1\), and the last line of output shows that he would pick a gain well below \(C^*\) (Exercise 101.2 confirms this by simulation).
So the equilibrium with \(C^* > 0\), and the persistent serial correlation that comes with it, exists for each fixed \(\rho < 1\) and disappears as \(\rho \to 1\).
The issue goes back to footnotes 4 and 5 of chapter 6 of Sargent [1999], where \(\rho < 1\) is introduced to keep the spectral density well defined.
It matters again in Self-Confirming Equilibria, where the better-than-Nash outcomes of an equilibrium with misspecified beliefs rest on it.
101.6. Lessons#
The agents in this model are boundedly rational, in the sense of A Peculiar Definition of Bounded Rationality: rational describes their use of least squares, and bounded describes their model misspecification.
Under rational expectations there is only one model in play.
Under bounded rationality there must be at least two: the one used by the boundedly rational agents, and the true one.
These mutually influence each other — the boundedly rational agents use their model to approximate the true one, and the true one reflects the decisions of the agents — and both differ from the rational expectations model.
The peculiar way that the adaptive expectations model uses a unit root to mimic a constant foreshadows a version of the Phillips curve model, developed in Self-Confirming Equilibria, that will help vindicate econometric policy evaluation, and whose good outcomes also depend on \(\rho < 1\).
The same trick — using a unit root to approximate a constant — drives the escape dynamics of Adaptive Learning and Escape Dynamics, where a learning government’s estimated distributed-lag Phillips curve drifts toward the induction hypothesis and, believing it, cuts inflation toward Ramsey.
In the static model of Escaping Nash Inflation, an escape instead makes the perceived Phillips curve vertical, which trivially satisfies the induction property.
101.7. Exercises#
Exercise 101.1
The equilibrium belief \(C\) depends on the feedback parameter \(b\) in (101.1).
Compute and plot the equilibrium \(C\) as a function of \(b \in \{0.1, 0.2, \ldots, 0.8\}\), holding \(a = 1\) and \(\sigma_u = 1\) fixed.
With \(a\) fixed, a change in \(b\) also changes the mean \(\nu = a/(1 - b)\) that the perceived model must fit. Repeat the calculation holding \(\nu = 2\) fixed, by setting \(a = 2(1 - b)\).
How much of the effect of \(b\) works through the mean? How does the persistence \(\phi = (1 - C)/(1 - bC)\) of the actual price change with \(b\)?
Solution
b_grid = np.arange(0.1, 0.85, 0.1)
C_a1 = np.array([solve_equilibrium(BrayModel(a=1.0, b=b)) for b in b_grid])
C_ν2 = np.array([solve_equilibrium(BrayModel(a=2 * (1 - b), b=b)) for b in b_grid])
φ_a1 = (1 - C_a1) / (1 - b_grid * C_a1)

fig, ax = plt.subplots(figsize=(8, 4.5))
ax.plot(b_grid, C_a1, 'o-', lw=2, label=r'$a = 1$ (mean $\nu$ rises with $b$)')
ax.plot(b_grid, C_ν2, 's--', lw=2, label=r'$\nu = 2$ held fixed')
ax.set_xlabel('feedback parameter $b$')
ax.set_ylabel('equilibrium belief $C$')
ax.legend()
plt.show()

print(f"a = 1:   C from {C_a1[0]:.3f} to {C_a1[-1]:.3f},  "
      f"ν from {1 / (1 - b_grid[0]):.2f} to {1 / (1 - b_grid[-1]):.2f}")
print(f"ν = 2:   C from {C_ν2[0]:.3f} to {C_ν2[-1]:.3f}")
print(f"persistence φ ranges from {φ_a1.min():.3f} to {φ_a1.max():.3f}")
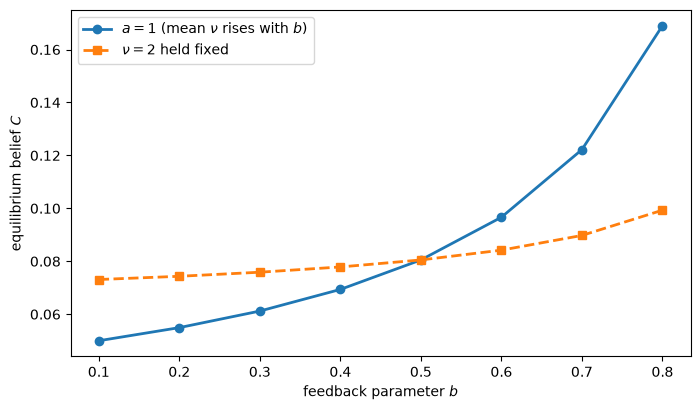
a = 1:   C from 0.050 to 0.169,  ν from 1.11 to 5.00
ν = 2:   C from 0.073 to 0.099
persistence φ ranges from 0.955 to 0.961
With \(a = 1\), stronger feedback raises the equilibrium gain a great deal, but it also raises the mean \(\nu\) that the perceived model must fit.
Holding \(\nu\) fixed, the gain rises much less.
Most of the effect of \(b\) therefore works through the mean: a larger mean makes the bias \(\nu(1 - \rho)/c\) of the perceived model costlier, so agents choose a larger gain.
The persistence \(\phi\) of the actual price barely changes, so stronger feedback does not make the price process noticeably less persistent.
Exercise 101.2
The best-estimate map is computed in the frequency domain, under the perceived model (101.7).
Check what the equilibrium implies in the time domain.
Simulate the market (101.1)–(101.2) with \(C = C^*\) for one million periods.
For a grid of values of \(c\), compute the mean square error of the forecast \(p^e_{t+1}(c) = c\, p_t + (1 - c) p^e_t(c)\) of \(p_{t+1}\).
Which \(c\) minimizes it?
Compare it with \(C^*\) and with the exact-unit-root best estimate printed in How the equilibrium depends on \rho.
Solution
Substituting (101.2) into (101.1) gives \(p_t = [a + b(1 - C) p^e_t + u_t]/(1 - bC)\), and then \(p^e_{t+1} = \phi\, p^e_t + C(a + u_t)/(1 - bC)\) with \(\phi = (1 - C)/(1 - bC)\).
rng = np.random.default_rng(0)
T, burn = 1_000_000, 10_000
a, b, C = bray.a, bray.b, C_star
u = rng.standard_normal(T)

φ = (1 - C) / (1 - b * C)
pe_next = lfilter([C / (1 - b * C)], [1, -φ], a + u, zi=[φ * bray.ν])[0]
pe = np.concatenate([[bray.ν], pe_next[:-1]])                 # p^e_t
p = (a + b * (1 - C) * pe + u) / (1 - b * C)

def rmse(c):
    "Root mean square error of the forecast c p_t + (1-c) p^e_t of p_{t+1}."
    f = lfilter([c], [1, -(1 - c)], p, zi=[(1 - c) * bray.ν])[0]
    return np.sqrt(np.mean((p[burn + 1:] - f[burn:-1])**2))

c_grid = np.linspace(0.005, 0.15, 59)
errors = np.array([rmse(c) for c in c_grid])

fig, ax = plt.subplots(figsize=(8, 4.5))
ax.plot(c_grid, errors, lw=2)
ax.axvline(C_star, color='k', ls='--', lw=1, label='$C^*$')
ax.set_xlabel('gain $c$')
ax.set_ylabel('RMSE of the forecast')
ax.legend()
plt.show()

print(f"RMSE-minimizing c = {c_grid[errors.argmin()]:.3f},  C* = {C_star:.4f}")
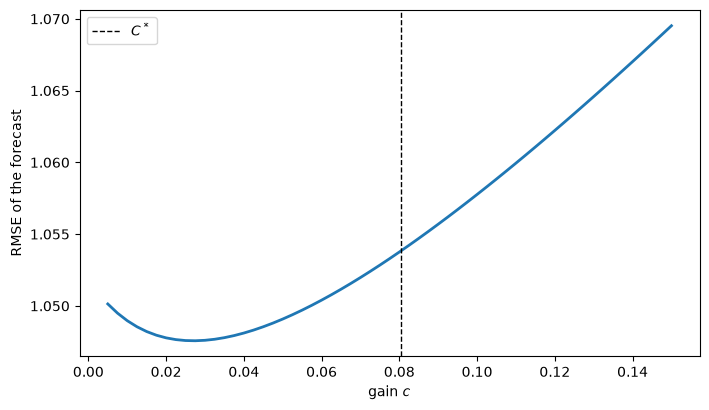
RMSE-minimizing c = 0.027, C* = 0.0805
The gain that minimizes the actual forecast error is far below \(C^*\) and close to the exact-unit-root best estimate of How the equilibrium depends on \rho.
An individual who judged the rule (101.2) by its actual forecast errors would not choose \(C^*\).
\(C^*\) is a best response only within the perceived model (101.7), whose mean penalty does not apply to the rule that agents actually use, because that rule’s errors have mean zero.
Exercise 101.3
How much data would agents need to detect that their model is wrong?
For Gaussian processes, the expected log-likelihood ratio per observation of the true model (101.5) against the perceived model (101.7) (at \(c = B(C^*)\) and the fitted \(\bar\sigma_\epsilon^2\)) is the Kullback–Leibler divergence rate.
Using the concentrated criterion and Kolmogorov’s formula, show that this rate equals \(\log(\bar\sigma_\epsilon / \sigma_{\rm true})\), with \(\sigma_{\rm true} = \sigma_u/(1 - bC^*)\).
Compute it, and the number of observations it takes for the expected log-likelihood ratio to reach 3 (a likelihood ratio of about 20).
Confirm the rate by simulating the log-likelihood ratio.
Solution
The Kullback–Leibler divergence rate of a mean-zero Gaussian model with spectral density \(G\) from a Gaussian process with mean \(\nu\) and spectral density \(F\) is
At the fitted \(\bar\sigma_\epsilon^2\), the terms \(\frac{1}{N}\sum_j F/G + \nu^2/G(0)\) add up to one.
By Kolmogorov’s formula, the average of \(\log G\) is \(\log \bar\sigma_\epsilon^2\) and the average of \(\log F\) is \(\log \sigma_{\rm true}^2\), the log one-step prediction variance of the true process.
So the rate is \(\frac{1}{2}\log(\bar\sigma_\epsilon^2/\sigma_{\rm true}^2) = \log(\bar\sigma_\epsilon/\sigma_{\rm true})\).
kl = np.log(σ_bar / σ_true)
print(f"KL rate = {kl:.4f} nats per observation")
print(f"observations for an expected log-likelihood ratio of 3: {3 / kl:.0f}")

# simulate: true one-step errors are u_t/(1-bC); the perceived model's are g(L)^{-1} p_t
rng = np.random.default_rng(1)
T, burn = 200_000, 10_000
a, b, C = bray.a, bray.b, C_star
u = rng.standard_normal(T)
φ = (1 - C) / (1 - b * C)
pe_next = lfilter([C / (1 - b * C)], [1, -φ], a + u, zi=[φ * bray.ν])[0]
pe = np.concatenate([[bray.ν], pe_next[:-1]])
p = (a + b * (1 - C) * pe + u) / (1 - b * C)

e_true = u / (1 - b * C)
e_model = lfilter([1, -bray.ρ], [1, -(1 - c_star)], p)
llr = (-np.log(σ_true) - e_true**2 / (2 * σ_true**2)) \
    - (-np.log(σ_bar) - e_model**2 / (2 * σ_bar**2))
print(f"simulated mean log-likelihood ratio = {llr[burn:].mean():.4f}")
KL rate = 0.0152 nats per observation
observations for an expected log-likelihood ratio of 3: 198
simulated mean log-likelihood ratio = 0.0153
The divergence is about \(0.015\) nats per observation, so it takes roughly two hundred observations before the data favor the true model by a likelihood ratio of about 20, and that is for a statistician who already knows which alternative to test.
Exercise 101.4
Muth [1960] showed that the rule (101.2) is optimal for a random walk observed with noise.
Consider the local-level model \(p_t = \mu_t + \eta_t\), \(\mu_t = \mu_{t-1} + w_t\), with \(\mathbb{V}[w_t] = q\) and \(\mathbb{V}[\eta_t] = r\).
Show that the steady-state Kalman gain \(K\) for this model satisfies \(q/r = K^2/(1 - K)\), and that the Kalman filter’s forecast of \(p_{t+1}\) then has the form (101.2) with \(C = K\).
Set \(q/r = C^{*2}/(1 - C^*)\), iterate the Riccati equation of Convergence to its fixed point, and confirm that \(K = C^*\).
What does the implied signal-to-noise ratio say about how agents perceive the price?
Solution
With \(A = G = 1\), \(Q = q\), and \(R = r\), the Riccati equation of A First Look at the Kalman Filter for the one-step-ahead prediction variance \(\Sigma\) of \(\mu_t\) is \(\Sigma_{t+1} = \Sigma_t - \Sigma_t^2/(\Sigma_t + r) + q\).
At its fixed point, \(\Sigma r/(\Sigma + r) = \Sigma - q\), and the gain is \(K = \Sigma/(\Sigma + r)\).
Hence \((1 - K)\Sigma = \Sigma - q\), so \(\Sigma = q/K\), and substituting into \(K = \Sigma/(\Sigma + r)\) gives \(q/r = K^2/(1 - K)\).
The forecast of \(p_{t+1}\) is the forecast of \(\mu_{t+1}\), which equals the filtered estimate of \(\mu_t\): \(\hat\mu_{t+1} = \hat\mu_t + K(p_t - \hat\mu_t) = K p_t + (1 - K)\hat\mu_t\), which is (101.2) with \(C = K\).
r = 1.0
q = r * C_star**2 / (1 - C_star)
Σ = 1.0
for _ in range(10_000):
    Σ = Σ - Σ**2 / (Σ + r) + q
K = Σ / (Σ + r)
print(f"q/r = {q / r:.5f},  steady-state Kalman gain K = {K:.4f},  C* = {C_star:.4f}")
q/r = 0.00705, steady-state Kalman gain K = 0.0805, C* = 0.0805
The equilibrium beliefs imply a signal-to-noise ratio of less than one percent.
Agents perceive the price as almost entirely transitory noise around a level that drifts very slowly, and that slowly drifting level is how their model mimics the constant mean \(\nu\).