107. Drifts and Volatilities#
107.1. Overview#
The lectures in this section have told a story about how a government’s model of the Phillips curve, and the policy it induces, can drift over time.
In Adaptive Learning and Escape Dynamics and Escaping Nash Inflation a government that refits an approximating Phillips curve by constant-gain least squares escapes recurrently from a bad self-confirming equilibrium and is then drawn back toward it.
Priors, Escapes, and Learning Cycles shows how the government’s prior about drifting coefficients shapes those dynamics, and Econometric Policy Evaluation confronts the adaptive models with postwar U.S. data by maximum likelihood.
That confrontation was structural: it estimated a particular model of a learning government.
This lecture steps back to a reduced-form question that every one of those models has to answer.
It studies Cogley and Sargent [2005], which asks a deceptively simple question:
When we look at postwar U.S. time series on inflation, unemployment, and interest rates, do we see evidence that the dynamics have drifted?
Tim Cogley and Thomas Sargent began this work as an empirical companion to the Conquest book [Sargent, 1999] and to Cho et al. [2002], whose recurrent escapes generate nonlinearities that an econometrician would see as drifting coefficients.
It answers searching comments by Sims [2001] and Stock [2001] on an earlier paper [Cogley and Sargent, 2001], and it confronts evidence from Sims [1999] and Bernanke and Mihov [1998] that the coefficients of vector autoregressions had not changed.
That evidence bears on a question that organizes this whole section:
Was the Great Inflation of the 1970s and its conquest in the 1980s a story of bad policy, or of bad luck?
To let the data speak to that question we need a statistical model flexible enough to accommodate both answers.
That model is a Bayesian vector autoregression whose coefficients drift as random walks and whose shock variances evolve as stochastic volatilities.
It is the very specification that Sims [1988] and Chung [1990] handed their model governments: a Kalman filter on regression coefficients that are believed to drift as random walks (The econometricians did return the compliment).
There the government ran the filter to learn the Phillips curve; here the econometrician runs it to learn about the government.
Fitting the model requires a Markov chain Monte Carlo algorithm that combines the Kalman filter, the forward-filter/backward-sample smoother of Carter and Kohn [1994], and the stochastic-volatility sampler of Jacquier et al. [1994].
Companion-form vector autoregressions are treated in Linear State Space Models and Vector Autoregressions for Subsets of Variables, and the Kalman filter in A First Look at the Kalman Filter.
No other QuantEcon lecture covers the Kalman smoother, so this lecture introduces it inside the sampler, and Exercise 108.1 shows why it matters here.
We fit the model to Cogley and Sargent’s sample, which ends in 2000; Drifts and Volatilities after 2000 re-estimates it with another quarter-century of data.
Let’s start with some imports and the URL for the data.
import time

import matplotlib.pyplot as plt
import numpy as np
import pandas as pd
from IPython.display import display
from scipy import linalg
from scipy.special import expit
from threadpoolctl import threadpool_limits

# The matrices in this lecture are small, so extra BLAS threads only add overhead.
threadpool_limits(1)

data_url = 'https://github.com/QuantEcon/data-lectures/raw/main/lectures/NEWQDATA.csv'
107.2. Bad policy or bad luck?#
Two respectable views compete to explain the American Great Inflation.
The bad policy view is the one dramatized throughout this section and in the Conquest book [Sargent, 1999].
Something about Arthur Burns’s model of the economy, his patience, or his inability to commit to a better rule led the Federal Reserve to administer monetary policy in a way that produced the greatest peacetime inflation in U.S. history, while an improved model, more patience, or greater discipline led Paul Volcker to conquer it [DeLong, 1997, Taylor, 1997].
The two stories that open The Rise and Fall of U.S. Inflation, triumph and vindication, are both versions of this view: they disagree about how the Fed’s model improved, not about whether policy changed.
On this view, what changed between the 1970s and the 1980s was the systematic part of policy, namely the way the Fed’s interest-rate setting responded to inflation and unemployment.
The bad luck view rejects both stories.
What distinguished the Burns and Volcker eras was not their models or policies, but the shocks that hit the economy.
On this view the coefficients of a reduced-form description of the economy were essentially constant, and what changed was the size of the disturbances, namely the volatility.
Classical tests supported the second view.
Sims [1999] and Bernanke and Mihov [1998] could not reject the hypothesis that VAR coefficients were time invariant, while finding that innovation variances had shifted.
Sims and Zha [2006] reached a similar verdict by a different route.
Comparing Markov-switching models by their posterior fit, they found that the best fit lets only the variances of the disturbances switch.
When the systematic coefficients were also allowed to switch, the best fit changed only the monetary policy rule, and the estimated policy regimes differed too little to account for the rise and fall of inflation [Sargent, 2008].
Markov switching and the random-walk volatilities used below describe changing volatility differently.
A hidden Markov chain permits jumps, but without an absorbing state it switches forever among the same few configurations, and with one it permits a permanent shift only once.
A random-walk volatility must adjust continuously, but it permits recurrent, permanent shifts, such as a Great Inflation followed by a Great Moderation.
Primiceri [2005] fit a time-varying VAR close to the one below, with drifting coefficients and stochastic volatility and a prior that puts more weight on slow drift.
He found that systematic monetary policy had changed, but that the changes had small effects on the rest of the economy, which puts him nearer the bad-luck side [Sargent, 2008].
How can we discriminate?
A constant-coefficient, constant-volatility VAR can generate unusually large realized shocks, but it cannot represent systematic changes in their variance over time.
A model with drifting coefficients but constant volatility can also mistake changing volatility for coefficient drift, which is what Stock [2001] suspected of the 2001 paper.
So Cogley and Sargent build a model that has room for both channels at once, and they let a Bayesian posterior sort out how much of each the data call for.
107.3. A VAR with drifting coefficients and stochastic volatility#
Let the variables be ordered as nominal interest, transformed unemployment, and inflation,
Here \(u_t\) is not the raw unemployment rate but its logit, a transformation we define in the data section below.
The measurement equation is a VAR with two lags and date-specific coefficients,
Each equation has an intercept and six lag coefficients, so \(\theta_t\) contains \(3(1+2\times 3)=21\) elements.
A two-lag VAR can be rewritten as a one-lag system by stacking \(y_t\) and \(y_{t-1}\) into a single vector; the matrix that multiplies this stacked vector is the companion matrix, and the rewritten system is the VAR in companion form (Linear State Space Models, Vector Autoregressions for Subsets of Variables).
The following function builds the companion matrix from the stacked coefficients.
n_variables = 3
n_lags = 2
n_regressors = 1 + n_variables * n_lags
n_coefficients = n_variables * n_regressors


def companion_matrix(θ):
    """Return the intercept and companion matrix for one coefficient vector."""
    rows = np.asarray(θ, dtype=float).reshape(n_variables, n_regressors)
    intercept = np.r_[rows[:, 0], np.zeros(n_variables)]
    companion = np.zeros((n_variables * n_lags, n_variables * n_lags))
    companion[:n_variables] = rows[:, 1:]
    companion[n_variables:, :n_variables] = np.eye(n_variables)
    return intercept, companion
The coefficient vector follows a driftless random walk,
The drift covariance \(Q\) is a close relative of the drift covariance \(V\) in Priors, Escapes, and Learning Cycles.
There \(V\) is the government’s prior about how fast the Phillips curve drifts, and it sets the gain of the government’s Kalman filter; here \(Q\) is a parameter of the econometrician’s model, to be estimated.
For a given drift covariance the Kalman gain does not die out, so the filter behaves like the constant-gain least squares of Adaptive Learning and Escape Dynamics, a stochastic-approximation algorithm of the kind studied in One recursion, many learners.
Exercise 91.7 asks how well such a gain can be estimated from data, and Exercise 108.2 computes the gain that this model’s estimates imply.
When Sargent et al. [2006] estimated \(V\) by requiring a learning government’s policy to fit U.S. inflation, they needed a large \(V\), a government that “discounts past data heavily” [Sargent, 2008]; Carboni and Ellison [2009] shrank it by asking the government’s beliefs to match the Fed staff’s Greenbook forecasts.
The companion system is stable when every companion-matrix eigenvalue lies strictly inside the unit circle.
For an \(AR(1)\), this is \(|\rho|<1\); equivalently, the zero of \(1-\rho z\) lies outside the unit circle.
Cogley and Sargent rule out explosive paths with the truncated prior
where \(I(\theta^T)=1\) if the companion matrix is stable at every date and \(I(\theta^T)=0\) otherwise.
Their reason is economic.
A Fed that chooses its rule purposefully, with a loss function that penalizes the variance of inflation, would never choose a rule that leaves a unit root in inflation, because that would deliver an infinite loss.
The roots of the VAR are not determined by the Phillips curve alone; they also depend on the policy rule.
Under an arbitrary rule they can lie inside, on, or outside the unit circle, but under optimal or nearly optimal rules they are stable: when a shock moves inflation away from its target, a badly chosen rule may let it drift, while a well-chosen rule pulls it back.
The Phelps problem of Adaptive Expectations and the Phelps Problem is an example: the optimal rule steers inflation to a rest point even when the Phillips curve itself has the Solow–Tobin unit-sum form.
The restriction also tilts the marginal prior for \(Q\) toward values that are less likely to generate explosive coefficient paths.
The code below tests a whole trajectory for stability.
def companion_roots(θ_path):
    """Return the companion roots at every date of a (21, T) path."""
    rows = np.asarray(θ_path, dtype=float).reshape(n_variables, n_regressors, -1)
    companions = np.zeros((rows.shape[2], 6, 6))
    companions[:, :n_variables] = rows[:, 1:].transpose(2, 0, 1)
    companions[:, n_variables:, :n_variables] = np.eye(n_variables)
    return np.linalg.eigvals(companions)


def is_stable(θ_path):
    """Test whether every companion root lies strictly inside the unit circle."""
    return bool(np.max(np.abs(companion_roots(θ_path))) < 1)
The reduced-form innovation covariance changes over time according to
where
The diagonal elements \(h_{it}\) let the size of each orthogonalized shock wax and wane over time.
The matrix \(B\) orthogonalizes \(\varepsilon_t\), but it is not an identification scheme.
The next two functions construct \(B\) and \(R_t\).
def b_matrix(β):
    """Construct B from β_21, β_31, and β_32."""
    matrix = np.eye(n_variables)
    matrix[1, 0], matrix[2, 0], matrix[2, 1] = β
    return matrix


def innovation_covariance(h, β):
    """Construct R_t = B^{-1} H_t B^{-1}' from one vector of variances."""
    inverse = np.linalg.inv(b_matrix(β))
    return inverse @ np.diag(h) @ inverse.T
Each diagonal volatility is a geometric random walk,
The standardized measurement innovations, coefficient innovations, and volatility innovations are mutually independent.
Setting \(Q=0\) produces constant coefficients with drifting volatility, while holding \(H_t\) fixed produces drifting coefficients with constant volatility.
The posterior contains the full paths \(\theta^T\) and \(H^T\) together with \(Q\), \(\beta=(\beta_{21},\beta_{31},\beta_{32})\), and \(\sigma=(\sigma_1,\sigma_2,\sigma_3)\).
107.4. The data#
We use Cogley and Sargent [2005]’s quarterly U.S. dataset, which ends in 2000Q4.
Inflation is the log difference of the seasonally adjusted CPI for all urban consumers, point sampled in the third month of each quarter.
Unemployment is the quarterly average of the seasonally adjusted civilian unemployment rate and enters the VAR as \(0.01\log[u/(1-u)]\), a logit transformation that maps a bounded rate into an unconstrained variable.
The nominal interest rate starts from the three-month Treasury-bill rate \(i\), in annual percent and averaged over daily observations in the first month of each quarter, and enters as \(i/(400 - i)\), the quarterly return on a bill bought at a discount of \(i/400\) of its face value.
The data start in 1948Q2 because the first inflation observation is already differenced, so two VAR lags make 1948Q4 the first usable regression date.
Observations through 1958Q4 calibrate the prior, and 1959Q1–2000Q4 form the estimation sample.
def prepare_data(source):
    """Transform a quarterly table and construct the VAR(2) data."""
    table = pd.read_csv(source) if isinstance(source, str) else source
    ur = table['ur'].to_numpy(dtype=float)
    raw_y = np.column_stack([
        table['y3'].to_numpy(dtype=float),       # nominal interest
        0.01 * np.log(ur / (1 - ur)),            # logit unemployment
        table['dp'].to_numpy(dtype=float),       # inflation
    ])
    regressors = np.ones((len(raw_y) - n_lags, n_regressors))
    for lag in range(1, n_lags + 1):
        left = 1 + n_variables * (lag - 1)
        regressors[:, left:left + n_variables] = raw_y[n_lags - lag:-lag]
    targets = raw_y[n_lags:]
    dates = table['date'].to_numpy(dtype=float)[n_lags:]
    n_training = 4 * 11 - n_lags - 1          # 1948Q4--1958Q4
    return {
        'raw_dates': table['date'].to_numpy(dtype=float),
        'raw_y': raw_y,
        'prior_y': targets[:n_training],
        'prior_x': regressors[:n_training],
        'dates': dates[n_training:],
        'y': targets[n_training:],
        'x': regressors[n_training:],
    }


data = prepare_data(data_url)
Let’s view the data in familiar economic units.
dates_raw = data['raw_dates']
fig, axes = plt.subplots(3, 1, figsize=(9, 7), sharex=True)
axes[0].plot(dates_raw, 400 * data['raw_y'][:, 2], lw=2)
axes[0].set_ylabel('inflation (annual %)')
axes[1].plot(dates_raw, 100 * expit(100 * data['raw_y'][:, 1]), lw=2)
axes[1].set_ylabel('unemployment (%)')
interest = data['raw_y'][:, 0]
axes[2].plot(dates_raw, 400 * interest / (1 + interest), lw=2)
axes[2].set_ylabel('interest (annual %)')
axes[2].set_xlabel('year')
plt.tight_layout()
plt.show()
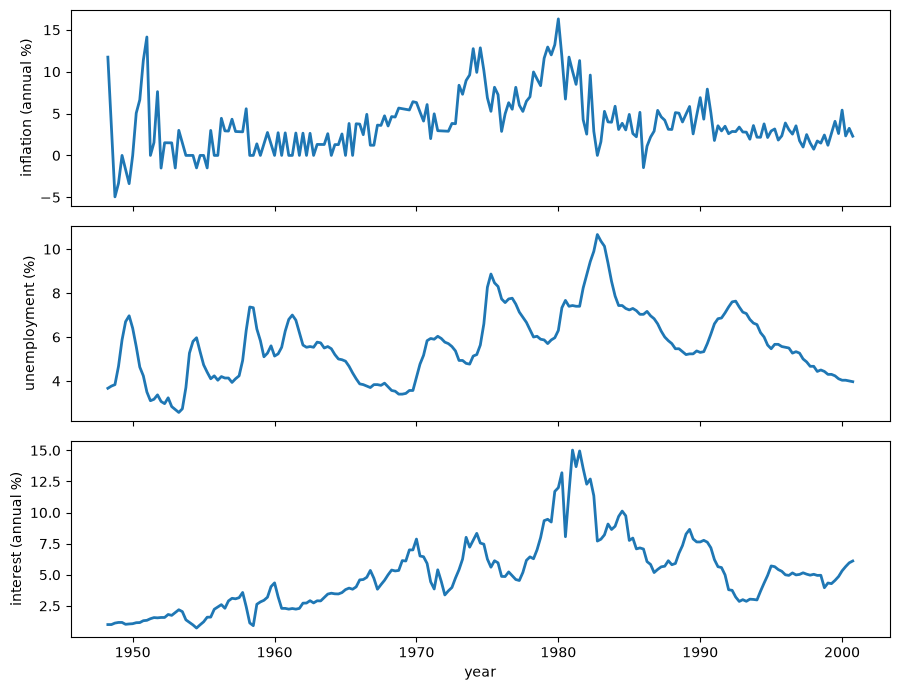
Fig. 107.1 Observed \(\pi_t\), \(u_t\), and \(i_t\), 1948Q2–2000Q4#
Inflation and nominal interest rates rise together through the 1970s and peak around 1980, unemployment peaks only after disinflation begins, and all three series are calmer in the 1990s.
These observations locate the episode but cannot tell whether changed systematic dynamics or unusually large shocks produced it, which is the distinction the model is built to examine.
107.5. Priors#
The priors are independent across parameters and deliberately weak so that, in Cogley and Sargent’s phrase, “the data are free to speak.”
They are calibrated from a time-invariant VAR fitted to the training sample.
The initial coefficient prior is a stable, truncated Gaussian,
where \(\bar\theta\) and \(\bar P\) are the point estimate and asymptotic covariance of a constant-coefficient seemingly unrelated regression fitted to 1948–1958.
Because all three equations have identical regressors, the SUR estimates equal equation-by-equation OLS estimates.
The coefficient-drift covariance has the inverse-Wishart prior
where the first argument is the degrees of freedom and the second the scale matrix.
Here \(\gamma^2\) is Cogley and Sargent’s prior scale, not a learning gain; in the Bounded Rationality lectures \(\gamma\) denotes the gain (Notation across the series).
Because \(T_0\) is only one greater than the dimension of \(\theta_t\), the prior is proper but has no finite mean.
The matrix \(\bar Q\) is therefore a conservative scale calibration that implies little drift, not the expectation of \(Q\), and the weakness of the prior lets the data move far away from it.
The remaining priors are
where \(\bar R\) is the residual covariance from the training-sample regression.
The next function gathers these hyperparameters.
def calibrate_prior(model_data, γ_squared=3.5e-4):
    """Calibrate every prior from a constant-coefficient training-sample VAR."""
    y, x = model_data['prior_y'], model_data['prior_x']
    xx_inverse = np.linalg.inv(x.T @ x)
    coefficients = xx_inverse @ x.T @ y          # SUR = equation-by-equation OLS
    residuals = y - x @ coefficients
    r_bar = np.cov(residuals, rowvar=False, ddof=1)
    p_bar = np.kron(r_bar, xx_inverse)
    T0 = n_coefficients + 1
    return {
        'θ_mean': coefficients.T.reshape(-1),
        'θ_covariance': p_bar,
        'q_center': γ_squared * p_bar,          # Q bar
        'q_scale': T0 * γ_squared * p_bar,      # T0 Q bar
        'q_degrees_freedom': T0,
        'log_h_mean': np.log(np.diag(r_bar)),
        'log_h_variance': 10.0,
        'β_variance': 10_000.0,
        'σ_degrees_freedom': 1.0,
        'σ_scale': 0.01**2,
        'γ_squared': γ_squared,
    }


prior = calibrate_prior(data)
trace_q_bar = np.trace(prior['q_center'])
assert is_stable(prior['θ_mean'])

pd.Series({
    'T0': prior['q_degrees_freedom'],
    'γ squared': prior['γ_squared'],
    'tr(Q bar)': trace_q_bar,
}, name='value').to_frame()
| value | |
|---|---|
| T0 | 22.000000 |
| γ squared | 0.000350 |
| tr(Q bar) | 0.003004 |
The training-sample estimate \(\bar\theta\) is itself stable, so the chain can start there.
107.6. Simulating the posterior#
We simulate the posterior by cycling through the five blocks that Cogley and Sargent [2005] use; one pass through all five is a sweep.
The coefficient path \(\theta_0,\ldots,\theta_T\), given \(Q\) and the covariances \(R^T\): a Kalman filter runs forward, and the Carter–Kohn backward pass then draws \(\theta_T\) and each \(\theta_t\) conditional on the draw of \(\theta_{t+1}\). This is the Kalman smoother run as a sampler.
The drift covariance \(Q\), given the path: an inverse-Wishart draw whose scale adds the \(T\) outer products \(v_tv_t^\top\) of the increments to \(T_0\bar Q\).
The volatility scales \(\sigma_i^2\), given the volatility paths: inverse-gamma draws.
The covariance parameters \(\beta\), given the VAR residuals and \(H^T\): two Gaussian regressions.
The volatility paths \(H^T\): the single-site Metropolis step of Jacquier et al. [1994], one date at a time.
Any fixed order of valid conditional updates leaves the posterior invariant.
The order needs care only in samplers that represent the volatility likelihood with mixture indicators, as in Kim et al. [1998]; Del Negro and Primiceri [2015] show that Primiceri [2005] drew those indicators in the wrong place in the cycle.
The Jacquier–Polson–Rossi step has no such indicators.
107.6.1. Imposing stability#
The restricted posterior assigns zero density to paths that are explosive at any date, including \(\theta_0\).
Cogley and Sargent simulate the unrestricted posterior and keep only the sweeps whose coefficient path is stable.
That is valid because the restricted posterior is the unrestricted posterior conditioned on stability, but if \(a\) is the share of unrestricted sweeps that are stable, it takes about \(1/a\) complete sweeps to produce one that is kept.
We impose stability inside block 1 instead, by redrawing the backward pass until it delivers a stable path.
An accepted draw comes from the Gaussian Carter–Kohn distribution conditioned on stability, which is exactly the restricted full conditional, so the step is an exact Gibbs update.
Because the forward filter does not change between redraws, each redraw costs only a backward pass.
In rare sweeps the conditioning values make a stable draw very unlikely; if 1,000 passes all fail, the step keeps the current path.
The probability of that event depends only on the other blocks, not on the current path, so the step is a mixture of an exact draw and staying put, and it still leaves the restricted conditional invariant.
The two schemes are linked by an identity.
Collect the other blocks in \(\Omega=(Q,H^T,\beta,\sigma)\) and let \(p(\Omega)\) be the probability that one unrestricted Carter–Kohn draw is stable.
The restricted posterior of \(\Omega\) is the unrestricted posterior \(\pi_U(\Omega)\) reweighted by \(p(\Omega)\), and the number of backward passes in a sweep is geometric with mean \(1/p(\Omega)\), so at stationarity the mean number of passes per sweep is
Our sampler therefore pays in cheap backward passes what the discard scheme pays in complete sweeps, and the average number of passes estimates \(1/a\), where \(a\) is Cogley and Sargent’s share of stable sweeps.
Because rare sweeps need very many passes, the average is noisy, and the cap at 1,000 passes biases it down, so the implied \(a\) is an upper bound.
Another exact option is the elliptical slice sampler of Murray et al. [2010], which moves along an ellipse through the current path and a fresh Carter–Kohn draw and shrinks toward the current stable path.
Its new path stays close to the current one, whereas a redraw is independent of it, but in our experiments the slow mixing of both samplers came mainly from the dependence between \(Q\) and the coefficient path, which neither step addresses.
Appendix: the sampler in detail writes out the recursions.
The code is long, so it is collapsed; expand the cells to read it.
The first cell implements block 1.
The second cell implements blocks 2–5.
The last cell composes the five blocks, after a warm-up that lets the volatilities settle with the coefficients held at \(\bar\theta\).
Passing fixed_q holds \(Q\) at that value instead of drawing it; a matrix of
zeros nests the constant-coefficient model.
Cogley and Sargent ran 100,000 sweeps, discarded the first half, and kept every tenth of the rest.
We run 40,000 sweeps, discard the first 4,000, and keep every 20th of the rest for the posterior summaries, while recording \(\operatorname{tr}(Q)\) and the number of backward passes at every sweep.
burn = 4_000
posterior = run_sampler(
    data['y'], data['x'], prior,
    n_sweeps=40_000, burn=burn, thin=20, seed=42,
)
passes = posterior['passes'][burn:]

pd.Series({
    'run time (minutes)': posterior['minutes'],
    'retained draws': len(posterior['β']),
    'mean backward passes per sweep': passes.mean(),
    'share of sweeps stable at the first pass': np.mean(passes == 1),
    'implied share a of stable unrestricted sweeps': 1 / passes.mean(),
    'sweeps that kept the current path': np.sum(passes > 1_000),
}, name='value').to_frame().round(3)
| value | |
|---|---|
| run time (minutes) | 14.913 |
| retained draws | 1800.000 |
| mean backward passes per sweep | 4.686 |
| share of sweeps stable at the first pass | 0.458 |
| implied share a of stable unrestricted sweeps | 0.213 |
| sweeps that kept the current path | 4.000 |
The implied share \(a\) is well below one half, so the discard scheme would throw away most of its sweeps, each of which costs a forward filter and four other blocks, while our sampler pays for each failure with a backward pass alone.
Successive sweeps remain strongly correlated, especially in the direction of \(Q\), so Monte Carlo error measures the Monte Carlo error in the numbers quoted below.
107.7. What the data say#
We summarize the posterior by its mean coefficient path \(\mathbb{E}(\theta_t\mid T)\) and mean covariance path \(\mathbb{E}(R_t\mid T)\), and then interpret them in the context of the question we asked.
107.7.1. The rate and structure of drift#
The trace of \(Q\) measures the total rate of coefficient drift, with \(\operatorname{tr}(Q)=0\) corresponding to constant coefficients.
The histogram shows \(\operatorname{tr}(Q)\) at every sweep after the burn-in, together with the prior scale \(\operatorname{tr}(\bar Q)\).
trace_q = posterior['trace_q'][burn:]
fig, ax = plt.subplots()
ax.hist(trace_q, bins=50, histtype='step', lw=2)
ax.axvline(trace_q_bar, color='C1', lw=2, label=r'prior $\mathrm{tr}(\bar Q)$')
ax.set_xlabel(r'$\mathrm{tr}(Q)$')
ax.set_ylabel('sweeps')
ax.legend()
plt.show()
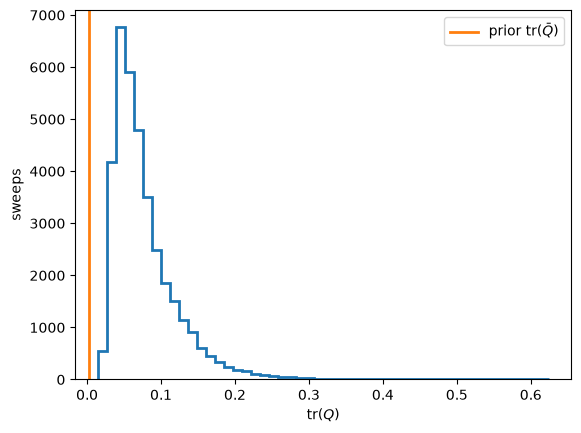
Fig. 107.2 Posterior \(\operatorname{tr}(Q)\) and prior \(\operatorname{tr}(\bar Q)\)#
The next table compares summaries of \(Q\) with the numbers that Cogley and Sargent report (their Table 1 and p. 272).
q_mean = posterior['Q'].mean(axis=0)
q_eigenvalues = np.linalg.eigvalsh(q_mean)[::-1]
retained_trace_q = np.trace(posterior['Q'], axis1=1, axis2=2)

pd.DataFrame({
    'this lecture': [
        trace_q.mean(),
        q_eigenvalues[0],
        retained_trace_q.min() / trace_q_bar,
    ],
    'Cogley and Sargent': [0.047, 0.023, 3.0],
}, index=[
    'posterior mean of tr(Q)',
    'largest eigenvalue of posterior-mean Q',
    'smallest retained tr(Q) / tr(Q bar)',
]).round(3)
| this lecture | Cogley and Sargent | |
|---|---|---|
| posterior mean of tr(Q) | 0.077 | 0.047 |
| largest eigenvalue of posterior-mean Q | 0.034 | 0.023 |
| smallest retained tr(Q) / tr(Q bar) | 6.145 | 3.000 |
The whole posterior lies far to the right of the conservative prior scale, so within this model the data call for much more coefficient drift than the prior anticipated.
The posterior mean of \(\operatorname{tr}(Q)\) and the largest eigenvalue are larger than Cogley and Sargent’s.
The posterior of \(\operatorname{tr}(Q)\) has a long right tail that the chain explores slowly, so its mean carries noticeable Monte Carlo error (Monte Carlo error), but it was above Cogley and Sargent’s value in every run we made with other seeds as well.
This is not a formal test of \(Q=0\), because the continuous prior assigns no mass to \(Q=0\); Cogley and Sargent avoid Bayes factors because their prior on \(Q\) is so diffuse.
Variation attributed to \(\theta_t\) is variation in the systematic part of the reduced form; the VAR does not by itself say whether policy or private behavior caused it.
Cogley and Sargent estimated every ordering of the three variables, and their posterior means show that the ordering changes magnitudes but does not remove drift:
Ordering |
Stable \(\operatorname{tr}(Q)\) |
Stable \(\max(\lambda)\) |
Unrestricted \(\operatorname{tr}(Q)\) |
Unrestricted \(\max(\lambda)\) |
|---|---|---|---|---|
\((i,\pi,u)\) |
0.055 |
0.025 |
0.056 |
0.027 |
\((i,u,\pi)\) |
0.047 |
0.023 |
0.059 |
0.031 |
\((\pi,i,u)\) |
0.064 |
0.031 |
0.082 |
0.044 |
\((\pi,u,i)\) |
0.062 |
0.031 |
0.088 |
0.051 |
\((u,i,\pi)\) |
0.057 |
0.026 |
0.051 |
0.028 |
\((u,\pi,i)\) |
0.055 |
0.024 |
0.072 |
0.035 |
Here \(\max(\lambda)\) is the largest eigenvalue of the posterior mean of \(Q\).
The ordering matters because the first two variables share sources of stochastic volatility with the others, while the third has its own; following the paper, we use \((i,u,\pi)\), the ordering with the least drift.
For that ordering, removing the stability restriction raises the posterior mean drift rate, so the restriction does not manufacture the drift.
Diagonalizing the posterior mean of \(Q\) shows that the drift is low dimensional.
q_shares = np.cumsum(q_eigenvalues) / q_eigenvalues.sum()
pd.DataFrame({
    'eigenvalue': q_eigenvalues[:3],
    'cumulative share': q_shares[:3],
    'Cogley and Sargent': [0.485, 0.832, 0.945],
}, index=pd.Index([1, 2, 3], name='principal component')).round(3)
| eigenvalue | cumulative share | Cogley and Sargent | |
|---|---|---|---|
| principal component | |||
| 1 | 0.034 | 0.448 | 0.485 |
| 2 | 0.029 | 0.824 | 0.832 |
| 3 | 0.009 | 0.936 | 0.945 |
As Cogley and Sargent found, only a few linear combinations of the 21 coefficients drift: the first principal component accounts for more than two-fifths of total drift and the first three for the large majority.
The posterior mean coefficient paths show where the drift lives.
θ_mean = posterior['θ'].mean(axis=0)
dates = data['dates']
coefficient_labels = ('constant', r'$i_{t-1}$', r'$u_{t-1}$', r'$\pi_{t-1}$',
                      r'$i_{t-2}$', r'$u_{t-2}$', r'$\pi_{t-2}$')
equation_labels = ('interest', 'unemployment', 'inflation')

fig, axes = plt.subplots(1, 3, figsize=(10, 4), sharex=True)
for equation, ax in enumerate(axes):
    rows = slice(7 * equation, 7 * equation + 7)
    lines = ax.plot(dates, θ_mean[rows].T, lw=2)
    ax.axhline(0, color='0.65', lw=1)
    ax.set_xlabel('year')
    ax.set_title(f'{equation_labels[equation]} equation')
fig.legend(lines, coefficient_labels, loc='lower center', ncol=4)
plt.tight_layout(rect=(0, 0.17, 1, 1))
plt.show()
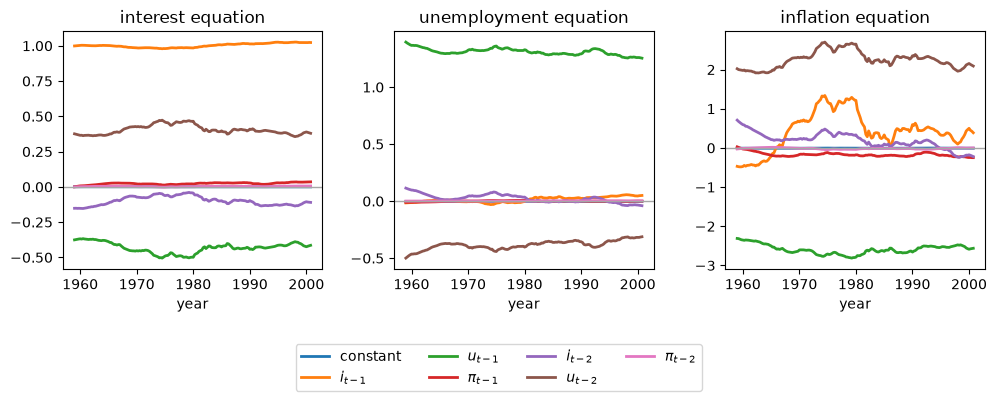
Fig. 107.3 Posterior mean VAR coefficients \(E(\theta_t\mid T)\)#
The interest and unemployment equations are comparatively stable, whereas coefficients of the inflation equation, especially the one on lagged interest, move strongly through the 1970s and turn around near 1980.
Individual lag coefficients should not be given structural interpretations, because paired lags can offset one another; the dynamic summaries below are more informative.
107.7.2. The evolution of volatility#
We first ask how the size of the shocks changed.
The posterior mean \(\mathbb{E}(R_t\mid T)\) averages \(B^{-1}H_tB^{-1\prime}\) over the retained draws.
def mean_innovation_covariance(h_draws, β_draws):
    """E(R_t | T): the average of B^{-1} H_t B^{-1}' over retained draws."""
    b_inverse = np.linalg.inv(np.stack([b_matrix(β) for β in β_draws]))
    total = np.einsum('dij,dtj,dkj->tik', b_inverse, h_draws, b_inverse,
                      optimize=True)
    return total / len(β_draws)


r_mean = mean_innovation_covariance(posterior['h'], posterior['β'])
The next plot shows the innovation standard deviations, in basis points at quarterly rates, and the innovation correlations.
variances = ((0, 'Nominal interest'), (2, 'Inflation'), (1, 'Unemployment'))
correlations = ((0, 1, 'Interest--unemployment'),
                (0, 2, 'Interest--inflation'),
                (2, 1, 'Inflation--unemployment'))
fig, axes = plt.subplots(3, 2, figsize=(9, 8), sharex=True)
for row, (index, label) in enumerate(variances):
    axes[row, 0].plot(dates, 1e4 * np.sqrt(r_mean[:, index, index]), lw=2)
    axes[row, 0].set_title(label)
for row, (left, right, label) in enumerate(correlations):
    scale = np.sqrt(r_mean[:, left, left] * r_mean[:, right, right])
    axes[row, 1].plot(dates, r_mean[:, left, right] / scale, lw=2)
    axes[row, 1].set_title(label)
axes[1, 0].set_ylabel(r'standard deviation $\times 10^4$')
axes[1, 1].set_ylabel('correlation')
axes[-1, 0].set_xlabel('year')
axes[-1, 1].set_xlabel('year')
plt.tight_layout()
plt.show()
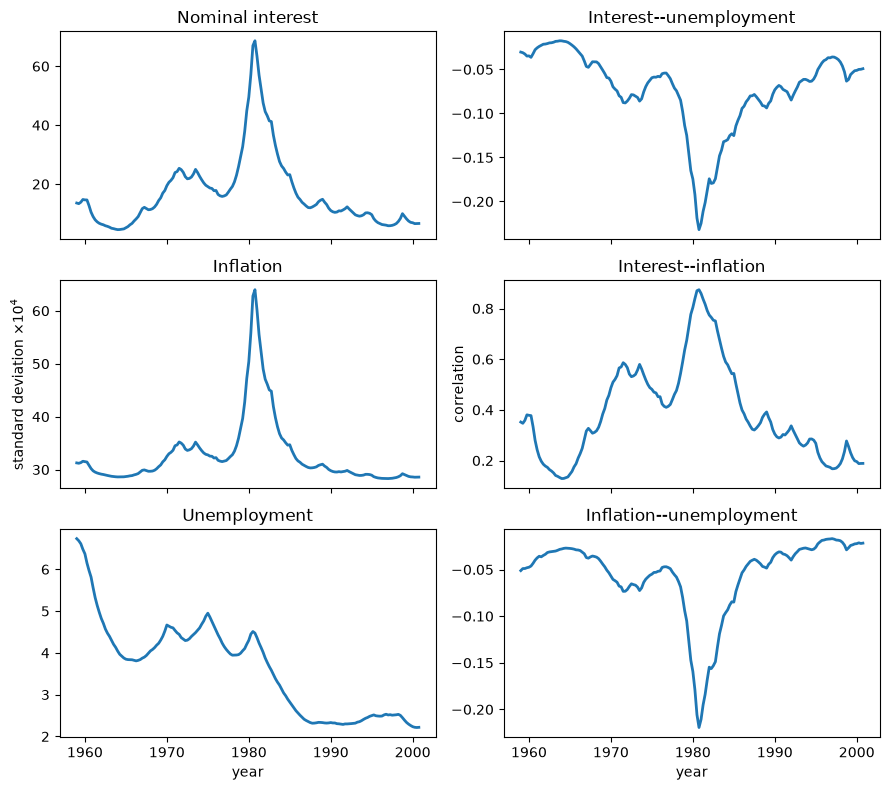
Fig. 107.4 Standard deviations and correlations implied by \(E(R_t\mid T)\)#
The interest-rate and inflation innovation standard deviations spike around 1980 and fall back within a few years, while unemployment innovation volatility trends down over the whole sample, punctuated by countercyclical bumps.
All three innovation correlations are largest in magnitude around the Volcker disinflation, so both the size and the composition of reduced-form shocks changed.
These movements give the changing-shocks, or bad-luck, explanation an important role, although the interest-rate innovation is not itself a structural monetary-policy shock.
Indeed, its positive correlation with inflation innovations and negative correlation with unemployment innovations look more like a policy reaction than like policy shocks, which conventional wisdom says should move inflation and unemployment the other way.
Following Whittle [1953], the log determinant of \(\mathbb{E}(R_t\mid T)\) summarizes the total one-step uncertainty entering the system at each date.
years = np.floor(dates + 1e-8).astype(int)
logdet_r = np.linalg.slogdet(r_mean)[1]

fig, ax = plt.subplots()
ax.plot(dates, logdet_r, lw=2)
ax.set_xlabel('year')
ax.set_ylabel(r'$\log |E(R_t\mid T)|$')
plt.show()
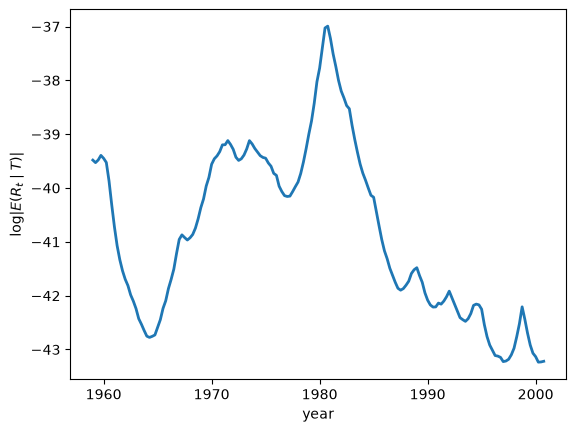
Fig. 107.5 Generalized innovation variance \(\log |E(R_t\mid T)|\)#
The table below gives the numbers behind the figure.
def period_mean(values, first, last):
    """Average a quarterly series over the years first, ..., last."""
    return values[(years >= first) & (years <= last)].mean()


pd.Series({
    'mean, 1960--1964': period_mean(logdet_r, 1960, 1964),
    'peak': logdet_r.max(),
    'date of peak': dates[np.argmax(logdet_r)],
    'mean, 1990--2000': period_mean(logdet_r, 1990, 2000),
}, name='log |E(R_t | T)|').to_frame().round(2)
| log |E(R_t | T)| | |
|---|---|
| mean, 1960--1964 | -41.61 |
| peak | -36.99 |
| date of peak | 1980.75 |
| mean, 1990--2000 | -42.59 |
Total innovation variance rises in two steps, from the mid-1960s to the early 1970s and again in the late 1970s, to a peak at the end of 1980, and most of the subsequent decline comes in the first half of the 1980s.
Its 1990s average is at or below its early-1960s average, so the Great Moderation documented by Kim and Nelson [1999] and McConnell and Perez-Quiros [2000] looks like a return to the stability of the early 1960s.
Cogley and Sargent read this as a return to stability, and they note how short-lived the earlier calm proved to be.
This is the clearest aggregate evidence for changing luck, but it cannot explain the coefficient-based changes in inflation dynamics examined next.
107.7.3. Core inflation and the natural rate#
To study the systematic dynamics, write the VAR at date \(t\) in companion form as
where \(z_t=(y_t^\top, y_{t-1}^\top)^\top\) and \(\mu_{t\mid T}\) and \(A_{t\mid T}\) are built from \(\mathbb{E}(\theta_t\mid T)\).
At date \(t\), the local mean \(m_t\) is the point to which the companion system would converge if its coefficients stayed at their date-\(t\) values and future innovations were zero:
Here \(s_\pi\) and \(s_u\) select inflation and unemployment from \(m_t\), the factor four annualizes inflation, and the inverse logit returns unemployment to a rate.
Core inflation \(\bar\pi_t\) is the long-horizon inflation forecast implied by freezing the date-\(t\) coefficients, and the natural rate \(\bar u_t\) is the corresponding long-run unemployment anchor.
They are steady states of frozen local systems, not unconditional means of the drifting process.
Freezing the current coefficients and projecting forward is the anticipated-utility device [Kreps, 1998] of the learning governments of Adaptive Learning and Escape Dynamics, Escaping Nash Inflation, and The Lost Conquest: Fed Policy in the 2020s, which act as if their current beliefs will never be revised.
def local_means(θ_path):
    """Core inflation (annual rate) and the natural unemployment rate."""
    θ_path = np.asarray(θ_path, dtype=float).reshape(n_coefficients, -1)
    core = np.empty(θ_path.shape[1])
    natural = np.empty(θ_path.shape[1])
    for t, θ in enumerate(θ_path.T):
        intercept, companion = companion_matrix(θ)
        m = np.linalg.solve(np.eye(6) - companion, intercept)
        core[t], natural[t] = 4 * m[2], expit(100 * m[1])
    return core, natural


core_inflation, natural_rate = local_means(θ_mean)
We plot the fourth-quarter value in each year.
annual = np.array([np.flatnonzero(years == year)[-1]
                   for year in np.unique(years)])

fig, ax = plt.subplots()
ax.plot(dates[annual], 100 * core_inflation[annual], 'o-', lw=2,
        markersize=3, label='core inflation')
ax.plot(dates[annual], 100 * natural_rate[annual], '+-', lw=2,
        markersize=5, label='natural rate')
ax.set_xlabel('year')
ax.set_ylabel('percent')
ax.legend()
plt.show()
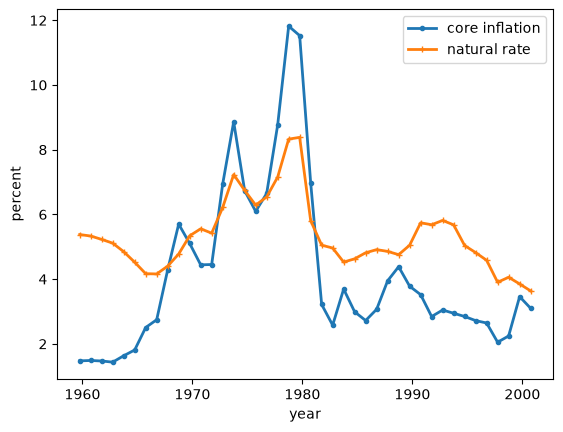
Fig. 107.6 Core inflation \(\bar\pi_t\) and the natural rate \(\bar u_t\)#
The table below gives the numbers behind the figure.
pd.Series({
    'core inflation, 1960--1964 mean': 100 * period_mean(core_inflation, 1960, 1964),
    'core inflation, peak': 100 * core_inflation[annual].max(),
    'year of the core peak': years[annual][np.argmax(core_inflation[annual])],
    'core inflation, 1985--2000 mean': 100 * period_mean(core_inflation, 1985, 2000),
    'natural rate, 1960': 100 * natural_rate[annual][0],
    'natural rate, peak': 100 * natural_rate[annual].max(),
    'year of the natural-rate peak': years[annual][np.argmax(natural_rate[annual])],
    'natural rate, 2000': 100 * natural_rate[-1],
    'correlation of core and natural rate': np.corrcoef(core_inflation, natural_rate)[0, 1],
}, name='estimate').to_frame().round(2)
| estimate | |
|---|---|
| core inflation, 1960--1964 mean | 1.53 |
| core inflation, peak | 11.82 |
| year of the core peak | 1978.00 |
| core inflation, 1985--2000 mean | 3.09 |
| natural rate, 1960 | 5.38 |
| natural rate, peak | 8.38 |
| year of the natural-rate peak | 1979.00 |
| natural rate, 2000 | 3.64 |
| correlation of core and natural rate | 0.84 |
Core inflation climbs from about 1.5 percent in the early 1960s to a peak in the late 1970s and then falls to about 3 percent, the pattern Cogley and Sargent report (about 1.5, 8, and 2.5 to 3.5 percent), although our peak is higher.
The natural rate rises from about 5 percent to a peak in the late 1970s and falls below 4 percent by 2000.
Because both lines are determined by the fitted coefficients rather than by realized shocks, their persistent shifts point to a changing systematic component.
The two anchors are highly correlated, more so than the 0.748 that Cogley and Sargent report: the model’s long-run inflation and unemployment rates rose and fell together, which is not the same as current inflation and unemployment moving together.
Because \((I-A_t)^{-1}\) amplifies small coefficient changes when the largest root is close to one, long-run means are intrinsically more sensitive than short-horizon forecasts.
107.7.4. Inflation persistence#
We now ask whether the systematic dynamics drifted on top of the moving volatilities.
The main summary is inflation persistence, measured by the normalized spectrum of inflation at frequency zero.
The spectral density of inflation at date \(t\) is
where \(\mathcal R_t\) embeds \(\mathbb{E}(R_t\mid T)\) in the companion system.
Low-frequency power depends on both the autoregressive coefficients and the innovation covariance, so Cogley and Sargent normalize by the variance of inflation at date \(t\),
which measures autocorrelation rather than autocovariance.
They interpret \(g_{\pi\pi}(0,t)\) as a measure of inflation persistence.
Statistics at frequency zero are long-run statistics: Two Illustrations of the Quantity Theory of Money computes long-run slopes as ratios of spectral densities at frequency zero, and Exercise 108.3 computes such a slope of inflation on unemployment from this model.
The normalization removes a common scale factor from \(R_t\), but it can still depend on the relative variances and covariances in \(R_t\).
The next function evaluates both spectra at frequencies measured in cycles per quarter.
def inflation_spectrum(θ, covariance, frequencies):
    """Inflation power f(ω) and normalized power g(ω) at one date."""
    _, companion = companion_matrix(θ)
    innovation = np.zeros((6, 6))
    innovation[:3, :3] = covariance
    variance = linalg.solve_discrete_lyapunov(companion, innovation)[2, 2]
    power = np.empty(len(frequencies))
    for j, frequency in enumerate(frequencies):
        transfer = np.linalg.inv(
            np.eye(6) - companion * np.exp(-2j * np.pi * frequency))
        power[j] = np.real(transfer @ innovation @ transfer.conj().T)[2, 2]
    return power / (2 * np.pi), power / (2 * np.pi * variance)


def persistence_path(θ_path, r_path):
    """g_ππ(0, t) at every date."""
    return np.array([inflation_spectrum(θ, r, [0.0])[1][0]
                     for θ, r in zip(θ_path.T, r_path)])


inflation_persistence = persistence_path(θ_mean, r_mean)
white_noise = 1 / (2 * np.pi)
For white noise the spectrum is flat, so \(g_{\pi\pi}(0)=1/(2\pi)\approx 0.16\); that is the benchmark against which to read the path.
fig, ax = plt.subplots()
ax.plot(dates[annual], inflation_persistence[annual], 'o-', lw=2, markersize=3)
ax.axhline(white_noise, color='0.45', ls='--', lw=1,
           label=r'white noise, $1/(2\pi)$')
ax.set_xlabel('year')
ax.set_ylabel(r'$g_{\pi\pi}(0,t)$')
ax.legend()
plt.show()
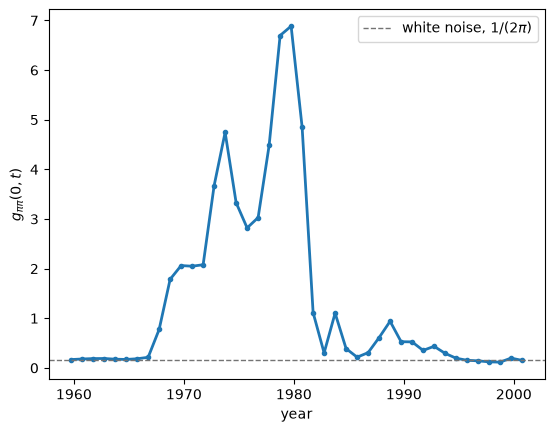
Fig. 107.7 Normalized zero-frequency spectrum \(g_{\pi\pi}(0,t)\)#
The table below gives the numbers behind the figure.
pd.Series({
    '1960--1964 mean': period_mean(inflation_persistence, 1960, 1964),
    '1970--1979 mean': period_mean(inflation_persistence, 1970, 1979),
    'peak': inflation_persistence[annual].max(),
    'year of the peak': years[annual][np.argmax(inflation_persistence[annual])],
    '1985--2000 mean': period_mean(inflation_persistence, 1985, 2000),
}, name='g(0, t)').to_frame().round(3)
| g(0, t) | |
|---|---|
| 1960--1964 mean | 0.180 |
| 1970--1979 mean | 3.839 |
| peak | 6.886 |
| year of the peak | 1979.000 |
| 1985--2000 mean | 0.350 |
Persistence is close to the white-noise value in the early 1960s, sweeps upward in the late 1960s, stays high through the 1970s with a peak in 1979, and falls sharply after 1980, back toward the white-noise value for much of the 1980s and 1990s.
The post-1980 fall cannot be explained by a proportional rescaling of all innovations, although the normalized statistic can still depend on the composition of \(R_t\).
For comparison, an \(AR(1)\) with coefficient \(\rho\) has \(g(0)=(1+\rho)/[2\pi(1-\rho)]\), so values between 2 and 10 correspond to \(\rho\) between about \(0.85\) and \(0.97\); Exercise 107.1 converts the whole path into such an “equivalent \(AR(1)\)” coefficient.
The zero-frequency path omits the rest of the frequency distribution, which the next heatmap shows.
spectrum_frequencies = np.linspace(0, 0.5, 41)
normalized_spectrum = np.column_stack([
    inflation_spectrum(θ_mean[:, t], r_mean[t], spectrum_frequencies)[1]
    for t in range(len(dates))
])

fig, ax = plt.subplots(figsize=(8, 4))
image = ax.pcolormesh(dates, spectrum_frequencies,
                      np.log10(normalized_spectrum), shading='auto')
ax.set_xlabel('year')
ax.set_ylabel('cycles per quarter')
fig.colorbar(image, ax=ax, label=r'$\log_{10} g_{\pi\pi}(\omega,t)$')
plt.show()
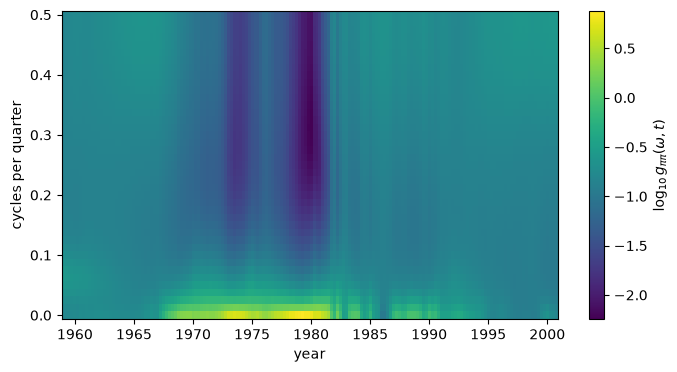
Fig. 107.8 Normalized inflation spectrum \(g_{\pi\pi}(\omega,t)\)#
A ridge of low-frequency power runs from the late 1960s to the early 1980s and then recedes.
Because the ridge survives normalization, the Great Inflation was not only a period of large shocks: inflation shocks were also propagated more persistently.
Point estimates do not reveal how strongly the data locate these paths, so we compute the annual features from every retained draw.
def posterior_feature_draws(draws, indices):
    """Core inflation, the natural rate, and g(0) at selected dates, by draw."""
    n_draws = len(draws['β'])
    core = np.empty((len(indices), n_draws))
    natural = np.empty_like(core)
    persistence = np.empty_like(core)
    for d in range(n_draws):
        θ_d = draws['θ'][d][:, indices]
        core[:, d], natural[:, d] = local_means(θ_d)
        for row, t in enumerate(indices):
            covariance = innovation_covariance(draws['h'][d][t], draws['β'][d])
            persistence[row, d] = inflation_spectrum(
                θ_d[:, row], covariance, [0.0])[1][0]
    return {'core': 100 * core, 'natural': 100 * natural,
            'persistence': persistence}


feature_draws = posterior_feature_draws(posterior, annual)
The figure plots, for each feature, the posterior median and a 90 percent band across draws.
feature_specs = (('core', 'core inflation (%)'),
                 ('natural', 'natural rate (%)'),
                 ('persistence', r'$g_{\pi\pi}(0,t)$'))
fig, axes = plt.subplots(3, 1, figsize=(9, 8), sharex=True)
for ax, (key, ylabel) in zip(axes, feature_specs):
    lower, median, upper = np.quantile(feature_draws[key], (0.05, 0.5, 0.95),
                                       axis=1)
    line, = ax.plot(dates[annual], median, lw=2)
    ax.fill_between(dates[annual], lower, upper, color=line.get_color(),
                    alpha=0.2)
    ax.set_ylabel(ylabel)
axes[-1].set_xlabel('year')
plt.tight_layout()
plt.show()
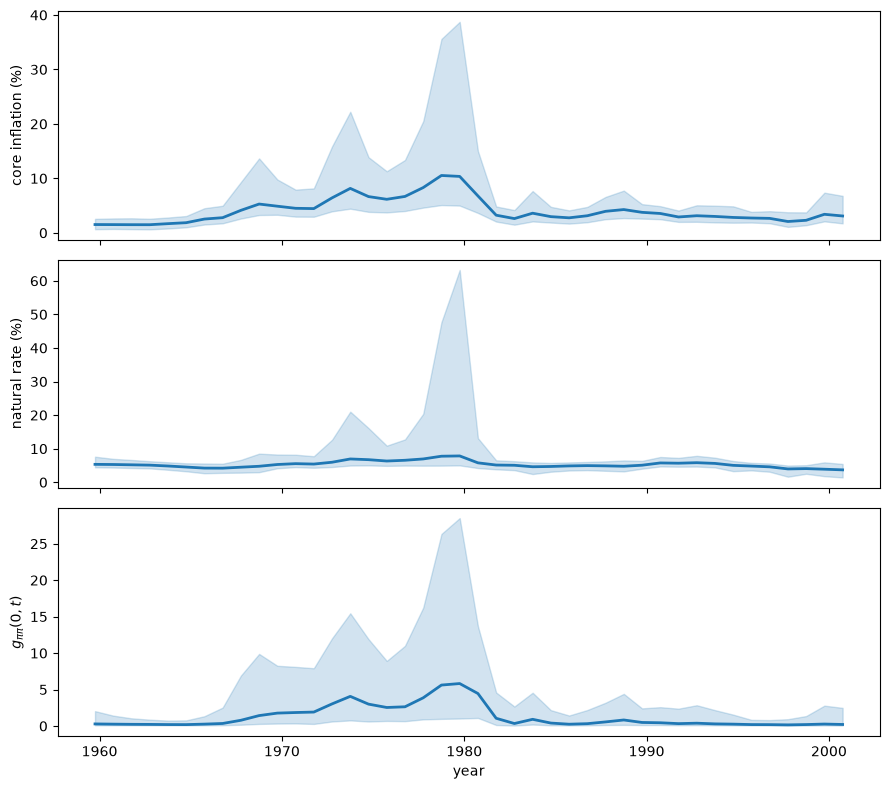
Fig. 107.9 Posterior medians and pointwise 90 percent intervals for \(\bar\pi_t\), \(\bar u_t\), and \(g_{\pi\pi}(0,t)\)#
The bands are pointwise, not bands for whole paths.
The bands are wide and skewed to the right in the 1970s, so the rise and the post-1980 fall are clearer than their magnitudes.
As Cogley and Sargent note, uncertainty about core inflation grows with persistence, because core inflation is a long-horizon forecast.
The next plot compares the timing of core inflation and persistence, as in Cogley and Sargent’s Figure 11.
fig, ax = plt.subplots()
ax.plot(dates[annual], 100 * core_inflation[annual], 'o-', lw=2,
        markersize=3, label='core inflation (%)')
ax.plot(dates[annual], inflation_persistence[annual], 'x-', lw=2,
        markersize=4, label=r'$g_{\pi\pi}(0,t)$')
ax.set_xlabel('year')
ax.legend()
plt.show()

core_persistence_correlation = np.corrcoef(
    core_inflation, inflation_persistence)[0, 1]
print(f'correlation of core inflation and persistence: '
      f'{core_persistence_correlation:.3f}')
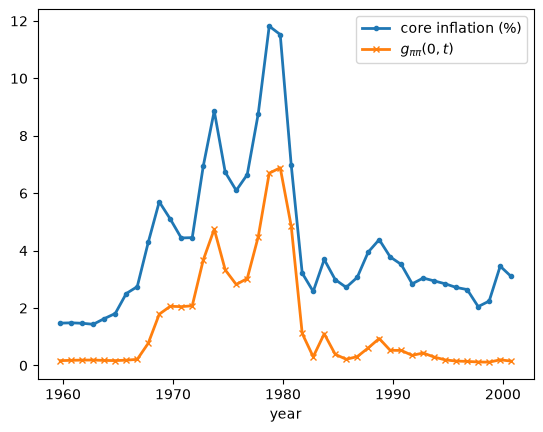
Fig. 107.10 Core inflation \(\bar\pi_t\) and persistence \(g_{\pi\pi}(0,t)\)#
correlation of core inflation and persistence: 0.965
Core inflation and persistence rise together through the late 1960s and 1970s and fall together during the Volcker disinflation.
The printed quarterly correlation is high and close to the 0.92 that Cogley and Sargent report.
It summarizes common timing rather than a causal relation: both measures are nonlinear functions of the same fitted coefficients.
Bad policy or bad luck? A verdict explains why this positive correlation troubled the escape-route models of Escaping Nash Inflation.
107.7.5. Monetary policy activism#
Cogley and Sargent summarize systematic policy with the forward-looking Taylor rule of Clarida et al. [2000], with interest-rate smoothing,
where \(\bar\pi_{t,t+h_\pi}\) and \(\bar u_{t,t+h_u}\) are average inflation and unemployment over the next \(h_\pi\) and \(h_u\) quarters.
They define the activism coefficient \(\mathcal A_t=\psi_1/(1-\psi_3)\) and call policy active when \(\mathcal A_t\geq 1\), so that the nominal rate rises more than one-for-one with expected inflation in the long run.
The long-run response \(\psi_1(1+\psi_3+\psi_3^2+\cdots)\) exists only when \(|\psi_3|<1\).
At each date, population two-stage least squares projections implied by the local VAR deliver the coefficients.
The first stage projects the Fed’s forecasts on lagged information, namely the VAR’s forecasts made at \(t-1\), because the Fed does not see current-quarter inflation and unemployment when it sets the rate.
The second stage projects \(i_t\) on those fitted forecasts and \(i_{t-1}\).
The benchmark horizons are \(h_\pi=4\) quarters and \(h_u=2\) quarters, reflecting Federal Reserve folk wisdom about policy lags.
def policy_rule_coefficients(θ, covariance, h_pi=4, h_u=2):
    """Population 2SLS coefficients (ψ_1, ψ_2, ψ_3) implied by a local VAR."""
    _, companion = companion_matrix(θ)
    innovation = np.zeros((6, 6))
    innovation[:3, :3] = covariance
    stationary = linalg.solve_discrete_lyapunov(companion, innovation)
    power, π_load, u_load = np.eye(6), np.zeros(6), np.zeros(6)
    for horizon in range(1, max(h_pi, h_u) + 1):
        power = power @ companion
        if horizon <= h_pi:
            π_load += power[2] / h_pi
        if horizon <= h_u:
            u_load += power[1] / h_u
    loadings = np.vstack((π_load, u_load, np.eye(6)[0]))
    return np.linalg.solve(loadings @ stationary @ loadings.T,
                           loadings @ stationary @ companion.T[:, 0])


rules = np.array([policy_rule_coefficients(θ_mean[:, t], r_mean[t])
                  for t in range(len(dates))])
ψ1, ψ3 = rules[:, 0], rules[:, 2]
activism = np.where(np.abs(ψ3) < 1, ψ1 / (1 - ψ3), np.nan)
print(f'share of dates with |ψ_3| < 1: {np.mean(np.abs(ψ3) < 1):.3f}')
share of dates with |ψ_3| < 1: 1.000
The figure plots \(\mathcal A_t\) at the posterior mean, as in Cogley and Sargent’s Figure 12, leaving blank any date with \(|\psi_3|\geq 1\).
fig, ax = plt.subplots()
ax.plot(dates, activism, lw=2)
ax.axhline(1, color='0.45', lw=1)
ax.set_xlabel('year')
ax.set_ylabel(r'$\mathcal{A}_t$')
plt.show()
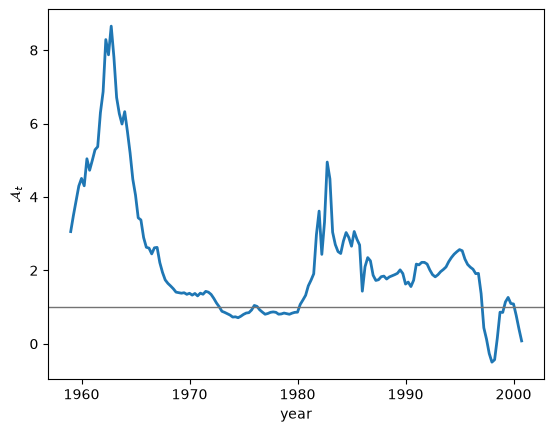
Fig. 107.11 Activism coefficient \(\mathcal A_t=\psi_{1t}/(1-\psi_{3t})\) at the posterior mean#
Judged by point estimates, policy was active in the early 1960s, was mostly passive from the early 1970s until 1980, and turned active at the start of the Volcker disinflation, staying active through the mid-1990s.
Estimates at the very end of the sample are erratic, for a reason explained next.
The rule’s coefficients are weakly identified when inflation is close to white noise, because lagged variables are then poor instruments for future inflation, so a path built from posterior-mean inputs understates the uncertainty.
We therefore compute \(\mathcal A_t\) from every retained draw in 1975, 1985, and 1995 and compare the posterior probabilities with Cogley and Sargent’s.
selected_years = (1975, 1985, 1995)
selected_dates = [np.flatnonzero(years == year)[-1] for year in selected_years]
n_draws = len(posterior['β'])
activism_draws = {year: np.empty(n_draws) for year in selected_years}
inside = {year: np.empty(n_draws, dtype=bool) for year in selected_years}
for d in range(n_draws):
    for year, t in zip(selected_years, selected_dates):
        covariance = innovation_covariance(posterior['h'][d][t],
                                           posterior['β'][d])
        ψ = policy_rule_coefficients(posterior['θ'][d][:, t], covariance)
        activism_draws[year][d] = ψ[0] / (1 - ψ[2])
        inside[year][d] = abs(ψ[2]) < 1

activism_events = (
    activism_draws[1975] > 1,
    activism_draws[1985] > 1,
    activism_draws[1995] > 1,
    activism_draws[1985] > activism_draws[1975],
    activism_draws[1995] > activism_draws[1975],
)
pd.DataFrame({
    'this lecture': [event.mean() for event in activism_events],
    'Cogley and Sargent': [0.208, 0.919, 0.941, 0.923, 0.943],
}, index=['P(A_1975 > 1)', 'P(A_1985 > 1)', 'P(A_1995 > 1)',
          'P(A_1985 > A_1975)', 'P(A_1995 > A_1975)']).round(3)
| this lecture | Cogley and Sargent | |
|---|---|---|
| P(A_1975 > 1) | 0.285 | 0.208 |
| P(A_1985 > 1) | 0.736 | 0.919 |
| P(A_1995 > 1) | 0.693 | 0.941 |
| P(A_1985 > A_1975) | 0.744 | 0.923 |
| P(A_1995 > A_1975) | 0.699 | 0.943 |
Like Cogley and Sargent, these probabilities use every draw; the share of draws with \(|\psi_3|<1\), for which \(\mathcal A_t\) has its long-run interpretation, is
pd.Series({year: inside[year].mean() for year in selected_years},
          name='share of draws with |ψ_3| < 1').to_frame().round(3)
| share of draws with |ψ_3| < 1 | |
|---|---|
| 1975 | 1.000 |
| 1985 | 0.961 |
| 1995 | 0.973 |
The posterior favors passive policy in 1975 and active policy in 1985 and 1995, and it says that activism probably rose.
But our probabilities of active policy in 1985 and 1995, and of a rise since 1975, are noticeably lower than Cogley and Sargent’s, in every run we made.
That is consistent with the larger drift covariance in our posterior, which locates the coefficients at any date less precisely.
107.7.6. The disinflation and the calm#
Escaping Nash Inflation ends by asking whether the calm of the mid-1980s and the disinflation arrived together, because a model in which calm makes escapes easier would predict that they should.
The fitted model separates the two: core inflation measures the disinflation, and the generalized innovation variance measures the calm.
The table dates the peak of each and the quarter in which each had covered half the distance from its peak to its post-1985 average.
def peak_and_halfway(series, first_after=1985):
    """Date of the peak, and of the first later date halfway to the later mean."""
    peak = np.argmax(series)
    later_mean = series[years >= first_after].mean()
    halfway = 0.5 * (series[peak] + later_mean)
    after = peak + np.flatnonzero(series[peak:] <= halfway)[0]
    return dates[peak], dates[after]


pd.DataFrame(
    [peak_and_halfway(core_inflation), peak_and_halfway(logdet_r)],
    index=['core inflation', 'log |E(R_t | T)|'],
    columns=['peak', 'halfway down'],
).round(2)
| peak | halfway down | |
|---|---|---|
| core inflation | 1979.25 | 1980.25 |
| log |E(R_t | T)| | 1980.75 | 1984.00 |
Core inflation fell first: it was halfway down a year after its peak, while total innovation variance peaked later and covered half of its decline only around 1984.
The disinflation preceded most of the calm, so the timing gives no support to the idea that a calm made the escape to low inflation possible, although a reduced-form VAR cannot settle questions of causation.
107.8. Why classical tests missed the drift#
How can a model with this much drift coexist with the classical tests that failed to reject time invariance?
Cogley and Sargent’s answer, in their section 3.7, is that those tests have little power against drift of the kind their posterior describes.
They first applied Bernanke and Mihov’s test, the sup-LM test of Andrews [1993] for a single break at an unknown date, to their data, and like Bernanke and Mihov they could not reject.
A failure to reject is evidence against drift only if the test would probably have rejected had drift been present.
To measure that probability, they drew \((\theta^T, H^T, B)\) from their posterior, simulated an artificial sample from each draw, applied the test, and counted rejections at the 5 percent level in 10,000 replications.
They did the same for the test of Nyblom [1989] and Hansen [1992], which is designed for parameters that drift as random walks, and for the sup-Wald version of Andrews’s test.
Rejection frequency under the posterior |
Nominal interest |
Unemployment |
Inflation |
VAR |
|---|---|---|---|---|
Andrews sup-LM (Table 4) |
0.136 |
0.172 |
0.112 |
0.252 |
Nyblom–Hansen (Table 5) |
0.076 |
0.170 |
0.086 |
0.234 |
Andrews sup-Wald (Table 6) |
0.173 |
0.269 |
0.711 |
0.296 |
On the actual data the sup-LM and Nyblom–Hansen tests fail to reject for every equation and for the VAR as a whole.
Yet even when \(\theta\) drifts as the posterior says it does, these tests fail to reject about three times as often as they reject, or more.
The one case with better-than-even power is the sup-Wald test for the inflation equation, and on the actual data that test rejects time invariance at the 1 percent level; it also rejects for the VAR as a whole at 5 percent.
Tests aimed at the parameters of the Clarida et al. [2000] policy rule, or at the first principal component of \(\theta_t\), also turn out to have low power.
So the failures to reject by Bernanke and Mihov [1998] and Sims [1999] are what one should expect even if the coefficients drifted as much as they do here.
Low power is not surprising.
The drifting-coefficient model nests time invariance at \(Q=0\): for \(Q\) near zero power is close to size, for very large \(Q\) the tests reject almost surely, and in between lies a range of economically meaningful drift that the tests usually miss.
Relatedly, Stock and Watson [1998] show that when the drift variance is small its maximum likelihood estimate is often exactly zero, so a classical estimate of “no drift” is weak evidence as well.
Cogley and Sargent close with a deeper reason, clearest in continuous time [Anderson et al., 2003].
The volatility of a diffusion can be recovered from its quadratic variation over an arbitrarily short stretch of a path, but its drift can be learned only slowly, over long spans of data.
Movements in the systematic part of a time series are therefore much harder to detect than movements in its volatility, which is exactly the asymmetry between the two halves of the bad-luck evidence: strong evidence of changing variances and weak evidence against changing coefficients.
Exercise 107.3 computes the power of the Nyblom–Hansen test in a simple autoregression with a drifting coefficient.
107.9. Bad policy or bad luck? A verdict#
The Bayesian VAR delivers a nuanced answer to the question that opened this lecture.
Volatilities drifted: the size of the shocks changed enormously, with a spike around 1980 and a return to calm in the mid-1980s, so the bad-luck story captures something real.
Coefficients drifted too: core inflation and inflation persistence rose through the 1970s and fell in the 1980s, and the estimated policy rule moved from passive to active; Exercise 107.2 shows that freezing the coefficients cannot reproduce the post-1980 fall in persistence.
Classical tests are not counterevidence: they have little power against drift of this kind.
The reduced-form VAR cannot by itself prove that changes in Federal Reserve beliefs caused the coefficient drift, because private behavior and other omitted mechanisms can also change reduced-form dynamics.
There is one more twist, and it loops us back to the theory of this section.
The escape-route models of Adaptive Learning and Escape Dynamics and Escaping Nash Inflation make a sharp prediction about persistence.
At the high-inflation self-confirming equilibrium the government’s inflation target barely moves, so inflation is nearly serially uncorrelated; in the static model it is white noise.
Measured persistence rises only along the transition from high to low inflation, when beliefs, and with them mean inflation, shift rapidly within any window of data.
These models therefore predict that persistence should peak during a disinflation and be low when inflation is high, an inverse relation between the level and the persistence of inflation in the words of Cogley and Sargent [2005] (footnote 28).
The data show the opposite: persistence was highest when core inflation was highest, and both fell together after 1980.
Exercise 107.4 checks the prediction in the model of Escaping Nash Inflation.
The positive correlation helped motivate a different mechanism, a policymaker who is reluctant to disinflate.
In Cogley and Sargent [2005], a Fed that averages over competing Phillips-curve models wants to reduce inflation in the 1970s but moves very slowly, because a model that warns of large unemployment costs still carries weight, and that gradualism makes deviations from target persistent precisely when inflation is highest.
In Primiceri [2006], policymakers who underestimated the natural rate and the persistence of inflation and overestimated the cost of disinflation are likewise slow to act in the 1970s and then change course.
The friendly debate with Sims, Zha, Bernanke, and Mihov thus did more than adjudicate a historical question: it sharpened the models of learning and drift that run through this section.
Cogley and Sargent’s sample ends in 2000.
Drifts and Volatilities after 2000 re-estimates the model with data through the financial crisis, the zero lower bound, the pandemic, and the 2021–2022 inflation surge, and The Lost Conquest: Fed Policy in the 2020s then returns to a learning Fed to interpret the 2020s.
107.10. Appendix: the sampler in detail#
107.10.1. The coefficient block#
Conditional on \(Q\) and \(R^T\), the measurement equation (107.1) and the random walk (107.2) form a linear Gaussian state-space model, and the forward recursion is the Kalman filter of A First Look at the Kalman Filter, started from \(\theta_{0\mid 0}=\bar\theta\) and \(P_{0\mid 0}=\bar P\):
The backward pass draws \(\theta_T\sim N(\theta_{T\mid T},P_{T\mid T})\) and then, for \(t=T-1,\ldots,0\),
Setting the random draws to zero turns the backward pass into the Rauch–Tung–Striebel smoother, which delivers \(\mathbb{E}(\theta_t\mid T)\) given \(Q\) and \(R^T\).
The gains \(J_t\) and the Cholesky factors of the conditional covariances depend
only on \(Q\) and \(R^T\), so backward_factors computes them once per sweep and
each redraw reuses them.
Drawing \(\theta_0\) supplies all \(T\) increments to the update of \(Q\).
Because the stability test runs after every backward pass, the sampler uses
stable_path, which applies the Schur–Cohn criterion to the characteristic
polynomials of all the companion matrices at once instead of computing their
eigenvalues: the roots lie inside the unit circle exactly when a recursion of
“reflection coefficients” stays inside \((-1,1)\), and the test gives the same
answer as is_stable several times faster.
When \(Q=0\), \(P_{t+1\mid t}=P_{t\mid t}\), so \(J_t=I\) and the conditional covariance is zero: the backward pass returns a constant path, which is how the sampler nests the constant-coefficient model.
The redraw step is rejection sampling.
Given \(\Omega\), the backward passes are independent draws from the Gaussian \(N(\hat z, C)\) of the whole path, and the first draw that lands in the stable set \(\mathcal S\) has density
which is the restricted full conditional; the normalizing probability is \(p(\Omega)\) in the identity of Simulating the posterior, and it never has to be computed.
107.10.2. The volatility block#
Given its neighbors and the orthogonalized residual \(\varepsilon^*_{it}\), the \(i\)-th component of \(B\varepsilon_t\), the conditional density of \(h_{it}\) is proportional to
The proposal draws \(\log h_{it}\) from the normal factor, with mean \(\tfrac12(\log h_{i,t-1}+\log h_{i,t+1})\) and variance \(\sigma_i^2/2\), so the Metropolis acceptance ratio involves only the likelihood factor.
The last date has a single neighbor, and \(\log h_{i0}\) has a conjugate normal conditional.
107.10.3. Monte Carlo error#
Successive sweeps are correlated, so the chain’s draws carry less information than their number suggests.
The trace of \(\operatorname{tr}(Q)\) over all sweeps, including the burn-in, shows how slowly the chain moves in the direction of \(Q\).
The reason is the dependence between \(Q\) and the coefficient path: given the path, its \(T\) increments pin \(Q\) down tightly, and given \(Q\), the roughness of the next path is pinned down too, so the two can move only gradually together.
fig, ax = plt.subplots(figsize=(9, 3.5))
ax.plot(posterior['trace_q'], lw=0.5)
ax.axvline(burn, color='0.45', ls='--', lw=1, label='end of burn-in')
ax.set_xlabel('sweep')
ax.set_ylabel(r'$\mathrm{tr}(Q)$')
ax.legend()
plt.show()
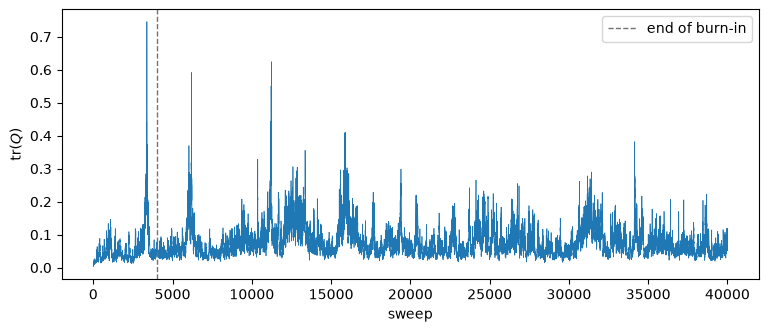
Fig. 107.12 \(\operatorname{tr}(Q)\) at every sweep#
The integrated autocorrelation time \(\tau\) measures how many sweeps are worth one independent draw; we estimate it with Sokal’s adaptive window.
def integrated_autocorrelation_time(x, c=5):
    """Sokal's adaptive-window estimate of the integrated autocorrelation time."""
    x = np.asarray(x) - np.mean(x)
    n = len(x)
    spectrum = np.fft.rfft(x, 2 * n)
    acf = np.fft.irfft(spectrum * np.conj(spectrum))[:n]
    τ = 2 * np.cumsum(acf / acf[0]) - 1
    window = np.flatnonzero(np.arange(n) >= c * τ)
    return τ[window[0]] if window.size else τ[-1]   # chain too short for the window


τ_trace_q = integrated_autocorrelation_time(trace_q)
pd.Series({
    'sweeps after burn-in': len(trace_q),
    'autocorrelation time of tr(Q)': τ_trace_q,
    'effective sample size of tr(Q)': len(trace_q) / τ_trace_q,
}, name='value').to_frame().round(1)
| value | |
|---|---|
| sweeps after burn-in | 36000.0 |
| autocorrelation time of tr(Q) | 416.0 |
| effective sample size of tr(Q) | 86.5 |
For the other headline numbers we use batch means: split the retained draws into ten consecutive batches, recompute each statistic on every batch, and estimate the Monte Carlo standard error of the full-run value by the standard deviation across batches divided by \(\sqrt{10}\).
def headline_statistics(s):
    """Statistics quoted in the lecture, from the retained draws in slice s."""
    θ_s = posterior['θ'][s].mean(axis=0)
    r_s = mean_innovation_covariance(posterior['h'][s], posterior['β'][s])
    core, natural = local_means(θ_s)
    persistence = persistence_path(θ_s, r_s)
    eigenvalues = np.linalg.eigvalsh(posterior['Q'][s].mean(axis=0))[::-1]
    return np.r_[
        np.trace(posterior['Q'][s], axis1=1, axis2=2).mean(),
        eigenvalues[0] / eigenvalues.sum(),
        100 * core[annual].max(),
        np.corrcoef(core, natural)[0, 1],
        np.corrcoef(core, persistence)[0, 1],
        persistence[annual].max(),
        [event[s].mean() for event in activism_events],
    ]


n_batches = 10
batch = n_draws // n_batches
batch_values = np.array([headline_statistics(slice(b * batch, (b + 1) * batch))
                         for b in range(n_batches)])
pd.DataFrame({
    'estimate': headline_statistics(slice(None)),
    'Monte Carlo s.e.': batch_values.std(axis=0, ddof=1) / np.sqrt(n_batches),
    'Cogley and Sargent': [0.047, 0.485, 8.0, 0.748, 0.92, np.nan,
                           0.208, 0.919, 0.941, 0.923, 0.943],
}, index=['posterior mean of tr(Q)', 'share of first principal component',
          'peak core inflation (%)', 'corr(core, natural rate)',
          'corr(core, persistence)', 'peak g(0)', 'P(A_1975 > 1)',
          'P(A_1985 > 1)', 'P(A_1995 > 1)', 'P(A_1985 > A_1975)',
          'P(A_1995 > A_1975)']).round(3)
| estimate | Monte Carlo s.e. | Cogley and Sargent | |
|---|---|---|---|
| posterior mean of tr(Q) | 0.077 | 0.004 | 0.047 |
| share of first principal component | 0.448 | 0.018 | 0.485 |
| peak core inflation (%) | 11.818 | 0.837 | 8.000 |
| corr(core, natural rate) | 0.837 | 0.027 | 0.748 |
| corr(core, persistence) | 0.965 | 0.007 | 0.920 |
| peak g(0) | 6.886 | 0.302 | NaN |
| P(A_1975 > 1) | 0.285 | 0.034 | 0.208 |
| P(A_1985 > 1) | 0.736 | 0.051 | 0.919 |
| P(A_1995 > 1) | 0.693 | 0.054 | 0.941 |
| P(A_1985 > A_1975) | 0.744 | 0.050 | 0.923 |
| P(A_1995 > A_1975) | 0.699 | 0.053 | 0.943 |
These standard errors are rough, because each batch spans only a few autocorrelation times of \(\operatorname{tr}(Q)\).
Runs with other seeds differ from this one by more than the standard errors suggest for \(\operatorname{tr}(Q)\), the peak of core inflation, and the activism probabilities.
The statements in the text are those that held in all of our runs: the structure of drift, the timing of the rise and fall of core inflation and persistence, their high correlation, and the shift from passive to active policy, but not exact magnitudes.
107.11. Exercises#
Exercise 107.1
Consider a stationary \(AR(1)\), \(\pi_t=\rho\pi_{t-1}+w_t\) with \(|\rho|<1\).
Use (107.8), with the companion matrix replaced by the scalar \(\rho\), to show that \(g(0)=(1+\rho)/[2\pi(1-\rho)]\), and invert the formula to express \(\rho\) as a function of \(g(0)\).
Apply the inversion draw by draw to the persistence draws in
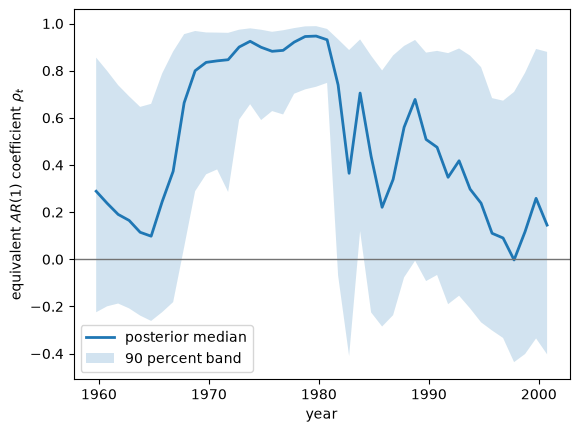
feature_draws['persistence'], and plot the posterior median and pointwise 90 percent band of the resulting “equivalent \(AR(1)\)” coefficient \(\rho_t\).Which \(\rho\) corresponds to white noise, and which to \(g(0)=1\)? How did the equivalent \(\rho_t\) change between the early 1960s, the 1970s, and the 1990s?
Solution
For the \(AR(1)\), \(f(0)=\sigma_w^2/[2\pi(1-\rho)^2]\) and the variance is \(\sigma_w^2/(1-\rho^2)\), so
White noise, \(g(0)=1/(2\pi)\), gives \(\rho=0\), and \(g(0)=1\) gives \(\rho=(2\pi-1)/(2\pi+1)\approx 0.73\).
The inversion is increasing in \(g(0)\), so it maps posterior quantiles of \(g_{\pi\pi}(0,t)\) into posterior quantiles of \(\rho_t\).
def equivalent_ar1(g):
    """AR(1) coefficient with the same normalized power at frequency zero."""
    return (2 * np.pi * g - 1) / (2 * np.pi * g + 1)


ρ_draws = equivalent_ar1(feature_draws['persistence'])
lower, median, upper = np.quantile(ρ_draws, (0.05, 0.5, 0.95), axis=1)

fig, ax = plt.subplots()
ax.plot(dates[annual], median, lw=2, label='posterior median')
ax.fill_between(dates[annual], lower, upper, alpha=0.2, label='90 percent band')
ax.axhline(0, color='0.45', lw=1)
ax.set_xlabel('year')
ax.set_ylabel(r'equivalent $AR(1)$ coefficient $\rho_t$')
ax.legend()
plt.show()
The table below gives the numbers behind the figure.
pd.Series({
    period: np.median(ρ_draws[(years[annual] >= first) & (years[annual] <= last)])
    for period, (first, last) in {'1960--1964': (1960, 1964),
                                  '1970--1979': (1970, 1979),
                                  '1990--2000': (1990, 2000)}.items()
}, name='median equivalent ρ').to_frame().round(2)
| median equivalent ρ | |
|---|---|
| 1960--1964 | 0.16 |
| 1970--1979 | 0.91 |
| 1990--2000 | 0.22 |
The equivalent coefficient is small in the early 1960s, about 0.9 in the 1970s, and below one half in the 1990s, although the band in the 1970s is wide.
Exercise 107.2
A formal contrast between drifting and constant coefficients requires refitting the model with \(Q=0\), the special case in which the VAR coefficients are constant and only the stochastic volatilities \(H_t\) move.
The sampler supports this: passing
fixed_q=np.zeros((n_coefficients, n_coefficients)) to run_sampler holds \(Q\)
at zero.
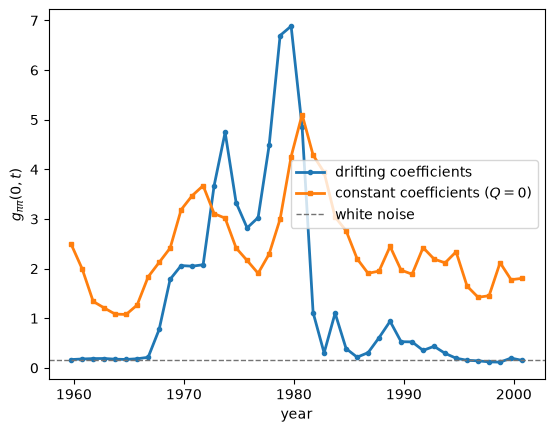
Fit the constant-coefficient model to the same sample and plot its \(g_{\pi\pi}(0,t)\) against the drifting-coefficient path of Fig. 107.7.
Can drifting volatility alone account for the rise and fall of measured persistence?
Solution
With \(Q=0\) the coefficient path is constant (Appendix: the sampler in detail), so \(A_{t\mid T}\) no longer moves and \(g_{\pi\pi}(0,t)\) can vary only through the composition of \(R_t\).
The constant-coefficient chain mixes much faster, so a shorter run suffices.
constant_posterior = run_sampler(
    data['y'], data['x'], prior,
    n_sweeps=4_000, burn=1_000, thin=10, seed=42,
    fixed_q=np.zeros((n_coefficients, n_coefficients)),
)
constant_θ = constant_posterior['θ'].mean(axis=0)
constant_r = mean_innovation_covariance(constant_posterior['h'],
                                        constant_posterior['β'])
constant_persistence = persistence_path(constant_θ, constant_r)

fig, ax = plt.subplots()
ax.plot(dates[annual], inflation_persistence[annual], 'o-', lw=2,
        markersize=3, label='drifting coefficients')
ax.plot(dates[annual], constant_persistence[annual], 's-', lw=2,
        markersize=3, label=r'constant coefficients ($Q=0$)')
ax.axhline(white_noise, color='0.45', ls='--', lw=1, label='white noise')
ax.set_xlabel('year')
ax.set_ylabel(r'$g_{\pi\pi}(0,t)$')
ax.legend(loc='center right')
plt.show()
The table below gives the numbers behind the figure.
after_1981 = years[annual] >= 1982
pd.DataFrame({
    label: {
        '1960--1964 mean': period_mean(path, 1960, 1964),
        '1970--1979 mean': period_mean(path, 1970, 1979),
        'peak': path[annual].max(),
        'year of the peak': years[annual][np.argmax(path[annual])],
        '1990--2000 mean': period_mean(path, 1990, 2000),
        'share of 1982--2000 years below one': np.mean(path[annual][after_1981] < 1),
    }
    for label, path in (('drifting coefficients', inflation_persistence),
                        ('constant coefficients', constant_persistence))
}).round(2)
| drifting coefficients | constant coefficients | |
|---|---|---|
| 1960--1964 mean | 0.18 | 1.49 |
| 1970--1979 mean | 3.84 | 2.88 |
| peak | 6.89 | 5.10 |
| year of the peak | 1979.00 | 1980.00 |
| 1990--2000 mean | 0.26 | 1.92 |
| share of 1982--2000 years below one | 0.95 | 0.00 |
With constant coefficients, measured persistence still moves, because the composition of \(R_t\) changes even after its scale is normalized out, and the constant-coefficient path peaks around 1980, when inflation innovations are large relative to the others.
But it misses both ends of the story.
It puts persistence in the early 1960s far above the white-noise value, and after 1980 it stays above one, with 1990s persistence not far below its 1970s level, while the drifting-coefficient path is below one in most or all of those years.
Drifting volatility alone accounts for some of the movement in measured persistence but neither its low level in the early 1960s nor its post-1980 collapse, which is why both channels are needed to answer the bad-policy-or-bad-luck question.
Exercise 107.3
For a regression \(z_t=x_t^\top b+u_t\) estimated by least squares with residuals \(\hat u_t\), the statistic of Nyblom [1989] and Hansen [1992] for constancy of all coefficients is
Apply it to the \(AR(1)\) with intercept \(y_t=0.5+\rho_t y_{t-1}+w_t\), \(w_t\sim N(0,1)\), with \(T=168\) and \(\rho_0=0.6\), using 2,000 replications per case.
Simulate the 5 percent critical value when \(\rho_t\) is constant, and compare it with Hansen’s asymptotic value of 0.749 for two coefficients.
Compute the rejection frequency when \(\rho_t\) is a random walk, kept inside \([-0.97, 0.97]\), with innovation variance \(q\in\{10^{-4}, 4\times 10^{-4}, 10^{-3}, 4\times 10^{-3}\}\).
Compute the rejection frequency when \(\rho\) is constant but the standard deviation of \(w_t\) triples halfway through the sample.
Relate your results to the power that Cogley and Sargent report in Why classical tests missed the drift.
Solution
We simulate all replications at once.
def simulate_ar1_panel(n, T, q, rng, volatility_break=False):
    """n replications of y_t = 0.5 + ρ_t y_{t-1} + s_t w_t."""
    y = np.zeros((n, T + 1))
    ρ = np.full(n, 0.6)
    for t in range(1, T + 1):
        ρ = np.clip(ρ + np.sqrt(q) * rng.standard_normal(n), -0.97, 0.97)
        scale = 3.0 if volatility_break and t > T // 2 else 1.0
        y[:, t] = 0.5 + ρ * y[:, t - 1] + scale * rng.standard_normal(n)
    return y


def nyblom_hansen(y):
    """Nyblom-Hansen L statistic for the intercept and slope, by replication."""
    X = np.stack((np.ones_like(y[:, :-1]), y[:, :-1]), axis=2)
    z = y[:, 1:]
    b = np.linalg.solve(np.einsum('nti,ntj->nij', X, X),
                        np.einsum('nti,nt->ni', X, z)[:, :, None])[:, :, 0]
    scores = X * (z - np.einsum('nti,ni->nt', X, b))[:, :, None]
    S = np.cumsum(scores, axis=1)
    V = np.einsum('nti,ntj->nij', scores, scores) / z.shape[1]
    return np.einsum('nti,nij,ntj->n', S, np.linalg.inv(V), S) / z.shape[1]**2


rng = np.random.default_rng(1234)
n, T = 2_000, 168
critical_value = np.quantile(nyblom_hansen(simulate_ar1_panel(n, T, 0.0, rng)), 0.95)

rows = {}
for q in (1e-4, 4e-4, 1e-3, 4e-3):
    L = nyblom_hansen(simulate_ar1_panel(n, T, q, rng))
    rows[f'random-walk ρ, q = {q:g}'] = {
        'sd of the change in ρ over the sample': np.sqrt(T * q),
        'rejection frequency': np.mean(L > critical_value),
    }
L = nyblom_hansen(simulate_ar1_panel(n, T, 0.0, rng, volatility_break=True))
rows['constant ρ, shock sd triples'] = {
    'sd of the change in ρ over the sample': 0.0,
    'rejection frequency': np.mean(L > critical_value),
}
print(f'simulated 5 percent critical value: {critical_value:.3f}')
pd.DataFrame(rows).T.round(3)
simulated 5 percent critical value: 0.731
| sd of the change in ρ over the sample | rejection frequency | |
|---|---|---|
| random-walk ρ, q = 0.0001 | 0.130 | 0.100 |
| random-walk ρ, q = 0.0004 | 0.259 | 0.210 |
| random-walk ρ, q = 0.001 | 0.410 | 0.292 |
| random-walk ρ, q = 0.004 | 0.820 | 0.428 |
| constant ρ, shock sd triples | 0.000 | 0.032 |
The simulated critical value is close to Hansen’s asymptotic value.
Power rises with \(q\) but stays below one half even when the standard deviation of the change in \(\rho\) over the sample is about 0.8, and drift that moves \(\rho\) by a few tenths over the sample is detected only a fifth to a third of the time, the same order as the 0.08 to 0.23 that Cogley and Sargent find for their posterior.
A tripling of the shock standard deviation with constant \(\rho\) is rejected no more often than the test’s 5 percent size, so the test does not mistake volatility for drift; it is simply weak against drift.
Exercise 107.4
Do escape-route models predict the positive correlation between mean inflation and persistence that we found in Inflation persistence?
Simulate the static model of Escaping Nash Inflation, with \(\theta=1\), \(u=5\), and \(\sigma_1=\sigma_2=0.3\), under constant-gain least squares with gain \(\varepsilon=0.02\) for 40,000 periods, starting at the self-confirming equilibrium.
In rolling windows of 40 periods, fit an \(AR(1)\) to inflation, compute its \(g(0)=(1+\hat\rho)/[2\pi(1-\hat\rho)]\), and record mean inflation.
Compare the median \(g(0)\) in windows that sit at Nash (mean inflation above 4 in both halves), near Ramsey (below 1 in both halves), and that span a fall (above 3.5 in the first half and below 1.5 in the second).
Compute the correlation between rolling mean inflation and rolling \(g(0)\), and compare it with the correlation between core inflation and persistence in the data.
Solution
The simulation repeats simulate_path from Escaping Nash Inflation, with
beliefs \(\gamma=(\gamma_1,\gamma_{-1})\) about the slope and intercept of the
perceived Phillips curve \(U=\gamma_1\pi+\gamma_{-1}\).
def simulate_escapes(ε, n_periods, θ=1.0, u=5.0, σ1=0.3, σ2=0.3, seed=0):
    """Inflation in the static CWS model under constant-gain least squares."""
    rng = np.random.default_rng(seed)
    γ = np.array([-θ, u * (1 + θ**2)])                     # SCE beliefs
    x = -γ[1] * γ[0] / (1 + γ[0]**2)
    R = np.array([[x**2 + σ2**2, x], [x, 1.0]])
    π = np.empty(n_periods)
    for n in range(n_periods):
        x = -γ[1] * γ[0] / (1 + γ[0]**2)                    # Phelps choice
        w1, w2 = rng.standard_normal(2)
        π[n] = x + σ2 * w2
        U = u - θ * σ2 * w2 + σ1 * w1
        Φ = np.array([π[n], 1.0])
        R = R + ε * (np.outer(Φ, Φ) - R)
        γ = γ + ε * np.linalg.solve(R, Φ * (U - Φ @ γ))
    return π


π_sim = simulate_escapes(0.02, 40_000, seed=2)
windows = np.lib.stride_tricks.sliding_window_view(π_sim, 40)[::2]
centered = windows - windows.mean(axis=1, keepdims=True)
ρ_hat = np.clip(np.sum(centered[:, 1:] * centered[:, :-1], axis=1)
                / np.sum(centered[:, :-1]**2, axis=1), -0.99, 0.99)
g0 = (1 + ρ_hat) / (2 * np.pi * (1 - ρ_hat))
first, second = windows[:, :20].mean(axis=1), windows[:, 20:].mean(axis=1)

groups = {
    'at Nash': (first > 4) & (second > 4),
    'near Ramsey': (first < 1) & (second < 1),
    'spanning a fall': (first > 3.5) & (second < 1.5),
}
display(pd.DataFrame({
    'windows': {label: mask.sum() for label, mask in groups.items()},
    'median g(0)': {label: np.median(g0[mask]) for label, mask in groups.items()},
}).round(2))
print(f'correlation of rolling mean inflation and rolling g(0): '
      f'{np.corrcoef(windows.mean(axis=1), g0)[0, 1]:.3f}')
print(f'correlation of core inflation and persistence in the data: '
      f'{core_persistence_correlation:.3f}')
| windows | median g(0) | |
|---|---|---|
| at Nash | 1849 | 0.16 |
| near Ramsey | 3125 | 0.17 |
| spanning a fall | 135 | 9.73 |
correlation of rolling mean inflation and rolling g(0): 0.033
correlation of core inflation and persistence in the data: 0.965
Measured persistence is close to the white-noise value \(1/(2\pi)\) both at Nash and near Ramsey, and it is high only in windows that span a fall, where the shifting mean inside the window looks like persistence.
Over the whole simulation, rolling mean inflation and rolling persistence are nearly uncorrelated, far from the strong positive correlation in the data.
The escape-route model ties persistence to changes in inflation, not to its level: high inflation at the self-confirming equilibrium comes with white-noise inflation, and persistence peaks while inflation falls, the inverse relation that Cogley and Sargent [2005] describe.