98. The Credibility Problem#
98.1. Overview#
This lecture describes a basic expectational Phillips curve model of the sort studied by Kydland and Prescott [1977] and Barro and Gordon [1983].
It is the first modeling lecture in a suite based on chapters of Sargent [1999], following The Rise and Fall of U.S. Inflation, which lays out the two stories and reviews the Lucas Critique.
This lecture follows chapter 3 of the book, and Credible Government Policies follows chapter 4.
Together the two lectures formalize
the temptation to inflate that is unleashed by the discovery of a Phillips curve,
the value of a commitment technology for resisting that temptation, and
the fragility of reputational mechanisms as substitutes for commitment.
Throughout, rational expectations is the only equilibrium concept that we use.
Alterations in the timing of decisions by a government and a private sector induce different economies with distinct outcomes.
A government faces a credibility problem whenever it wishes to make decisions sooner than it must.
We shall compare outcomes under two timing protocols:
In one, the government chooses inflation before the private sector sets its expectations, so the government takes into account how its choice shapes those expectations.
In the other, the government chooses inflation after the private sector has set its expectations.
The deterioration in outcomes under the second protocol measures the loss from an inability to commit.
Time Inconsistency of Ramsey Plans studies the same time-inconsistency problem in Calvo’s dynamic monetary model.
We also study two out-of-equilibrium dynamics that converge to the no-commitment (Nash) outcome:
best response dynamics, and
least squares learning.
Let’s start with some standard imports:
import matplotlib.pyplot as plt
import numpy as np
98.2. A one-period economy#
Although credibility problems are intrinsically dynamic, it is possible to describe them in a one-period model under different patterns of within-period timing.
This prepares the way for the multi-period analyses in subsequent lectures.
We describe a version of the one-period model of Kydland and Prescott [1977] in the terms used by Nancy Stokey [Stokey, 1989].
Let \((U, y, x)\) be the unemployment rate, the inflation rate, and the public’s expectation of the inflation rate, respectively.
The government’s one-period payoff is
Unemployment is determined by an expectations-augmented Phillips curve
The equation asserts that unemployment deviates from \(U^*\), the natural rate, only when there is surprise inflation or deflation.
Substituting (98.2) into (98.1) expresses the government’s payoff as a function \(r(x, y)\):
We work with the following objects.
Rational expectations equilibrium: a triple \((U, x, y)\) satisfying (98.2) and \(y = x\).
Government (one-period) best response: given the public’s expectation \(x\), a decision rule \(B(x) = \operatorname{argmax}_y r(x, y)\) for setting \(y\).
Nash equilibrium: a pair \((x, y)\) satisfying (i) \(x = y\), and (ii) \(y = B(x)\).
Ramsey problem: \(\max_y r(y, y)\).
The Ramsey outcome is the value of \(y\) that attains the maximum.
Best response dynamics: the dynamical system \(y_t = B(y_{t-1})\), \(y_0\) given.
A rational expectations equilibrium is a \((U, x, y)\) triple that lies on the Phillips curve and for which private agents are not fooled, given \(x\).
Substituting \(x = y\) into the Phillips curve (98.2) shows that \(U = U^*\) in any rational expectations equilibrium.
This identifies \(U^*\) as the natural rate of unemployment.
98.3. Nash and Ramsey outcomes#
A Nash equilibrium builds in a best response by the government, taking the state of expectations \(x\) as given, together with a response \(x = y\) by the market, i.e., rational expectations for a given \(y\).
Maximizing (98.3) with respect to \(y\) for a fixed \(x\) gives the government’s best response function
The Nash equilibrium sets \(x = y = B(x)\), which gives
The Ramsey problem instead imposes \(x = y\) before maximizing, so it maximizes \(r(y, y) = -\tfrac{1}{2}(U^{*2} + y^2)\), which yields the Ramsey outcome
Thus \(r(x^R, y^R) = -\tfrac{1}{2} U^{*2}\) while \(r(x^N, y^N) = -\tfrac{1}{2}(1 + \theta^2) U^{*2}\).
Both outcomes deliver the natural rate \(U^*\), but the Nash equilibrium delivers it with positive inflation and hence a strictly lower payoff.
Let’s collect these formulas in a class.
class CredibilityModel:
    """
    A one-period expectational Phillips curve economy.
    """

    def __init__(self, θ=1.0, U_star=5.0):
        self.θ, self.U_star = θ, U_star

    def phillips(self, y, x):
        "Unemployment implied by inflation y and expected inflation x."
        return self.U_star - self.θ * (y - x)

    def r(self, x, y):
        "Government one-period payoff."
        U = self.phillips(y, x)
        return -0.5 * (U**2 + y**2)

    def B(self, x):
        "Government best response to expected inflation x."
        θ = self.θ
        return θ / (θ**2 + 1) * self.U_star + θ**2 / (θ**2 + 1) * x

    def nash(self):
        "Nash equilibrium inflation (= expected inflation)."
        return self.θ * self.U_star

    def ramsey(self):
        "Ramsey inflation (= expected inflation)."
        return 0.0
The default calibration is \(\theta = 1\) and \(U^* = 5\).
cm = CredibilityModel()

y_N, y_R = cm.nash(), cm.ramsey()
print(f"Nash inflation      y^N = {y_N:.2f}")
print(f"Ramsey inflation    y^R = {y_R:.2f}")
print(f"Nash payoff         r   = {cm.r(y_N, y_N):.3f}")
print(f"Ramsey payoff       r   = {cm.r(y_R, y_R):.3f}")
Nash inflation      y^N = 5.00
Ramsey inflation    y^R = 0.00
Nash payoff         r   = -25.000
Ramsey payoff       r   = -12.500
The Nash payoff is worse than the Ramsey payoff.
The government would prefer the Ramsey outcome, but it cannot attain it without a technology for committing to \(y = 0\) before the public forms its expectations.
The Nash equilibrium is supported by a timing protocol in which the government decides after the private sector sets its expectations.
The Ramsey outcome is associated with a timing protocol in which the government chooses first, knowing that in a rational expectations equilibrium the public’s expectations will move with its choice because \(y = x\).
98.3.1. A picture of the two outcomes#
The government’s indifference curves are circles centered at the origin in \((U, y)\) space, because the payoff (98.1) depends only on \(U^2 + y^2\).
For a given expectation \(x\), the Phillips curve (98.2) is a downward-sloping line in \((U, y)\) space.
The government’s best response for \(y\), given \(x\), occurs where an indifference curve is tangent to the Phillips curve indexed by \(x\).
fig, ax = plt.subplots(figsize=(7, 6))

U_grid = np.linspace(0, 12, 200)

# a family of Phillips curves indexed by expected inflation x
for x in [0.0, y_N / 2, y_N]:
    # U = U_star - θ (y - x)  =>  y = x + (U_star - U) / θ
    y_line = x + (cm.U_star - U_grid) / cm.θ
    ax.plot(U_grid, y_line, 'C0', lw=1)

# government indifference curves (circles U^2 + y^2 = const)
ξ = np.linspace(0, 2 * np.pi, 200)
for R in [np.hypot(cm.U_star, y_R), np.hypot(cm.U_star, y_N)]:
    if R > 0:
        ax.plot(R * np.cos(ξ), R * np.sin(ξ), 'C1--', lw=1)

ax.plot(cm.U_star, y_N, 'ko')
ax.annotate('Nash', (cm.U_star, y_N), (cm.U_star + 0.4, y_N + 0.4))
ax.plot(cm.U_star, y_R, 'ko')
ax.annotate('Ramsey', (cm.U_star, y_R), (cm.U_star + 0.4, y_R + 0.4))

ax.set_xlim(0, 12)
ax.set_ylim(0, 10)
ax.set_xlabel('unemployment $U$')
ax.set_ylabel('inflation $y$')
plt.show()
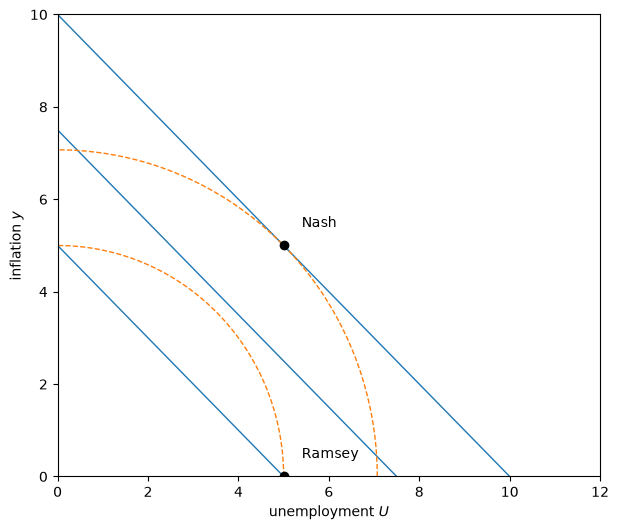
Fig. 98.1 Phillips curves indexed by expected inflation, government indifference curves, and the Nash and Ramsey outcomes#
Solid lines are Phillips curves for expected inflation \(x \in \{0, y^N/2, y^N\}\); dashed circles are government indifference curves.
The Nash outcome \((U^*, y^N)\) lies on a larger circle (lower payoff) than the Ramsey outcome \((U^*, 0)\).
98.4. Best response dynamics#
Best response dynamics convert the one-period model into a dynamic one by positing an adaptive mechanism in which expected inflation equals last period’s inflation, \(x_t = y_{t-1}\).
This leads to the dynamics
Because \(B\) is an affine map with slope \(\theta^2 / (\theta^2 + 1) \in (0, 1)\), iterating on it converges to the fixed point \(y^N = \theta U^*\) from any starting point.
Let’s plot the best response function against the 45-degree line and simulate the dynamics.
def best_response_path(cm, y0, T=20):
    "Iterate y_{t+1} = B(y_t)."
    y = np.empty(T + 1)
    y[0] = y0
    for t in range(T):
        y[t + 1] = cm.B(y[t])
    return y

y_path = best_response_path(cm, y0=0.0, T=20)
The figure traces this path as a cobweb between the best response function and the 45-degree line.
fig, ax = plt.subplots(figsize=(6, 6))

x_grid = np.linspace(0, y_N + 1, 100)
ax.plot(x_grid, cm.B(x_grid), 'C0', label='$B(x)$')
ax.plot(x_grid, x_grid, 'k--', lw=1, label='45 degrees')

# cobweb of the best response dynamics
for t in range(len(y_path) - 1):
    ax.plot([y_path[t], y_path[t]], [y_path[t], y_path[t + 1]], 'C1', lw=0.8)
    ax.plot([y_path[t], y_path[t + 1]], [y_path[t + 1], y_path[t + 1]],
            'C1', lw=0.8)

ax.plot(y_N, y_N, 'ko')
ax.annotate('Nash', (y_N, y_N), (y_N - 1.5, y_N + 0.3))
ax.set_xlabel('$x$')
ax.set_ylabel('$B(x)$')
ax.legend()
plt.show()
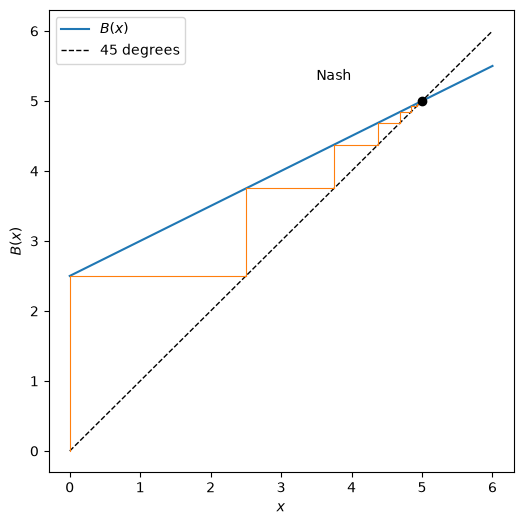
Fig. 98.2 Best response dynamics cobwebbing up to the Nash inflation rate#
Starting from \(x = 0\) (the Ramsey inflation rate), the government sets \(y = B(0) > 0\).
This provokes the public to raise its expectation, which leads the government to raise inflation further.
The limit of this process is the Nash outcome \(y = x = y^N\), a self-confirming situation.
Thus best response dynamics converge to the Nash equilibrium and reinforce \((U^*, y^N)\) as the prediction of the model without a commitment technology.
98.5. Least squares learning converges to Nash#
A version of the best response dynamics also emerges from least squares learning.
Least squares learning plays a key role throughout this suite of lectures, and this simple example introduces analytical elements that reappear later in more complex settings.
Bray [1982] studied a competitive market in which traders formed the expected price by averaging past prices.
In the same spirit, assume that for \(t \geq 2\) expected inflation \(x_t\) is the average of past inflation rates,
which can be represented recursively as
Actual inflation is a disturbed version of the best response mapping evaluated at \(x_t\),
where \(\eta_t\) is an IID mean-zero term that represents the government’s imperfect control of inflation.
Substituting (98.6), dated \(t-1\), into (98.5) gives the stochastic recursion
The forecast \(x_t\) depends only on shocks dated \(t-1\) and earlier, as it must, because the public forms it before it sees \(y_t\).
(The corresponding equation (8) of Sargent [1999] dates this shock \(t\), a slip.)
This is Bray’s market of From relaxation to learning: Bray’s market, written in the notation of this lecture.
The government’s best response \(B\) plays the role of the firms’ best response \(h\).
The forecast \(x_t\) plays the role of the firms’ belief \(X^*_{t-1}\), formed from data through \(t-1\).
Inflation \(y_t\) plays the role of realized average output \(X_t\).
The feedback from beliefs to outcomes is
so Bray’s condition \(h' < 1\) for least squares learners to converge holds for every \(\theta\).
Least Squares Learning in Self-Referential Models analyzes Bray’s model (its Example 2) in the general framework of Marcet and Sargent [1989].
By the theory of stochastic approximation, the limiting behavior of \(x_t\) is described by the associated ordinary differential equation (ODE)
The rest point of this ODE satisfies \(x = B(x)\), which is the Nash equilibrium inflation rate \(x = \theta U^*\).
Because the map \(B\) is affine, the ODE is linear with slope
Since \(\mathcal{M} < 0\), the ODE is stable about its rest point.
In the language of One recursion, many learners, the Nash equilibrium is E-stable (expectationally stable): \(B\) maps perceived into actual inflation, and the derivative of that map, \(h' = B'\), is less than one.
\(\mathcal{M} = h' - 1\) is the E-stability eigenvalue of this one-dimensional system.
E-stability is what brings to bear the theorems of Marcet and Sargent [1989], which give conditions under which \(x_t\) converges to \(y^N\) globally.
The same number recurs throughout this suite.
When the government itself estimates a Phillips curve by least squares, the mean dynamics of its beliefs have eigenvalues \(-1\) and \(-1/(1+\theta^2)\) (Uniqueness and E-stability, Mean dynamics near the self-confirming equilibrium).
Let’s simulate the recursion (98.7) and confirm convergence to the Nash outcome.
def ls_learning(cm, T=2000, σ_η=1.0, seed=0, ε=None):
    """
    Simulate learning of expected inflation.

    x[t] is the forecast formed after observing y_1, ..., y_t, which is the
    x_{t+1} of pc_expect1; x[0] = x_1 = 0, and y[0] is unused.

    With ε=None the gain is 1/t (least squares: the 1/(t-1) gain of
    pc_expect1, reindexed); otherwise it is the constant ε.
    """
    rng = np.random.default_rng(seed)
    x = np.empty(T + 1)
    y = np.full(T + 1, np.nan)
    x[0] = 0.0
    for t in range(1, T + 1):
        y[t] = cm.B(x[t - 1]) + σ_η * rng.standard_normal()
        gain = 1.0 / t if ε is None else ε
        x[t] = x[t - 1] + gain * (y[t] - x[t - 1])
    return x, y
We simulate 2000 periods at the default calibration.
x, y = ls_learning(cm, T=2000, σ_η=1.0)

fig, ax = plt.subplots(figsize=(9, 5))
ax.plot(x, 'C0', lw=1, label='expected inflation $x_t$')
ax.axhline(y_N, color='k', ls='--', lw=1, label='Nash $y^N$')
ax.axhline(y_R, color='C2', ls=':', lw=1, label='Ramsey $y^R$')
ax.set_xlabel('$t$')
ax.set_ylabel('inflation')
ax.legend()
plt.show()
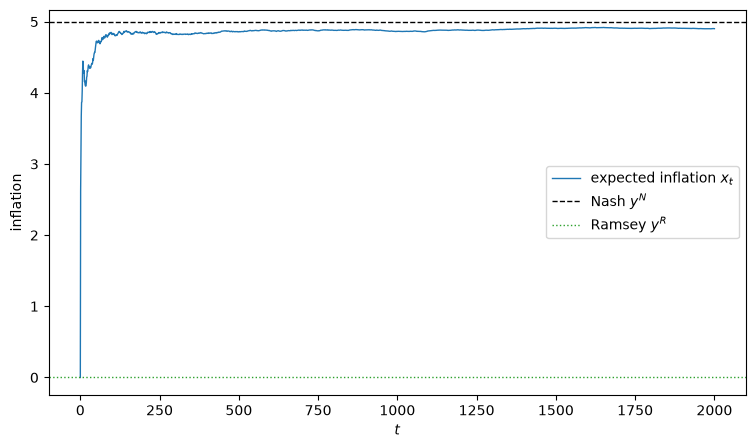
Fig. 98.3 Least squares learning of expected inflation converges to the Nash outcome#
The least squares dynamics confirm the pessimism of the best response dynamics.
As Sargent [1999] puts it, this pessimism undermines the triumph of natural-rate theory story of The Rise and Fall of U.S. Inflation, especially its triumph aspect.
Given an initial condition in the form of a low, gold-standard or Bretton Woods value of \(x\), the best response or least squares dynamics can explain an acceleration of inflation.
But they cannot explain a Volcker-style stabilization that brings inflation back down.
Later lectures reformulate versions of least squares learning in ways designed to moderate this pessimism, and in doing so they move us away from the triumph story and toward the vindication story.
98.5.1. How fast?#
\(\mathcal{M}\) also governs the speed of convergence (footnote 3 of chapter 3 of Sargent [1999]; Evans and Honkapohja [2001]).
Taking expectations of (98.7) shows that the mean error \(E x_t - y^N\) obeys the noise-free version of the recursion, so it shrinks like \(t^{\mathcal{M}}\).
A necessary condition for convergence at the usual rate, with \(\sqrt{t}\,(x_t - y^N)\) settling into a normal distribution, is \(\mathcal{M} < -1/2\), which here requires \(\theta < 1\).
When \(-1/2 \leq \mathcal{M} < 0\), \(x_t\) still converges to \(y^N\), but more slowly, at a rate governed by \(|\mathcal{M}|\).
At \(\theta = 1\), the value used here and in most later lectures, \(\mathcal{M} = -1/2\) sits exactly on the boundary: the standard deviation of \(x_t\) shrinks like \(\sqrt{\log t / t}\) instead of \(1/\sqrt{t}\).
In the market of From relaxation to learning: Bray’s market, by contrast, \(h' = -1.5\) gives \(\mathcal{M} = -2.5\), and errors shrink at the usual rate \(t^{-1/2}\).
Exercise Exercise 98.1 measures these rates.
The \(-1/2\) boundary concerns the convergence rate of a learner whose gain decreases like \(1/t\).
It is not what governs how often a constant-gain learner escapes from the Nash outcome in later lectures; a large-deviation rate does that (A primer on recursive algorithms).
98.6. More foresight#
Best response and least squares learning are out-of-equilibrium dynamics tacked onto a one-period economy.
They force all movement through expectation formation: in choosing inflation, the government forgets that the economy lasts more than one period.
Better outcomes can occur if the government plans for the future.
Subsequent lectures describe three ways of modeling foresight, which impute varying amounts of rationality and predict different qualities of outcomes:
A reputational approach that attributes rational expectations to both the government and the public, the subject of Credible Government Policies, which comes next.
Many outcomes are sustainable, ranging from repetition of the Ramsey outcome to paths worse than repetition of the Nash outcome, a multiplicity that turns out to be the theory’s chief lesson.
An approach that keeps the government rational but gives the public adaptive expectations in the original Cagan-Friedman sense, the subject of Adaptive Expectations and the Phelps Problem.
Depending on a comparison between a discount factor and an adaptation parameter, this setup can improve outcomes and possibly sustain repetition of the Ramsey outcome.
Approaches that make the government boundedly rational as well.
In Self-Confirming Equilibria, prepared by Optimal Misspecified Beliefs, the government holds a possibly misspecified model of the Phillips curve that the data it generates confirm.
From Adaptive Learning and Escape Dynamics on, it re-estimates that model in real time.
The outcomes depend on details of the beliefs assigned to the government, and a vindication of econometric policy evaluation can emerge.
98.7. Appendix: stochastic approximation#
Here we sketch why the ODE (98.8) governs the tail behavior of the stochastic difference equation (98.7).
The argument, due to Kushner and Clark [1978], has two key components: a shift in time scale and a liberal application of averaging.
The subsection “Stochastic approximation and E-stability” of One recursion, many learners presents the same tools from the standpoint of the Bounded Rationality suite, and Least Squares Learning in Self-Referential Models states the Marcet–Sargent convergence theorems for vectors of beliefs.
Let \(\{a_n\}_{n \geq 0}\) be a positive sequence of gains satisfying
The choice \(a_n = 1 / (n + 1)\) satisfies these assumptions.
Relabel (98.7) so that its \(x_{n+1}\) and \(\eta_{n+1}\) become \(x_n\) and \(\eta_n\).
Then the gain is \(a_n = 1/(n+1)\) and the recursion reads
where \(\eta_n\) is IID with mean zero and finite variance.
Introduce the transformed time scale \(t_0 = 0\), \(t_n = \sum_{i=0}^{n-1} a_i\), and interpolate the discrete sequence \(\{x_n\}\) into a continuous-time process \(x^0(t)\).
The map \(m(t) = \max\{n : t_n \leq t\}\) takes transformed time back to the original index.
Kushner and Clark show that on this transformed time scale the interpolated process is well approximated by the integral equation
where the approximation error \(R(t)\) has two components — one from approximating a distributed lag in \(B(x) - x\) by an integral, and one from a distributed lag in \(\eta_s\).
Studying a sequence of left-shifted versions of the process, they show that both error components can be driven to zero as \(n \to \infty\).
For the noise component, the key step is to note that over the stretch of transformed time from \(t_n\) to \(t_n + t\) the noise enters through the martingale \(W_n(t) = \sum_{i=n}^{m(t_n + t)} a_i \eta_i\).
Its variance is \(\mathbb{V}[\eta] \sum_{i=n}^{m(t_n + t)} a_i^2\), a tail sum of the convergent series \(\sum_i a_i^2\), and so it goes to zero as \(n \to \infty\).
The remaining error is sent to zero because \(a_i \to 0\) shrinks the mesh of the Riemann sum used to approximate the integral.
In the limit, the stochastic difference equation (98.9) shares the behavior of the non-stochastic ODE
which is said to describe the mean dynamics of the original system.
Later lectures study systems like (98.9) in which \(a_i\) does not approach zero as \(i\) grows — so-called constant gain algorithms.
Exercise Exercise 98.2 gives a first look at one.
The mean dynamics (98.8) and these constant-gain algorithms become the central tools of Adaptive Learning and Escape Dynamics, Escaping Nash Inflation, and Priors, Escapes, and Learning Cycles, where the scalar expectation \(x\) studied here grows into a whole vector of drifting Phillips-curve coefficients.
98.8. Exercises#
Exercise 98.1
This exercise measures how the speed of least squares learning depends on \(\mathcal{M} = -1/(1 + \theta^2)\).
Let \(e_t = x_t - \theta U^*\) be the forecast error relative to Nash.
Show that the mean error \(E e_t\) obeys the noise-free version of (98.7), and that it shrinks like \(t^{\mathcal{M}}\).
For \(\theta \in \{0.5, 1, 2\}\) and \(U^* = 5\), simulate 200 paths of length \(T = 3000\) (seeds \(0, \ldots, 199\)). On log–log axes, plot \(|\bar e_t| / (\theta U^*)\), where \(\bar e_t\) is the average error across paths, and compare it with the exact mean error. Dividing by \(\theta U^*\), the initial error, makes the three cases comparable.
Plot \(\sqrt{t}\) times the standard deviation of \(x_t\) across paths, and explain why it levels off only for \(\theta < 1\).
What fraction of the \(\theta = 2\) paths is still below the Nash rate at \(t = 3000\)? Does the \(\theta = 2\) learner wander around its limit?
Solution
Write \(B(x) - x = \mathcal{M}(x - y^N)\).
Shifted forward one period, (98.7) says \(e_{t+1} = (1 + \mathcal{M}/t)\, e_t + \eta_t / t\), with \(e_1 = -\theta U^*\), and taking expectations removes the shock.
So the mean error is exactly the path that ls_learning produces with \(\sigma_\eta = 0\):
because \(\log \prod_s (1 + \mathcal{M}/s) \approx \mathcal{M} \sum_{s \leq t} 1/s \approx \mathcal{M} \log t\).
The variance \(v_t\) of \(e_t\) obeys \(v_{t+1} = (1 + \mathcal{M}/t)^2 v_t + \sigma_\eta^2 / t^2\).
Its solution behaves like \(\sigma_\eta^2 / [(-2\mathcal{M} - 1)\, t]\) when \(\mathcal{M} < -1/2\), like \(\sigma_\eta^2 \log t / t\) when \(\mathcal{M} = -1/2\), and like a multiple of \(t^{2\mathcal{M}}\) when \(\mathcal{M} > -1/2\).
The simulation below computes the mean error both ways and fits slopes on \(100 \leq t \leq 3000\).
T, n_paths = 3000, 200
t = np.arange(1, T + 1)
fit = t >= 100

fig, axes = plt.subplots(1, 2, figsize=(12, 4.5))
for k, θ in enumerate([0.5, 1.0, 2.0]):
    cm_θ = CredibilityModel(θ=θ, U_star=5.0)
    y_N_θ, M = cm_θ.nash(), -1 / (1 + θ**2)

    # errors after t = 1, ..., T observations, one row per path
    e = np.array([ls_learning(cm_θ, T=T, seed=s)[0][1:]
                  for s in range(n_paths)]) - y_N_θ
    exact = ls_learning(cm_θ, T=T, σ_η=0.0)[0][1:] - y_N_θ    # E e_t
    mean, sd = e.mean(axis=0), e.std(axis=0)

    slope_exact = np.polyfit(np.log(t[fit]), np.log(np.abs(exact[fit])), 1)[0]
    slope_mc = np.polyfit(np.log(t[fit]), np.log(np.abs(mean[fit])), 1)[0]
    noisy = np.abs(exact) < 2 * sd / np.sqrt(n_paths)
    print(f"θ = {θ}:  M = {M:+.2f},  slope of exact mean {slope_exact:+.3f},  "
          f"slope of 200-path mean {slope_mc:+.3f}")
    if noisy.any():
        print(f"         exact mean below 2 Monte Carlo standard errors "
              f"from t = {t[noisy][0]}")
    print(f"         at t = {T}: mean error {mean[-1]:+.3f}, sd {sd[-1]:.3f}, "
          f"share of paths below Nash {np.mean(e[:, -1] < 0):.2f}")

    axes[0].loglog(t, np.abs(mean) / y_N_θ, color=f'C{k}', lw=0.7, alpha=0.6)
    axes[0].loglog(t, np.abs(exact) / y_N_θ, color=f'C{k}', ls='--', lw=1.5,
                   label=rf'$\theta = {θ}$, $\mathcal{{M}} = {M:.1f}$')
    axes[1].semilogx(t, np.sqrt(t) * sd, color=f'C{k}', lw=1.2,
                     label=rf'$\theta = {θ}$')

M_half = -1 / (1 + 0.5**2)                     # M at θ = 0.5
axes[1].axhline(1 / np.sqrt(-2 * M_half - 1), color='C0', ls=':', lw=1,
                label=r'$\sigma_\eta / \sqrt{-2\mathcal{M} - 1}$, $\theta = 0.5$')
axes[1].semilogx(t, np.sqrt(np.log(t)), color='C1', ls=':', lw=1,
                 label=r'$\sigma_\eta \sqrt{\log t}$')
axes[0].set_xlabel('$t$')
axes[0].set_ylabel(r'$|$mean error$| \,/\, \theta U^*$')
axes[0].set_title('mean error: 200 paths (solid), exact (dashed)', fontsize=10)
axes[0].legend(fontsize=9)
axes[1].set_xlabel('$t$')
axes[1].set_ylabel(r'$\sqrt{t}\ \times$ sd of $x_t$')
axes[1].set_ylim(0, 8)
axes[1].legend(fontsize=9)
plt.tight_layout()
plt.show()
θ = 0.5:  M = -0.80,  slope of exact mean -0.800,  slope of 200-path mean -1.057
         exact mean below 2 Monte Carlo standard errors from t = 43
         at t = 3000: mean error -0.000, sd 0.024, share of paths below Nash 0.43
θ = 1.0:  M = -0.50,  slope of exact mean -0.500,  slope of 200-path mean -0.505
         at t = 3000: mean error -0.050, sd 0.056, share of paths below Nash 0.82
θ = 2.0:  M = -0.20,  slope of exact mean -0.200,  slope of 200-path mean -0.200
         at t = 3000: mean error -1.735, sd 0.322, share of paths below Nash 1.00
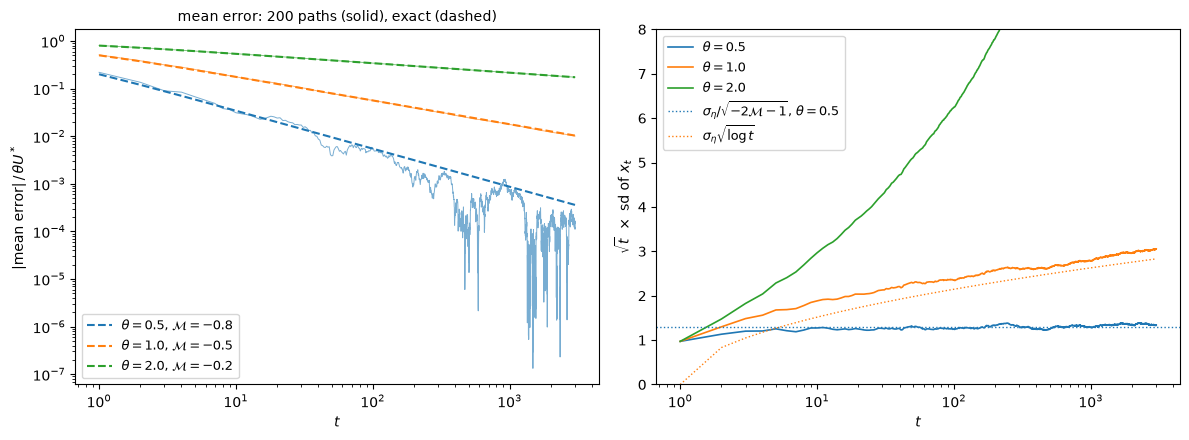
The exact mean errors fall with slopes equal to \(\mathcal{M}\): \(-0.8\), \(-0.5\), and \(-0.2\).
For \(\theta = 1\) and \(\theta = 2\) the 200-path average lies on top of the exact mean.
For \(\theta = 0.5\) it does so only for a few dozen periods.
After that the mean error is smaller than the Monte Carlo standard error, and the average is noise.
That is the first lesson: when \(\mathcal{M} < -1/2\), the initial condition is forgotten (like \(t^{-0.8}\)) faster than sampling noise dies out (like \(t^{-1/2}\)).
So convergence is limited by the noise, and \(\sqrt{t}\) times the standard deviation levels off at \(\sigma_\eta / \sqrt{-2\mathcal{M} - 1} \approx 1.29\).
When \(\mathcal{M} > -1/2\) the ranking reverses.
For \(\theta = 2\) both the mean error and the standard deviation shrink only like \(t^{-0.2}\), so \(\sqrt{t}\) times the standard deviation keeps growing, and the mean error dominates.
After 3000 periods the average \(\theta = 2\) learner is still about 1.7 points below Nash, several standard deviations away, and every one of the 200 paths is below Nash.
The \(\theta = 2\) learner does not wander around its limit: it climbs slowly, and nearly monotonically, from below.
The default \(\theta = 1\) is the boundary between the two cases.
There the mean error and the standard deviation both shrink like \(t^{-1/2}\), up to the factor \(\sqrt{\log t}\) that makes \(\sqrt{t}\) times the standard deviation creep upward.
Exercise 98.2
Replace the decreasing gain \(1/(t-1)\) in (98.5) by a constant gain \(\varepsilon \in (0, 1)\), so that \(x_{t+1} = x_t + \varepsilon (y_t - x_t)\).
This is the adaptive-expectations rule of Adaptive Expectations and the Phelps Problem with \(\varepsilon = 1 - \lambda\), but here the government keeps best-responding one period at a time.
Show that \(e_t = x_t - y^N\) is a first-order autoregression with coefficient \(1 + \varepsilon \mathcal{M}\). Show that, when it is stationary, its variance is
\[ V(\varepsilon) = \frac{\varepsilon \sigma_\eta^2}{(1 - h')\bigl(2 - \varepsilon (1 - h')\bigr)}, \qquad h' = \frac{\theta^2}{1 + \theta^2} . \]This is the formula of Exercise 90.5 for Bray’s market, with \(h' = B'\). For which gains is the recursion stable?
With \(\theta = 1\) and \(\sigma_\eta = 1\), use the option
εofls_learningto simulate 100,000 periods for \(\varepsilon \in \{0.01, 0.025, 0.05, 0.1, 0.2\}\). Drop the first 5,000 periods, and compare the sample variance of \(e_t\) with \(V(\varepsilon)\).Plot 3000 periods of \(x_t\) under \(\varepsilon = 0.025\) and under the least squares gain, using the same shocks. What does a constant gain buy, and what does it cost?
Solution
Because \(B(x) - x = \mathcal{M}(x - y^N)\), the update gives \(e_{t+1} = (1 + \varepsilon \mathcal{M})\, e_t + \varepsilon \eta_t\).
With \(\rho = 1 + \varepsilon\mathcal{M} = 1 - \varepsilon(1 - h')\), the autoregression is stable when \(|\rho| < 1\), that is, when \(\varepsilon < 2/(1 - h') = 2(1 + \theta^2)\), which every gain below one satisfies.
Its variance is \(\varepsilon^2 \sigma_\eta^2 / (1 - \rho^2)\), and \(1 - \rho^2 = \varepsilon (1 - h')\bigl(2 - \varepsilon(1 - h')\bigr)\) gives the formula.
For small gains \(V(\varepsilon) \approx \varepsilon \sigma_\eta^2 / (2|\mathcal{M}|)\), which equals \(\varepsilon\) when \(\theta = \sigma_\eta = 1\).
cm_1 = CredibilityModel(θ=1.0, U_star=5.0)
h_prime = cm_1.θ**2 / (1 + cm_1.θ**2)

print("   ε     sample variance    V(ε)    variance / ε")
for ε in (0.01, 0.025, 0.05, 0.1, 0.2):
    x_ε, _ = ls_learning(cm_1, T=100_000, seed=3, ε=ε)
    e_ε = x_ε[5_000:] - cm_1.nash()
    V = ε / ((1 - h_prime) * (2 - ε * (1 - h_prime)))
    print(f"{ε:6.3f}   {e_ε.var():12.5f}   {V:10.5f}   {e_ε.var() / ε:9.3f}")
   ε     sample variance    V(ε)    variance / ε
 0.010        0.00968      0.01003       0.968
 0.025        0.02513      0.02516       1.005
 0.050        0.05054      0.05063       1.011
 0.100        0.10223      0.10256       1.022
 0.200        0.20959      0.21053       1.048
The sample variances match the formula, and the variance is nearly proportional to the gain.
The figure compares a constant gain with the least squares gain on the same shocks.
x_c, _ = ls_learning(cm_1, T=3000, seed=4, ε=0.025)
x_ls, _ = ls_learning(cm_1, T=3000, seed=4)
band = 2 * np.sqrt(0.025 / ((1 - h_prime) * (2 - 0.025 * (1 - h_prime))))

fig, ax = plt.subplots(figsize=(9, 4.5))
ax.plot(x_c, 'C1', lw=0.8, label=r'constant gain $\varepsilon = 0.025$')
ax.plot(x_ls, 'C0', lw=1.2, label='least squares gain $1/t$')
ax.axhline(cm_1.nash(), color='k', ls='--', lw=1, label='Nash $y^N$')
ax.fill_between(np.arange(3001), cm_1.nash() - band, cm_1.nash() + band,
                color='C1', alpha=0.15, label=r'$y^N \pm 2\sqrt{V(\varepsilon)}$')
ax.set_xlabel('$t$')
ax.set_ylabel('expected inflation $x_t$')
ax.legend(fontsize=9)
plt.show()
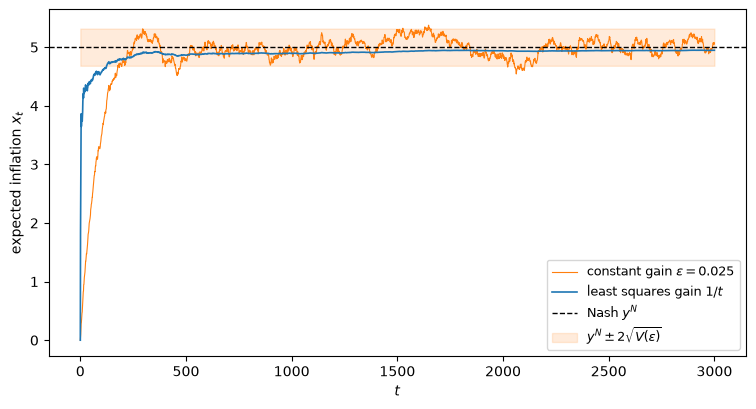
A constant gain buys a faster rate of forgetting.
The constant-gain learner forgets its initial condition geometrically, at rate \(1 - \varepsilon(1 - h')\) per period.
The least squares learner moves faster at first, because its gain \(1/t\) exceeds \(0.025\) for the first 40 periods.
But its mean error then shrinks only like \(t^{-1/2}\), as Exercise 98.1 showed, and after a few hundred periods it is larger than the constant-gain learner’s.
The cost is that the constant-gain learner never settles.
It converges only in distribution, to a cloud around \(y^N\) whose variance is proportional to the gain.
In this scalar model the cloud is all that happens, because the mean dynamics pull \(x\) straight back toward \(y^N\) and there is nowhere else to go.
In Adaptive Learning and Escape Dynamics the government’s beliefs are a whole vector of Phillips-curve coefficients, learned with the same gain \(0.025\).
There the noise can push beliefs along a path that leads toward the Ramsey outcome, and the mean dynamics then pull them back toward Nash.
These are the recurrent escapes of Sargent [1999] and Cho et al. [2002].
Exercise 98.3
This exercise studies the inflation bias \(y^N - y^R\) and two remedies discussed in Remedies.
Replace the government’s payoff (98.1) by \(-\frac{1}{2}\left[(U - k U^*)^2 + \alpha y^2\right]\), with \(k \in [0, 1]\) and \(\alpha > 0\).
The lecture’s case is \(k = 0\), \(\alpha = 1\).
Show that the best response is \(B(x) = [\theta(1 - k) U^* + \theta^2 x] / (\theta^2 + \alpha)\) and that Nash inflation is \(y^N = \theta (1 - k) U^* / \alpha\). Check the formula by iterating the best response.
Alan Blinder’s remedy is an authority who knows the natural rate and never wants unemployment to differ from it (\(k = 1\)). Rogoff [1985]’s remedy is a conservative central banker who weights inflation more heavily than society does (\(\alpha > 1\)). What does each do to the inflation bias?
Now let the Phillips curve be \(U = U^* - \theta(y - x) + \zeta\). Here \(\zeta\) is an IID shock with mean zero and variance \(\sigma_\zeta^2\), which the policymaker sees before setting \(y\) but the public does not see when it forms \(x\). Show that in the Nash equilibrium \(x = \theta(1-k)U^*/\alpha\), \(y = x + \theta\zeta/(\theta^2 + \alpha)\), and \(U = U^* + \alpha \zeta / (\theta^2 + \alpha)\).
Society keeps the payoff (98.1). Set \(\theta = 1\) and \(U^* = 5\). For a Rogoff banker (\(k = 0\)) and \(\sigma_\zeta \in \{1, 2.5, 5\}\), plot society’s expected loss \(\frac{1}{2} E(U^2 + y^2)\) against \(\alpha\) and find the best \(\alpha\). Compare with Blinder’s authority (\(k = 1\), \(\alpha = 1\)).
Solution
1. The first-order condition is \(\theta\left[(1-k)U^* - \theta(y - x)\right] = \alpha y\), which gives \(B(x)\).
Setting \(x = B(x)\) gives \(\alpha y^N = \theta(1-k)U^*\).
Because the slope \(\theta^2/(\theta^2 + \alpha)\) of \(B\) is less than one, best response dynamics converge to \(y^N\), which lets us check the formula.
def B_general(x, θ, U_star, k, α):
    "Best response of a policymaker with payoff -[(U - k U*)^2 + α y^2]/2."
    return (θ * (1 - k) * U_star + θ**2 * x) / (θ**2 + α)


θ_b, U_b = 1.0, 5.0
for k, α in [(0, 1), (0, 2), (0, 5), (0.5, 1), (1, 1)]:
    y = 0.0
    for _ in range(2000):
        y = B_general(y, θ_b, U_b, k, α)
    print(f"k = {k:3}, α = {α}:  iterated best response {y:.4f},  "
          f"θ(1-k)U*/α = {θ_b * (1 - k) * U_b / α:.4f}")
k =   0, α = 1:  iterated best response 5.0000,  θ(1-k)U*/α = 5.0000
k =   0, α = 2:  iterated best response 2.5000,  θ(1-k)U*/α = 2.5000
k =   0, α = 5:  iterated best response 1.0000,  θ(1-k)U*/α = 1.0000
k = 0.5, α = 1:  iterated best response 2.5000,  θ(1-k)U*/α = 2.5000
k =   1, α = 1:  iterated best response 0.0000,  θ(1-k)U*/α = 0.0000
2. Both remedies leave unemployment at the natural rate, which is all any policymaker can achieve on average, so what they change is inflation.
Blinder’s authority (\(k = 1\)) eliminates the bias altogether: it has no reason to push unemployment below \(U^*\), and \(y^N = 0\) is the Ramsey outcome.
Rogoff’s banker shrinks the bias in proportion to \(1/\alpha\), and eliminates it only as \(\alpha \to \infty\).
3. With the shock, the first-order condition becomes \(\theta\left[(1-k)U^* + \zeta - \theta(y - x)\right] = \alpha y\).
Taking expectations, and using \(x = E y\), gives \(x = \theta(1-k)U^*/\alpha\); subtracting gives \(y - x = \theta \zeta / (\theta^2 + \alpha)\).
Then \(U = U^* + \zeta - \theta(y - x) = U^* + \alpha\zeta/(\theta^2 + \alpha)\).
A more conservative banker offsets less of the shock, so a larger \(\alpha\) makes unemployment more variable and inflation less variable.
4. Society’s expected loss is
The middle term is the inflation bias and the last term is the cost of the shocks.
The bias term falls with \(\alpha\).
The shock term is smallest at \(\alpha = 1\), where it equals \(\sigma_\zeta^2/(1 + \theta^2)\), and it rises toward \(\sigma_\zeta^2\) as \(\alpha \to \infty\).
That is Rogoff’s tradeoff.
def society_loss(α, k, σ_ζ, θ=θ_b, U_star=U_b):
    "Society's expected loss (1/2) E(U^2 + y^2) when an authority (k, α) sets y."
    bias = θ * (1 - k) * U_star / α
    return 0.5 * (U_star**2 + bias**2
                  + σ_ζ**2 * (α**2 + θ**2) / (θ**2 + α)**2)


α_grid = np.geomspace(1, 100, 4001)
fig, ax = plt.subplots(figsize=(8, 4.5))
for j, σ_ζ in enumerate([1.0, 2.5, 5.0]):
    loss = society_loss(α_grid, 0, σ_ζ) - 0.5 * U_b**2
    i = loss.argmin()
    blinder = society_loss(1.0, 1, σ_ζ) - 0.5 * U_b**2
    ax.plot(α_grid, loss, color=f'C{j}', label=rf'Rogoff, $\sigma_\zeta = {σ_ζ}$')
    ax.plot(α_grid[i], loss[i], 'o', color=f'C{j}')
    ax.axhline(blinder, color=f'C{j}', ls=':', lw=1)
    print(f"σ_ζ = {σ_ζ}:  best α = {α_grid[i]:.2f},  excess loss there {loss[i]:.3f};"
          f"  at α = 1 {loss[0]:.3f};  Blinder {blinder:.3f}")
ax.set_xscale('log')
ax.set_xlabel(r"banker's weight on inflation $\alpha$")
ax.set_ylabel(r'expected loss minus $U^{*2}/2$')
ax.legend(fontsize=9)
plt.show()
σ_ζ = 1.0:  best α = 28.71,  excess loss there 0.483;  at α = 1 12.750;  Blinder 0.250
σ_ζ = 2.5:  best α = 6.97,  excess loss there 2.697;  at α = 1 14.062;  Blinder 1.562
σ_ζ = 5.0:  best α = 3.24,  excess loss there 9.185;  at α = 1 18.750;  Blinder 6.250
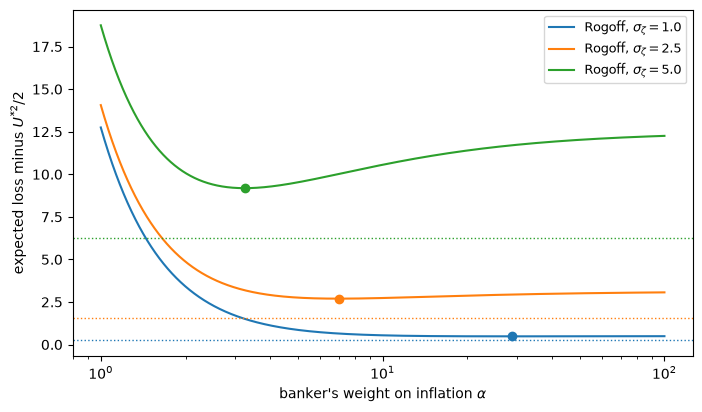
The dotted lines are Blinder’s authority.
For each \(\sigma_\zeta\) the best Rogoff banker is more conservative than society (\(\alpha > 1\)) but not infinitely so, and the noisier the economy, the less conservative the best banker.
Blinder’s authority beats every Rogoff banker.
It removes the bias without distorting stabilization: its loss, \(\frac{1}{2}\left[U^{*2} + \sigma_\zeta^2/(1 + \theta^2)\right]\), is what society would get by committing to the best state-contingent rule \(y = \theta\zeta/(1+\theta^2)\).
The reason is that \(-\frac{1}{2}(U - U^*)^2\) differs from \(-\frac{1}{2}U^2\) by a term that is linear in \(U\), and that linear term is the whole source of the temptation to inflate.