100. Adaptive Expectations and the Phelps Problem#
In addition to what’s in Anaconda, this lecture will use the following library:
!pip install quantecon
100.1. Overview#
They cannot look out far. They cannot look in deep. But when was that ever a bar To any watch they keep?
– Robert Frost
This lecture continues the study of Phillips curve tradeoffs begun in The Credibility Problem.
It follows chapter 5 of Sargent [1999].
Credible Government Policies pursued better-than-Nash outcomes while keeping everyone rational, and found too many of them: a continuum of sustainable values, with nothing inside the theory to choose among them.
Here we retreat from that perfection in the smallest way we can, by keeping the government rational and giving the public a mechanical forecasting rule.
We describe
the Cagan-Friedman adaptive expectations hypothesis,
how Phelps [1967] used it to formulate a government control problem,
the sacrifice ratio that the hypothesis implies, and
the role of adaptive expectations in early econometric tests of the natural-rate hypothesis, and the rational expectations critique of those tests.
The key object is the Phelps problem: a government that is rational solves an optimal control problem while the public forecasts inflation with a fixed, mechanical adaptive rule.
Unlike the one-period model of The Credibility Problem, the government now takes into account that the economy lasts more than one period, and that today’s inflation shapes tomorrow’s expectations.
This intertemporal link can improve outcomes and, in a limiting case, even sustain the Ramsey outcome.
The Phelps problem is a linear-quadratic (LQ) control problem, so we solve it with the LQ control tools from QuantEcon.
Let’s start with some imports:
import matplotlib.pyplot as plt
import numpy as np
import quantecon as qe
from scipy.signal import lfilter
100.2. Adaptive expectations#
Phelps [1967] formulated a control problem for a natural-rate model.
He dropped rationality for the public but not for the government, and assigned the public a particular mechanical forecasting rule that is known to the government.
The public uses the adaptive expectations scheme of Milton Friedman and Cagan [1956] (see Monetarist Theory of Price Levels with Adaptive Expectations for Cagan’s own use of it):
where \(x_t\) is the public’s expectation of inflation and \(y_t\) is inflation.
Rearranging, \(x_t = \lambda x_{t-1} + (1 - \lambda) y_{t-1}\), so expected inflation is a geometric distributed lag of past inflation,
Notice that (100.1) is a constant gain version of the least squares learning algorithm from The Credibility Problem, with the constant \((1 - \lambda)\) playing the role that the decreasing gain \(t^{-1}\) played there.
It is also the relaxation algorithm of From relaxation to learning: Bray’s market, run in calendar time with gain \(1 - \lambda\).
Note
Here \(\lambda\) is the weight on the old forecast, so the gain is \(1 - \lambda\).
The Bounded Rationality lectures write the gain itself as \(\lambda\) (Notation across the series), and Optimal Misspecified Beliefs and Self-Confirming Equilibria write it as \(C = 1 - \lambda\).
Equation (100.2) possesses what Cho and Matsui [1995] call an induction property: if the government keeps repeating a constant \(y_t = \tilde y\) policy, eventually the public comes to set \(x_t \approx \tilde y\).
The weights \((1 - \lambda)\lambda^{i-1}\) sum to one, so a permanently maintained inflation rate is eventually expected.
Let’s confirm the induction property numerically.
def adaptive_forecast(y, λ, x0=0.0):
    "Simulate x_t = λ x_{t-1} + (1-λ) y_{t-1}."
    T = len(y)
    x = np.empty(T)
    x[0] = x0
    for t in range(1, T):
        x[t] = λ * x[t - 1] + (1 - λ) * y[t - 1]
    return x

T = 60
y_const = np.full(T, 10.0)                 # a constant inflation policy

fig, ax = plt.subplots(figsize=(9, 4.5))
for λ in [0.7, 0.9]:
    x = adaptive_forecast(y_const, λ)
    ax.plot(x, lw=1.5, label=rf'$\lambda = {λ}$')
ax.axhline(10.0, color='k', ls='--', lw=1, label='policy $\\tilde y$')
ax.set_xlabel('$t$')
ax.set_ylabel('expected inflation $x_t$')
ax.legend()
plt.show()
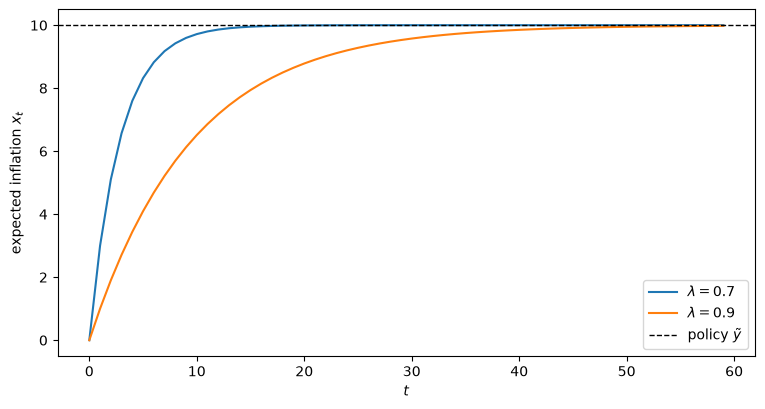
Fig. 100.1 Adaptive expectations converge to a constant inflation policy: the induction property#
Under a constant policy the public’s expectation converges to the policy, more slowly the larger is \(\lambda\).
Solow and Tobin exploited this induction property when they tested the natural-rate hypothesis, as we discuss below.
100.3. The Phelps problem#
The economy repeats forever, and the government evaluates outcome sequences with the discounted criterion
When \(\delta = 1\) we interpret (100.3) in the limit-of-means (Cesàro) sense.
Under that criterion only the limit of the outcome sequence matters, so every path that drives \(y_t\) to \(0\) is optimal and the transition path is not pinned down.
The \(\delta = 1\) results below are therefore limits as \(\delta \uparrow 1\): the code sets \(\beta = 1 - 10^{-7}\), and the rule barely changes as that number shrinks further.
The government maximizes (100.3) by choice of a rule for inflation \(y_t\), subject to the adaptive expectations scheme (100.1) and the expectations-augmented Phillips curve
Because expected inflation \(x_t\) is predetermined at the start of period \(t\), it is the only endogenous state variable.
The government’s problem is therefore a discounted LQ control problem with
state \(s_t = \begin{bmatrix} 1 & x_t \end{bmatrix}^\top\),
control \(y_t\), and
transition \(x_{t+1} = \lambda x_t + (1 - \lambda) y_t\).
100.3.1. Casting the problem in LQ form#
Write \(U_t = a^\top s_t - \theta y_t\) with \(a = \begin{bmatrix} U^* & \theta \end{bmatrix}^\top\).
The per-period loss \(\tfrac{1}{2}(U_t^2 + y_t^2)\) then equals
Matching this to the QuantEcon LQ loss \(s_t^\top R s_t + y_t^\top Q y_t + 2 y_t^\top N s_t\) (see Eliminating Cross Products for how such cross products are handled), and matching the transition to \(s_{t+1} = A s_t + B y_t\), gives
The discount factor is \(\beta = \delta\); the scaling \((1 - \delta)\) in (100.3) does not affect the optimal policy.
class PhelpsProblem:
    """
    The Phelps optimal-control problem: a rational government facing a
    public that forecasts inflation adaptively with parameter λ.
    """

    def __init__(self, θ=1.0, U_star=5.0, λ=0.7, δ=0.96):
        self.θ, self.U_star, self.λ, self.δ = θ, U_star, λ, δ

        a = np.array([[U_star], [θ]])
        R = 0.5 * (a @ a.T)
        Q = np.array([[0.5 * (θ**2 + 1)]])
        N = -0.5 * θ * a.T
        A = np.array([[1.0, 0.0], [0.0, λ]])
        B = np.array([[0.0], [1 - λ]])

        # δ = 1 (limit of means) is handled as the limit δ → 1
        β = min(δ, 1 - 1e-7)
        self.lq = qe.LQ(Q, R, A, B, N=N, beta=β)
        P, F, d = self.lq.stationary_values()

        # optimal rule y_t = f1 + f2 x_t
        self.f1, self.f2 = -F[0, 0], -F[0, 1]

    def simulate(self, x0=12.0, T=60):
        "Disinflation path (U_t, y_t) starting from expectation x0."
        θ, U_star, λ = self.θ, self.U_star, self.λ
        U, y, x = np.empty(T), np.empty(T), x0
        for t in range(T):
            y[t] = self.f1 + self.f2 * x
            U[t] = U_star - θ * (y[t] - x)
            x = λ * x + (1 - λ) * y[t]
        return U, y
The optimal rule takes the form \(y_t = f_1 + f_2 x_t\) with \(f_1 \neq 0\) and \(f_2 \neq 1\).
These inequalities reflect that the public does not use an optimal forecasting rule; if instead \(f_1 = 0\) and \(f_2 = 1\), we would have \(y_t = x_t\) for all histories.
pp = PhelpsProblem(θ=1.0, U_star=5.0, λ=0.7, δ=0.96)
print(f"optimal rule:  y_t = {pp.f1:.3f} + {pp.f2:.3f} x_t")
optimal rule: y_t = 0.406 + 0.334 x_t
100.3.2. A proposition#
The reason the Phelps problem is interesting is the following result.
Proposition 100.1 (δ = 1 eventually sustains Ramsey)
In the absence of discounting (\(\delta = 1\)), the government drives \(y_t\) to \(0\), the Ramsey outcome.
When \(\delta = 1\), \(\lambda\) governs the speed of convergence to the Ramsey outcome.
When \(\delta < 1\), the limit point of \(y_t\) depends on a comparison of \(\lambda\) with \(\delta\), which we can make exact.
Let \(q_t\) denote the marginal value to the government of expected inflation \(x_t\).
The first-order condition for \(y_t\) and the envelope condition for \(x_t\) are
In a steady state \(x = y\), so \(U = U^*\) and \(q = -\theta U^* / (1 - \delta\lambda)\), and the first-order condition gives
The formula has a marginal interpretation.
A permanent one-point cut in inflation from the steady state lowers the inflation loss by \(y_\infty\) every period, a discounted benefit of \(y_\infty/(1-\delta)\).
It also raises unemployment by \(\theta\lambda^t\) in period \(t\), while expectations catch up, and each point of unemployment costs about \(U^*\) at the margin, a discounted cost of \(\theta U^*/(1 - \delta\lambda)\).
Equating the two gives (100.5).
Because \(1 - \delta\lambda = (1 - \delta) + \delta(1 - \lambda)\), steady-state inflation is a fraction \((1 - \delta) / [(1 - \delta) + \delta(1 - \lambda)]\) of the Nash rate \(\theta U^*\).
It is close to the Ramsey value \(0\) only when the government’s impatience \(1 - \delta\) is small relative to the public’s gain \(1 - \lambda\).
That is what chapter 5 of Sargent [1999] means by \(\lambda \ll \delta\) with \(\delta\) close to one.
It is not enough that \(\lambda < \delta\): with \(\lambda = 0.98\) and \(\delta = 0.99\), formula (100.5) gives \(y_\infty \approx 0.34\, \theta U^*\).
The public’s expectations are wrong along the transition path but are correct in the steady state, by virtue of the induction property.
The steady state of the rule \(y_t = f_1 + f_2 x_t\) is \(f_1 / (1 - f_2)\), so we can check (100.5) against the LQ solution.
for λ, δ in [(0.7, 0.96), (0.9, 0.96), (0.7, 0.99), (0.98, 0.99)]:
    pp = PhelpsProblem(λ=λ, δ=δ)
    y_lq = pp.f1 / (1 - pp.f2)
    y_cf = pp.θ * pp.U_star * (1 - δ) / (1 - δ * λ)
    print(f"λ = {λ}, δ = {δ}:  LQ steady state = {y_lq:.4f},  formula = {y_cf:.4f}")
λ = 0.7, δ = 0.96:  LQ steady state = 0.6098,  formula = 0.6098
λ = 0.9, δ = 0.96:  LQ steady state = 1.4706,  formula = 1.4706
λ = 0.7, δ = 0.99:  LQ steady state = 0.1629,  formula = 0.1629
λ = 0.98, δ = 0.99:  LQ steady state = 1.6779,  formula = 1.6779
100.4. Disinflation paths#
We now reproduce the disinflation experiments of chapter 5 of Sargent [1999].
Set \(\theta = 1\) and \(U^* = 5\), and start the government’s problem from late-1970s initial conditions \(x_{-1} = y_{-1} = 12\), which imply \(U = U^* = 5\).
The following tables record paths of unemployment \(U\) and inflation \(y\) at selected lags, for two discount factors \(\delta \in \{0.96, 1\}\) and two adaptation parameters \(\lambda \in \{0.7, 0.9\}\).
def disinflation_table(δ, lags=(1, 5, 20, 50)):
    rows = []
    for λ in [0.7, 0.9]:
        U, y = PhelpsProblem(λ=λ, δ=δ).simulate(x0=12.0, T=max(lags) + 1)
        for lag in lags:
            rows.append((λ, lag, U[lag - 1], y[lag - 1]))
    return rows

for δ in [0.96, 1.0]:
    print(f"\n δ = {δ}")
    print(f" {'λ':>4} {'lag':>4} {'U':>7} {'y':>7}")
    for λ, lag, U, y in disinflation_table(δ):
        print(f" {λ:>4} {lag:>4} {U:>7.2f} {y:>7.2f}")
 δ = 0.96
    λ  lag       U       y
  0.7    1   12.59    4.41
  0.7    5    8.11    2.17
  0.7   20    5.11    0.66
  0.7   50    5.00    0.61
  0.9    1   11.87    5.13
  0.9    5   10.24    4.27
  0.9   20    6.91    2.49
  0.9   50    5.25    1.61

 δ = 1.0
    λ  lag       U       y
  0.7    1   13.21    3.79
  0.7    5    8.28    1.51
  0.7   20    5.10    0.05
  0.7   50    5.00    0.00
  0.9    1   13.40    3.60
  0.9    5   11.28    2.70
  0.9   20    7.12    0.91
  0.9   50    5.24    0.10
For each parameter setting the government engineers a major recession and immediately brings inflation down more than halfway toward its eventual limiting value.
In the discounted case (\(\delta = 0.96\)), inflation settles at the positive level \(y_\infty\) of (100.5), and the government accepts a longer but milder recession when \(\lambda = 0.9\) than when \(\lambda = 0.7\).
In the undiscounted case (\(\delta = 1\)), inflation is driven all the way to the Ramsey value of zero, more slowly the larger is \(\lambda\).
Let’s plot the full paths, with the inherited inflation rate of 12 shown at \(t = 0\).
T = 40
t = np.arange(T + 1)
fig, axes = plt.subplots(2, 2, figsize=(11, 7), sharex=True)

for j, δ in enumerate([0.96, 1.0]):
    for λ in [0.7, 0.9]:
        U, y = PhelpsProblem(λ=λ, δ=δ).simulate(x0=12.0, T=T)
        axes[0, j].plot(t, np.concatenate([[12.0], y]), lw=1.5,
                        label=rf'$\lambda = {λ}$')
        axes[1, j].plot(t, np.concatenate([[5.0], U]), lw=1.5,
                        label=rf'$\lambda = {λ}$')
    axes[0, j].set_title(rf'$\delta = {δ}$')
    axes[0, j].set_ylabel('inflation $y_t$')
    axes[1, j].axhline(5.0, color='k', ls=':', lw=1)
    axes[1, j].set_ylabel('unemployment $U_t$')
    axes[1, j].set_xlabel('period ($t = 0$: inherited $y = 12$)')
    axes[0, j].legend()

plt.tight_layout()
plt.show()
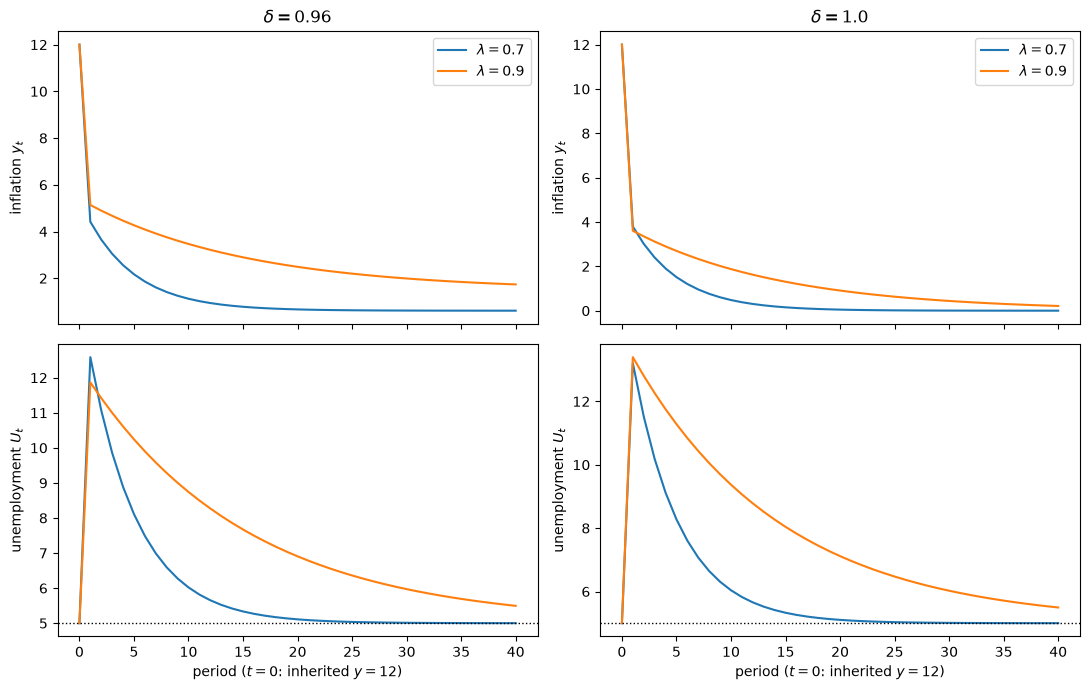
Fig. 100.2 Optimal disinflation paths from the Phelps problem, discounted and undiscounted#
The undiscounted problem drives inflation to the Ramsey outcome; the discounted problem stops short of it.
In both, the government buys its immediate disinflation with a recession: unemployment jumps far above \(U^*\) in the first period and returns to \(U^*\) as expectations catch up.
100.5. The general Phelps problem#
For the government’s control problem, what matters is the reduced form of the Phillips curve, not the underlying structure that identifies \(x_t\).
It is useful to state a more general version of the Phelps problem in which the government’s model is a reduced-form distributed lag Phillips curve.
Following Sargent [1999], define the vectors
and \(X_{t-1} = \begin{bmatrix} X_{U,t-1}^\top & X_{y,t-1}^\top & 1 \end{bmatrix}^\top\), which collects information dated \(t-1\) and earlier.
\(X_{t-1}\) is the state vector of the general Phelps problem.
We can write two reduced-form Phillips curves that differ only in their direction of fit:
The subscripts \(C\) and \(K\) stand for Classical (regress \(U\) on \(y\)) and Keynesian (regress \(y\) on \(U\)).
The general Phelps problem is to choose a control law \(\hat y_t = h X_{t-1}\) to maximize the expected value of (100.3) subject to the government’s believed Phillips curve and to \(y_t = \hat y_t + v_{2t}\), where \(v_{2t}\) is a control error.
This induces a mapping from the government’s beliefs \(\gamma\) to its decision rule \(h\):
These objects — \(\gamma\), \(\beta\), \(h(\gamma)\), and the two directions of fit — are exactly the ingredients we will need to define self-confirming equilibria in Self-Confirming Equilibria.
100.5.1. The adaptive case in general form#
The specific problem solved above is the special case in which \(\gamma\) is restricted by substituting the adaptive expectations hypothesis (100.1) into the Phillips curve (100.4).
To find the restriction, use (100.4) at \(t-1\) to write \(x_{t-1} = y_{t-1} + (U_{t-1} - U^*)/\theta\), substitute it into (100.1), and substitute the result into (100.4):
This is a classical Phillips curve with one lag of each variable (\(m_U = m_y = 1\)) and coefficients \(\gamma = \begin{bmatrix} -\theta & \lambda & \theta & (1 - \lambda) U^* \end{bmatrix}^\top\) on \(X_{C,t} = \begin{bmatrix} y_t & U_{t-1} & y_{t-1} & 1 \end{bmatrix}^\top\).
Once that substitution is made, the state variable \(x_t\) disappears from view.
The induction hypothesis is visible in (100.7): the weights on current and lagged inflation sum to \(-\theta + \theta = 0\).
Solved for \(y_t\), (100.7) becomes the Keynesian curve \(y_t = y_{t-1} + \theta^{-1}\left[(1 - \lambda) U^* + \lambda U_{t-1} - U_t\right]\), with a weight of exactly one on lagged inflation.
Because \(x_t = y_{t-1} + \lambda (U_{t-1} - U^*)/\theta\), the rule \(y_t = f_1 + f_2 x_t\) of the original problem is, in terms of \(X_{t-1} = \begin{bmatrix} U_{t-1} & y_{t-1} & 1 \end{bmatrix}^\top\),
Let’s confirm this by solving the general Phelps problem directly.
With state \(X_{t-1}\), control \(y_t\), and a believed curve \(U_t = \gamma_y y_t + c^\top X_{t-1}\), where \(\gamma_y\) is the coefficient on \(y_t\) and \(c\) collects the rest, the problem is again an LQ problem.
Adaptive Learning and Escape Dynamics solves the same problem, with two lags of each variable, for a government that re-estimates \(\gamma\) every period.
def phelps_general(γ, δ):
    """
    Solve the general Phelps problem for the believed classical curve
    U_t = γ[0] y_t + γ[1] U_{t-1} + γ[2] y_{t-1} + γ[3].
    Returns h, with ŷ_t = h @ [U_{t-1}, y_{t-1}, 1].
    """
    γ_y = γ[0]
    c = np.asarray(γ[1:], dtype=float).reshape(-1, 1)
    R = 0.5 * (c @ c.T)
    Q = np.array([[0.5 * (γ_y**2 + 1)]])
    N = 0.5 * γ_y * c.T
    A = np.vstack([c.T, [0.0, 0.0, 0.0], [0.0, 0.0, 1.0]])  # next state (U_t, y_t, 1)
    B = np.array([[γ_y], [1.0], [0.0]])
    lq = qe.LQ(Q, R, A, B, N=N, beta=min(δ, 1 - 1e-7))
    P, F, d = lq.stationary_values()
    return -F[0]

θ, U_star, λ, δ = 1.0, 5.0, 0.7, 0.96
γ_adaptive = np.array([-θ, λ, θ, (1 - λ) * U_star])
pp = PhelpsProblem(θ=θ, U_star=U_star, λ=λ, δ=δ)

h_general = phelps_general(γ_adaptive, δ)
h_from_x = np.array([pp.f2 * λ / θ, pp.f2, pp.f1 - pp.f2 * λ * U_star / θ])
print("h from the general problem:  ", h_general.round(4))
print("h from the x-state rule:     ", h_from_x.round(4))
h from the general problem:   [ 0.2338  0.334  -0.7628]
h from the x-state rule:      [ 0.2338  0.334  -0.7628]
The two agree: the original Phelps problem is the general one with \(\gamma\) restricted by (100.7).
Note
The induction hypothesis is the restriction that, in the Keynesian Phillips curve \(y_t = \beta^\top X_{K,t} + \varepsilon_{K,t}\), the weights on lagged \(y\)’s sum to unity (equivalently, in the classical form the weights on current and lagged \(y\)’s sum to zero).
Under adaptive expectations this holds because the weights in (100.2) sum to one, as (100.7) shows.
100.6. Testing the natural-rate hypothesis#
Robert Solow and James Tobin [Solow, 1968, Tobin, 1968] exploited the induction hypothesis to test the natural-rate hypothesis.
Substituting the geometric distributed lag (100.2) into an inverted Phillips curve gives
They proposed to test the natural-rate hypothesis by running the regression
and interpreting a finding of \(b_1 < 1\) as evidence of a long-run tradeoff between inflation and unemployment.
In a steady state with constant inflation, (100.10) implies the long-run slope \(dU/dy = (1 - b_1)/b_2\), which equals \(\theta(b_1 - 1)\) when \(b_2\) takes its value \(-1/\theta\) from (100.9).
Early implementations found \(b_1 < 1\) and so rejected the natural-rate hypothesis in favor of a long-run tradeoff.
Later implementations of the same tests failed to reject it.
Lucas [1972] and Sargent [1971] argued that the rejections did not bear on the natural-rate hypothesis.
Solow and Tobin had deduced the restriction \(b_1 = 1\) by using the induction hypothesis to identify expected inflation.
But the induction hypothesis describes one particular experiment, a permanent and fixed inflation rate, which may be very unlikely under the stochastic process that actually governs inflation in the sample.
Under rational expectations, the weights that link expected to past inflation are restricted by that process, and they need not sum to one.
For example, suppose that inflation is a stationary AR(1) process with root \(\rho\), that \(x_t = \mathbb{E}_{t-1} y_t\), and that the natural-rate Phillips curve holds.
Then the population regression (100.10) delivers
a “rejection” of a hypothesis that is true (Exercise 100.2 derives the formula and checks it by simulation).
The estimate approaches one as \(\rho \to 1\).
According to an argument of Sargent [1971] and King and Watson [1994], this is why the pattern of rejections and non-rejections is consistent with the tendency of inflation to have a unit root after the 1960s but not before: the unit-sum restriction \(b_1 = 1\) is compatible with rational expectations when \(y_t\) has a unit root.
The self-confirming equilibria of Self-Confirming Equilibria give another illustration: rational expectations and the natural-rate hypothesis both hold there, and the induction hypothesis fails.
From the viewpoint of Phelps’s control problem, it is incidental whether the natural-rate hypothesis holds: the Phelps problem imparts interesting dynamics to the inflation-unemployment choice whether or not \(b_1 = 1\).
The public’s expectations themselves disappear from the problem; what matters is the zero-frequency behavior of the distributed lag of \(y\) in (100.10).
100.7. Sacrifice ratios and the subversion of the Phelps model#
Large sacrifice ratios — estimated amounts of foregone output required to bring inflation down one percentage point — circulated widely in the late 1970s.
The adaptive model delivers a sacrifice ratio in a simple exact form.
100.7.1. The sacrifice ratio#
Summing over \(t = 1, \ldots, T\) telescopes the right side:
Cumulative excess unemployment per point of reduction in expected inflation is therefore \(\theta / (1 - \lambda)\), for any policy path and whatever the government’s discount factor.
Because expected and actual inflation coincide in a steady state, this is also the cost of each point of permanent disinflation.
The government cannot change the ratio.
It can choose only how far to disinflate and how to spread the unemployment over time; with a quadratic loss it spreads it out.
With \(\theta = 1\) the ratio is \(3.33\) when \(\lambda = 0.7\) and \(10\) when \(\lambda = 0.9\).
Let’s check this along the optimal paths.
for λ in [0.7, 0.9]:
    for δ in [0.96, 1.0]:
        U, y = PhelpsProblem(λ=λ, δ=δ).simulate(x0=12.0, T=2000)
        ratio = np.sum(U - 5.0) / (12.0 - y[-1])
        print(f"λ = {λ}, δ = {δ}:  sacrifice ratio = {ratio:.3f},  "
              f"θ/(1-λ) = {1 / (1 - λ):.3f}")
λ = 0.7, δ = 0.96:  sacrifice ratio = 3.333,  θ/(1-λ) = 3.333
λ = 0.7, δ = 1.0:  sacrifice ratio = 3.333,  θ/(1-λ) = 3.333
λ = 0.9, δ = 0.96:  sacrifice ratio = 10.000,  θ/(1-λ) = 10.000
λ = 0.9, δ = 1.0:  sacrifice ratio = 10.000,  θ/(1-λ) = 10.000
Long expectations lags, \(\lambda\) near one, imply large sacrifice ratios.
100.7.2. The subversion of the Phelps model#
Despite its encouraging implications for sustaining the Ramsey outcome under the induction hypothesis, Phelps’s control problem carries a tattered past.
For a fixed \(\delta < 1\), it is always possible to find a \(\lambda\) close enough to one that high inherited inflationary expectations make the government want to avoid the Ramsey outcome.
Formula (100.5) shows why: \(y_\infty \to \theta U^*\), the Nash rate, as \(\lambda \to 1\).
The next cell fixes \(\delta = 0.96\) and lets \(\lambda\) approach one.
δ = 0.96
print(f"{'λ':>6} {'first-period y':>15} {'y_∞':>7} {'θ/(1-λ)':>9}")
for λ in [0.7, 0.9, 0.95, 0.99, 0.999]:
    pp = PhelpsProblem(λ=λ, δ=δ)
    y_first = pp.f1 + pp.f2 * 12.0
    y_inf = pp.θ * pp.U_star * (1 - δ) / (1 - δ * λ)
    print(f"{λ:>6} {y_first:>15.2f} {y_inf:>7.2f} {pp.θ / (1 - λ):>9.1f}")
     λ  first-period y     y_∞   θ/(1-λ)
   0.7            4.41    0.61       3.3
   0.9            5.13    1.47      10.0
  0.95            5.92    2.27      20.0
  0.99            7.64    4.03     100.0
 0.999            8.40    4.88    1000.0
The government still cuts inflation sharply in the first period, but it stops far short of zero, and each point of disinflation costs \(\theta / (1 - \lambda)\) points of unemployment.
In the late 1970s, models with long expectations-adjustment lags were used in this way to recommend against reducing inflation, fortifying those who advocated learning to live with high inflation.
By stressing the cross-equation restrictions of rational expectations, Lucas [1972] and Sargent [1971] argued that historical estimates of \(\lambda\) are silent about the optimal speed of disinflation: \(\lambda\) describes how expectations responded to past policy, not how they would respond to a new one.
The lesson to carry forward is that activating the induction hypothesis can eventually lead to better outcomes, but in the form that Phelps, Tobin, and Solow used it, the induction hypothesis retreats from rational expectations.
In Optimal Misspecified Beliefs and Self-Confirming Equilibria the adaptation parameter becomes an equilibrium outcome, \(C = 1 - \lambda\), chosen by the public to fit the data that its own forecasts help generate.
From Adaptive Learning and Escape Dynamics on, the government applies updating schemes like (100.1) to functions, the coefficients of its Phillips curve, rather than to numbers.
The LQ Phelps problem solved here returns in Adaptive Learning and Escape Dynamics, Escaping Nash Inflation, Priors, Escapes, and Learning Cycles, and The Lost Conquest: Fed Policy in the 2020s, where a learning government re-solves it every period.
In Adaptive Learning and Escape Dynamics, it is the drift of the government’s estimated Phillips curve toward the induction hypothesis that triggers the Volcker-like stabilizations.
100.8. Exercises#
Exercise 100.1
Formula (100.5) makes the comparison of \(\lambda\) with \(\delta\) exact.
For \(\lambda = 0.8\), compute the limiting inflation rate \(y_\infty\) (the value that \(y_t\) settles at after a long simulation) for a grid of discount factors \(\delta \in \{0.90, 0.91, \ldots, 0.99\}\), plot it against \(\delta\), and overlay (100.5).
Plot \(y_\infty / \theta U^*\) against \(\lambda \in [0, 0.999]\) for \(\delta \in \{0.9, 0.96, 0.99\}\).
For each of these \(\delta\), how small must \(\lambda\) be for \(y_\infty\) to be within 10% of the Ramsey value, that is, \(y_\infty \le 0.1\, \theta U^*\)?
Solution
δ_grid = np.arange(0.90, 0.995, 0.01)
y_sim = [PhelpsProblem(λ=0.8, δ=δ).simulate(x0=12.0, T=400)[1][-1]
         for δ in δ_grid]
y_formula = 5.0 * (1 - δ_grid) / (1 - δ_grid * 0.8)

λ_grid = np.linspace(0, 0.999, 500)

fig, axes = plt.subplots(1, 2, figsize=(11, 4.5))
axes[0].plot(δ_grid, y_sim, 'o', label='simulation')
axes[0].plot(δ_grid, y_formula, lw=2, label='formula')
axes[0].set_xlabel(r'discount factor $\delta$')
axes[0].set_ylabel(r'limiting inflation $y_\infty$')
axes[0].set_title(r'$\lambda = 0.8$')
axes[0].legend()

for δ in [0.9, 0.96, 0.99]:
    axes[1].plot(λ_grid, (1 - δ) / (1 - δ * λ_grid), lw=2,
                 label=rf'$\delta = {δ}$')
    λ_max = (1 - 10 * (1 - δ)) / δ
    print(f"δ = {δ}: y_∞ ≤ 0.1 θU* requires λ ≤ {λ_max:.3f}")
axes[1].axhline(0.1, color='k', ls=':', lw=1)
axes[1].set_xlabel(r'adaptation parameter $\lambda$')
axes[1].set_ylabel(r'$y_\infty / \theta U^*$')
axes[1].legend()
plt.tight_layout()
plt.show()
δ = 0.9: y_∞ ≤ 0.1 θU* requires λ ≤ 0.000
δ = 0.96: y_∞ ≤ 0.1 θU* requires λ ≤ 0.625
δ = 0.99: y_∞ ≤ 0.1 θU* requires λ ≤ 0.909
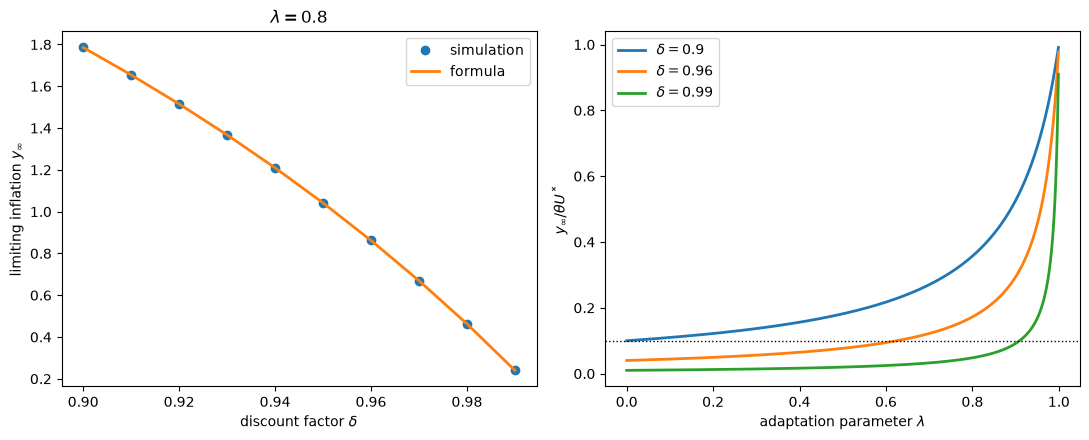
The simulated limits lie on the formula.
As \(\delta\) rises toward one, the government becomes willing to accept the transitional recession needed to reap the long-run benefit of low expected inflation, so the limiting inflation rate falls toward the Ramsey value of zero.
From (100.5), \(y_\infty \le 0.1\, \theta U^*\) requires \(1 - \delta\lambda \ge 10(1 - \delta)\), that is, \(\lambda \le [1 - 10(1 - \delta)]/\delta\).
When \(\delta = 0.9\) no \(\lambda \in (0, 1)\) qualifies, and even when \(\delta = 0.99\) the public must adapt fast enough that \(\lambda\) is below about \(0.91\).
As \(\lambda \to 1\) every curve rises to one: very slow adaptation subverts the Phelps model, whatever the discount factor.
Exercise 100.2
This exercise reproduces the Lucas–Sargent critique of the Solow–Tobin test, in the form of (100.11).
Consider an economy in which both the natural-rate hypothesis and rational expectations hold:
where \(e_t\) and \(v_{1t}\) are independent white noises with variances \(\sigma_e^2\) and \(\sigma_1^2\), and \(|\rho| < 1\).
Show that the population regression (100.10) has \(b_1 = \rho(1+\lambda)/(1+\lambda\rho)\) and \(b_2 = -\theta\sigma_e^2/(\theta^2\sigma_e^2 + \sigma_1^2)\).
Verify both by simulation, with \(\lambda = 0.7\), \(\theta = 1\), \(U^* = 5\), \(\mu = 4\), \(\sigma_e = 1\), \(\sigma_1 = 0.5\), and \(\rho \in \{0, 0.5, 0.9, 0.99\}\).
Interpret the results.
Solution
Write \(z_t = (1 - \lambda)\sum_{i \geq 1} \lambda^{i-1} y_{t-i}\) for the regressor in (100.10).
Under rational expectations \(y_t = x_t + e_t\) with \(x_t = (1 - \rho)\mu + \rho y_{t-1}\), and \(U_t - U^* = -\theta e_t + v_{1t}\).
Because \(U_t\) depends only on current shocks, it is uncorrelated with \(z_t\) and with \(x_t\), so the two slopes can be computed one at a time.
The coefficient on \(U_t\) is \(b_2 = \operatorname{cov}(e_t, U_t) / \mathbb{V}[U_t] = -\theta\sigma_e^2/(\theta^2\sigma_e^2 + \sigma_1^2)\).
The coefficient on \(z_t\) is \(b_1 = \operatorname{cov}(x_t, z_t)/\mathbb{V}[z_t] = \rho \operatorname{cov}(y_{t-1}, z_t)/\mathbb{V}[z_t]\).
With \(\gamma_0 = \mathbb{V}[y_t]\) and autocovariances \(\gamma_0 \rho^j\),
and the ratio gives \(b_1 = \rho(1 + \lambda)/(1 + \lambda\rho)\).
rng = np.random.default_rng(0)
λ, θ, U_star, μ, σ_e, σ_1, T = 0.7, 1.0, 5.0, 4.0, 1.0, 0.5, 200_000
burn = 2_000

for ρ in [0.0, 0.5, 0.9, 0.99]:
    e = σ_e * rng.standard_normal(T)
    v1 = σ_1 * rng.standard_normal(T)
    y = μ + lfilter([1.0], [1.0, -ρ], e)                  # AR(1) around μ
    U = U_star - θ * e + v1                                # y_t - x_t = e_t
    z = lfilter([0.0, 1 - λ], [1.0, -λ], y)               # (1-λ) Σ λ^{i-1} y_{t-i}
    X = np.column_stack([np.ones(T - burn), z[burn:], U[burn:]])
    b0, b1, b2 = np.linalg.lstsq(X, y[burn:], rcond=None)[0]
    print(f"ρ = {ρ:<4}:  b1 = {b1:.3f} (formula {ρ * (1 + λ) / (1 + λ * ρ):.3f}),"
          f"  b2 = {b2:.3f} (formula {-θ * σ_e**2 / (θ**2 * σ_e**2 + σ_1**2):.3f})")
ρ = 0.0 :  b1 = -0.003 (formula 0.000),  b2 = -0.799 (formula -0.800)
ρ = 0.5 :  b1 = 0.633 (formula 0.630),  b2 = -0.801 (formula -0.800)
ρ = 0.9 :  b1 = 0.940 (formula 0.939),  b2 = -0.800 (formula -0.800)
ρ = 0.99:  b1 = 0.994 (formula 0.994),  b2 = -0.800 (formula -0.800)
The estimates match the formulas.
In every case \(b_1 < 1\), so the Solow–Tobin test rejects the natural-rate hypothesis even though it is true here.
The induction hypothesis builds in weights that sum to one, but rational expectations of a stationary process do not.
As \(\rho \to 1\) the bias vanishes, which is the King–Watson reading of why later tests, run on data in which inflation had a unit root, stopped rejecting.
The coefficient \(b_2\) is the slope that a Keynesian regression of inflation on unemployment recovers.
It is the slope \(\beta_1\) of the Keynesian self-confirming equilibrium in Self-Confirming Equilibria, with \(\sigma_e\) in the role of \(\sigma_2\).
Exercise 100.3
The sacrifice ratio (100.12) does not depend on the policy.
Fix \(\delta = 0.96\) and take \(\lambda \in \{0.7, 0.9, 0.95, 0.99\}\), starting from \(x = 12\).
Compute cumulative excess unemployment per point of disinflation along the optimal path.
Do the same for a “cold turkey” policy that sets \(y_t = 0\) forever, and for a gradual policy that lowers inflation by one point per period, starting from 11, until it reaches zero.
Compare the three with \(\theta / (1 - \lambda)\), and explain why the optimal policy nonetheless differs from cold turkey.
Solution
def sacrifice_ratio(y_path, λ, θ=1.0, x0=12.0):
    "Cumulative excess unemployment per point of fall in expected inflation."
    x, excess = x0, 0.0
    for y in y_path:
        excess += -θ * (y - x)           # U_t - U*
        x = λ * x + (1 - λ) * y
    return excess / (x0 - x)

T = 5_000
δ = 0.96
for λ in [0.7, 0.9, 0.95, 0.99]:
    U, y_opt = PhelpsProblem(λ=λ, δ=δ).simulate(x0=12.0, T=T)
    y_cold = np.zeros(T)
    y_grad = np.maximum(11.0 - np.arange(T), 0.0)
    print(f"λ = {λ}:  optimal {sacrifice_ratio(y_opt, λ):6.2f},  "
          f"cold turkey {sacrifice_ratio(y_cold, λ):6.2f},  "
          f"gradual {sacrifice_ratio(y_grad, λ):6.2f},  "
          f"θ/(1-λ) = {1 / (1 - λ):6.2f}")
λ = 0.7:  optimal   3.33,  cold turkey   3.33,  gradual   3.33,  θ/(1-λ) =   3.33
λ = 0.9:  optimal  10.00,  cold turkey  10.00,  gradual  10.00,  θ/(1-λ) =  10.00
λ = 0.95:  optimal  20.00,  cold turkey  20.00,  gradual  20.00,  θ/(1-λ) =  20.00
λ = 0.99:  optimal 100.00,  cold turkey 100.00,  gradual 100.00,  θ/(1-λ) = 100.00
All three policies cost \(\theta/(1 - \lambda)\) points of unemployment per point of disinflation, as (100.12) says they must.
The policies differ in how far they disinflate and in how they spread the unemployment over time.
Cold turkey takes inflation all the way to zero, and front-loads the recession.
The optimal discounted policy stops at \(y_\infty > 0\) for the reason given after (100.5): near the steady state, the discounted benefit of the last point of disinflation, \(y_\infty/(1-\delta)\), just equals its discounted unemployment cost, \(\theta U^*/(1-\delta\lambda)\).
As \(\lambda \to 1\) that cost rises toward \(\theta U^*/(1-\delta)\), so \(y_\infty\) rises toward \(\theta U^*\).
With a quadratic loss, the government also prefers to spread the unemployment out rather than take it all at once.