91. Adaptive Agents in an Overlapping Generations Monetary Economy#
In addition to what’s in Anaconda, this lecture will need the following libraries:
!pip install quantecon
91.1. Overview#
A Peculiar Definition of Bounded Rationality studied monetary models with many rational expectations equilibria, among them a Cagan money-demand model whose equilibria include a continuum of bubbles.
This lecture works with a close relative: the overlapping generations model of fiat money of Samuelson [1958], in the version that Bryant, Wallace and others used to study inflationary finance, in which a government prints currency to pay for its expenditures.
We replace agents who forecast with the equilibrium law of motion for the price level by “adaptive” ones who do not.
We do this twice, for two different purposes.
Part 1 puts a stochastic government deficit into the model and asks whether successive generations, groping their way by trial and error, can somehow as a society converge to a rational expectations equilibrium.
They can.
Each generation observes what happened to its predecessors and adjusts their saving decision in a utility-improving direction, using a Robbins–Monro recursion.
Given enough time the economy converges to a stationary equilibrium that we compute independently, and of the two such equilibria it finds only the low-inflation one.
This exercise also shows how sensitive learning is to the complexity of what must be learned: a deficit state that occurs rarely is learned about slowly, because the observations arrive slowly.
Part 2 removes the randomness and turns to a sharper question.
With a constant deficit the model has two stationary equilibria, one with low inflation and one with high inflation.
The low-inflation equilibrium Pareto-dominates the other.
Under the rational expectations dynamics, the low-inflation equilibrium is unstable and the high-inflation one is stable: theory pushes the economy toward the bad outcome.
Under least squares learning, the stability is reversed.
The reversal is not a numerical accident: it follows from E-stability, the stability condition for learning that A Peculiar Definition of Bounded Rationality sets out in One recursion, many learners.
And when Marimon and Sunder [1993] ran the economy as a laboratory experiment with paid human subjects, the subjects behaved like the adaptive model, not like the rational expectations model.
That is the strongest evidence in Sargent [1993] that adaptive dynamics are doing real work as a selection device, tempered by a counterexample, due to Benjamin Bental, warning against concluding that adaptation reliably selects the good equilibrium.
We then close with a third application, in which the adaptive agent is a government learning a Phillips curve.
Least squares learning now converges to the model’s unique self-confirming equilibrium, which has an inflation bias, while a government that keeps a constant gain makes recurrent escapes toward the zero-inflation Ramsey outcome, which is not an equilibrium at all.
That phenomenon seeded Sargent’s later work on The Conquest of American Inflation, and the Phillips curve lectures that begin with The Rise and Fall of U.S. Inflation study it in depth.
Let’s start with some imports.
import numpy as np
import pandas as pd
import quantecon as qe
import matplotlib.pyplot as plt
from scipy.optimize import fsolve
91.2. The environment#
The economy consists of overlapping generations of two-period-lived agents.
At each date \(t \geq 1\), \(N\) identical agents are born, endowed with \(w_1\) units of a single consumption good when young and \(w_2\) units when old.
A young agent’s preferences over lifetime consumption \((c_1, c_2)\) are ordered by the expected value of \(u(c_1) + u(c_2)\).
Throughout we use logarithmic utility, \(u(c) = \ln c\).
A government prints currency to finance expenditures \(G_t\), subject to the budget constraint
where \(H_t\) is the stock of currency carried by the young at \(t\) into \(t+1\), and \(p_t\) is the price level.
Currency is the only store of value, so a young agent’s saving \(s_t\) is entirely in the form of real balances, and market clearing requires
Write \(R_t = p_t / p_{t+1}\) for the gross rate of return on currency between \(t\) and \(t+1\).
Combining (91.1) and (91.2) gives a relation we will use constantly: the return on currency is determined entirely by saving behavior and the deficit,
Currency holds its value only if the next generation is willing to absorb the outstanding stock plus the new issue.
Note
(91.3) is worth pausing on, because it is what makes this a self-referential system, the property studied at length in Least Squares Learning in Self-Referential Models.
The return that today’s young earn on their saving depends on how much tomorrow’s young choose to save, which in turn depends on what tomorrow’s young expect to earn.
Nobody’s beliefs are about an exogenous process.
91.3. Part 1: a stochastic deficit#
Now let government expenditures follow a Markov chain with transition probabilities
over a finite list of levels \(G = [\bar G_1, \ldots, \bar G_n]\).
(Sargent writes \(\pi(i, j)\); we reserve \(\pi\) for inflation.)
91.3.1. Stationary rational expectations equilibrium#
In a stationary equilibrium, saving depends on the current deficit state, so it is described by an \(n \times 1\) vector \(s = [s_1, \ldots, s_n]\), and the return on currency by an \(n \times n\) matrix \(R(i,j)\).
A young agent who observes \(G_t = \bar G_i\) chooses \(s_i\) to maximize
with first-order condition
Substituting (91.3) — which in the stationary equilibrium reads \(R(i,j) = (s_j N - \bar G_j)/(s_i N)\) — turns (91.4) into a system of \(n\) nonlinear equations in the saving rates alone:
A stationary equilibrium exists if and only if (91.5) has a solution with \(s_i \in (0, w_1)\) for every \(i\) and with every return positive, that is, \(s_j N > \bar G_j\) for every \(j\).
The code below solves (91.5) from an initial guess and checks both conditions.
w1, w2, N = 20.0, 10.0, 1.0

def u_prime(c):
    return 1 / c                       # log utility

def equilibrium_residual(s, G, P):
    "Left minus right side of the equilibrium condition, one entry per deficit state."
    n = len(s)
    out = np.empty(n)
    for i in range(n):
        rhs = sum(u_prime(w2 + (s[j]*N - G[j])/N)
                  * (s[j]*N - G[j])/(s[i]*N)
                  * P[i, j] for j in range(n))
        out[i] = u_prime(w1 - s[i]) - rhs
    return out

def stationary_equilibrium(G, P, guess=4.0):
    "Solve the equilibrium condition from `guess`; check that the solution is an equilibrium."
    s, _, ier, msg = fsolve(equilibrium_residual, np.full(len(G), guess),
                            args=(G, P), full_output=True)
    R = np.array([[(s[j]*N - G[j])/(s[i]*N) for j in range(len(s))]
                  for i in range(len(s))])
    assert ier == 1, msg
    assert np.all((s > 0) & (s < w1)) and np.all(R > 0), "not an equilibrium"
    return s, R
Following Sargent [1993], we study two economies that differ only in the process for government expenditures, with \(w_1 = 20\), \(w_2 = 10\) and \(N = 1\), so that \(\bar G\) is measured per young person.
In the first, the deficit is always zero and the chain is a fair coin.
G1, P1 = np.array([0.0, 0.0]), np.full((2, 2), 0.5)
s1, R1 = stationary_equilibrium(G1, P1)
print(f"saving rates      {np.round(s1, 4)}")
print(f"returns\n{np.round(R1, 4)}")
saving rates      [5. 5.]
returns
[[1. 1.]
 [1. 1.]]
With no deficit to finance, currency simply holds its value: agents save \(5\) in either state and \(R \equiv 1\).
In the second economy the deficit is \(0.8\) in state 1 and zero in state 2, and the chain is persistent.
G2 = np.array([0.8, 0.0])
P2 = np.array([[0.75, 0.25],
               [0.50, 0.50]])
s2, R2 = stationary_equilibrium(G2, P2)
print(f"saving rates      {np.round(s2, 4)}      (Sargent reports 4.211, 4.364)")
print(f"returns\n{np.round(R2, 4)}")
print("Sargent reports  [[0.81, 1.0362], [0.7817, 1.00]]")
saving rates      [4.2111 4.3637]      (Sargent reports 4.211, 4.364)
returns
[[0.81   1.0362]
 [0.7817 1.    ]]
Sargent reports  [[0.81, 1.0362], [0.7817, 1.00]]
Both match the values reported in the text.
Notice the pattern in \(R\): the return on currency is poor whenever the government is about to run a deficit (the first column), because new issue dilutes the outstanding stock.
The system (91.5) is nonlinear, and Sargent warns that in general it has more than one solution.
Economy 2 has a second stationary equilibrium, which the solver finds if we start it at low saving rates.
s2_hi, R2_hi = stationary_equilibrium(G2, P2, guess=1.2)    # the high-inflation equilibrium
print(f"saving rates      {np.round(s2_hi, 4)}")
print(f"returns\n{np.round(R2_hi, 4)}")
saving rates      [1.1896 1.6343]
returns
[[0.3275 1.3738]
 [0.2384 1.    ]]
Saving is far lower, so each deficit must be financed by a large proportional issue of new currency, and the return on currency held into a deficit state falls from about \(0.8\) to between \(0.24\) and \(0.33\).
All its returns are positive, so this is a genuine stationary equilibrium, with much higher inflation.
The learning economy below never finds it, and Exercise 91.3 shows why.
91.3.2. Learning by successive generations#
Now withdraw the equilibrium from the agents.
They are still assumed to know their own utility function and to remember the experience of earlier agents like themselves, but they are not told the distribution of returns, which is exactly the object that (91.4) requires.
Instead, each generation adjusts its predecessors’ saving decision in the direction that realized experience suggests would have been better.
The realized lifetime utility of an agent who saved \(s\) and earned \(R\) is
with derivatives
The connection to equilibrium is that in a rational expectations equilibrium \(V'(s_i) = E_t U'(s_i)\) and \(V''(s_i) = E_t U''(s_i)\), where \(E_t\) conditions on \(G_t = \bar G_i\).
So an agent who could compute \(E_t U'\) would just set it to zero and be done.
Our agents cannot, and must estimate it from experience instead.
They use a Robbins–Monro algorithm, applied state by state.
Let \(\tau_i\) count the number of times the deficit state \(\bar G_i\) has been visited so far, and let \(\gamma_\tau\) be a decreasing gain sequence.
The rules are
\(M\) accumulates a running estimate of \(E_i U''\), and the saving rule takes a Newton step against it.
The gain \(\gamma_\tau\) plays the role of the relaxation parameter \(\lambda\) in A Peculiar Definition of Bounded Rationality: each observation moves the rule a fraction \(\gamma_\tau\) of the way toward what that observation suggests.
In the relaxation algorithm the gain was constant; here it declines, as it does for Bray’s least squares learners in that lecture, so each new observation moves the rule less than the one before.
Sargent sets \(\gamma_\tau = 1/\tau\) and starts \(M\) at \(-1\).
Our code uses \(\gamma_\tau = 1/(\tau + 20)\), which keeps the first steps cautious, as if the initial rule had already been learned from 20 observations, and starts \(M\) at \(U''(s, 1)\), the curvature the initial rule would have if currency held its value.
The algorithm is set up so that, if the saving rules converge, \(M(i, \tau_i) \to E_i U''\) and the limit solves \(E_i U'(s_i) = 0\), which is exactly the equilibrium condition (91.4).
Whether they converge, and to which solution when (91.5) has several, is governed by the stability of an associated ordinary differential equation, as explained in One recursion, many learners.
Two features of the setup deserve comment.
Two classes of agent. To evaluate a saving decision we must wait until two periods of that agent’s consumption are known, so the population is split into an “odd” and an “even” subsequence.
Odd agents reset their rule in odd periods and learn only from earlier odd agents; even agents likewise.
Sargent notes that this alternation resembles the designs of laboratory experiments.
Marimon and Sunder [1993], whose experiment appears in Part 2, drew their young subjects afresh at random each period, but the two-currency experiment of Arifovic [1996], discussed in Exchange Rate Indeterminacy, Learning, and Experiments, split its subjects into two fixed groups that were young in alternate periods, just like the odd and even classes here.
A projection facility. Nothing in (91.6) prevents a Newton step from pushing saving below the deficit.
The price level implied by (91.1) and (91.2), \(p_t = H_{t-1}/(N s_t - G_t)\), would then fail to be positive, and the economy would cease to exist.
We therefore confine each state’s saving rate to the interval \([\bar G_i/N + 0.4, \; w_1 - 0.4]\), a region where an equilibrium price level exists.
Devices of this kind are needed for the convergence theorems too; Least Squares Learning in Self-Referential Models discusses the projection facility in detail.
The simulation draws the whole path of deficit states first, then lets the two classes of agent learn along it.
def U_prime(s, R):
    return -1/(w1 - s) + R/(w2 + s*R)

def U_double(s, R):
    return -1/(w1 - s)**2 - R**2/(w2 + s*R)**2


def simulate(G, P, T=50_000, s0=None, seed=0, tau0=20, band=0.4, gain=None):
    """
    Overlapping generations learning a state-contingent saving rule.

    The gain is 1/(τ + tau0), where τ counts a class's visits to a state,
    unless a constant `gain` is supplied.  Returns the history of saving
    rules, shape (T, 2, n) = (time, class, state), and the deficit states.
    """
    n = len(G)
    states = qe.MarkovChain(P).simulate(ts_length=T, init=0, random_state=seed)
    s = np.array(s0, float)
    M = np.array([[U_double(s[j, k], 1.0) for k in range(n)] for j in range(2)])
    τ = np.zeros((2, n), int)
    floor = G/N + band                 # projection facility: saving must cover the deficit
    ceiling = w1 - band

    hist = np.empty((T, 2, n))
    prev = None

    for t in range(T):
        i = states[t]                  # today's deficit state
        j = t % 2                      # which class is young this period
        s_t = s[j, i]

        if prev is not None:           # last period's young now learn their return
            j_p, i_p, s_p = prev
            R = (N*s_t - G[i]) / (N*s_p)          # the return on currency
            τ[j_p, i_p] += 1
            γ = 1 / (τ[j_p, i_p] + tau0) if gain is None else gain
            M[j_p, i_p] += γ * (U_double(s_p, R) - M[j_p, i_p])
            s_new = s[j_p, i_p] - γ * U_prime(s_p, R) / M[j_p, i_p]
            s[j_p, i_p] = min(max(s_new, floor[i_p]), ceiling)

        prev = (j, i, s_t)
        hist[t] = s

    return hist, states
Note
The simulation never computes a price level.
Because (91.3) expresses the return on currency purely in terms of saving rates and the deficit, the real side of the model is self-contained.
This is more than a convenience: the nominal money stock in these economies grows without bound whenever the government runs a deficit, so a simulation that tracked \(H_t\) and \(p_t\) directly would overflow long before the learning converged.
91.3.3. Do they find it?#
We start both classes of agent far from equilibrium, with asymmetric rules, and let each economy run for 50,000 periods.
start = [[8.0, 2.0],
         [2.0, 8.0]]                   # deliberately far from equilibrium, and asymmetric

hist1, _ = simulate(G1, P1, s0=start)
hist2, _ = simulate(G2, P2, s0=start)

fig, axes = plt.subplots(1, 2, figsize=(11, 4), sharex=True)
for ax, hist, s_star, title in [(axes[0], hist1, s1, "Economy 1:  $\\bar G = (0, 0)$"),
                                (axes[1], hist2, s2, "Economy 2:  $\\bar G = (0.8, 0)$")]:
    for k, colour in enumerate(['C0', 'C1']):
        ax.plot(hist[:, 0, k], color=colour, lw=1, label=f"state {k+1}, even")
        ax.plot(hist[:, 1, k], color=colour, lw=1, ls=':', label=f"state {k+1}, odd")
        ax.axhline(s_star[k], color='k', lw=0.8, ls='--')
    ax.set_xscale('log')
    ax.set_xlabel("$t$  (log scale)")
    ax.set_title(title)
axes[0].set_ylabel("saving rate")
axes[0].legend(frameon=False, fontsize=8)
plt.tight_layout()
plt.show()
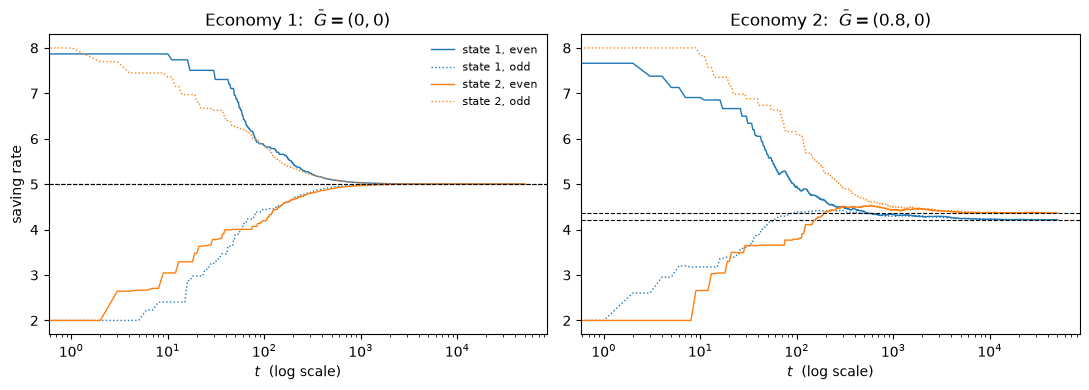
Fig. 91.1 Saving rates converge in both economies#
Fig. 91.1 shows that both economies converge, and that both classes of agent converge to the same rule even though neither learns from the other.
The dashed black lines are the equilibrium saving rates computed earlier from (91.5), objects that no agent in the simulation has access to.
The table reports the learned rules, averaged over the two classes, at three horizons.
rows = []
for T in (5_000, 50_000, 200_000):
    h1, _ = simulate(G1, P1, T=T, s0=start)
    h2, _ = simulate(G2, P2, T=T, s0=start)
    rows.append([f"learned, T = {T:,}", *h1[-1].mean(axis=0), *h2[-1].mean(axis=0)])
rows.append(["rational expectations", *s1, *s2])

pd.DataFrame(rows, columns=["", "econ 1 state 1", "econ 1 state 2",
                            "econ 2 state 1", "econ 2 state 2"]).set_index("").round(4)
| econ 1 state 1 | econ 1 state 2 | econ 2 state 1 | econ 2 state 2 | |
|---|---|---|---|---|
| learned, T = 5,000 | 5.0011 | 5.0007 | 4.2429 | 4.3930 |
| learned, T = 50,000 | 5.0001 | 5.0001 | 4.2170 | 4.3658 |
| learned, T = 200,000 | 5.0000 | 5.0000 | 4.2156 | 4.3693 |
| rational expectations | 5.0000 | 5.0000 | 4.2111 | 4.3637 |
Convergence is slow, which is what a gain of order \(1/\tau\) buys you, but it is convergence, and to the low-inflation equilibrium of economy 2.
91.3.4. How much do the agents have to be told?#
The agents learn a separate saving rate for each level of the deficit: in effect they learn the policy function \(s = f(G)\) non-parametrically, one number per state.
That is feasible here because there are only two states, and even so it has a cost.
A state that is rarely visited is learned about slowly, because its observations arrive slowly; Exercise 91.1 makes this concrete.
When the number of states is large, or the state is continuous, one number per state is hopeless, and agents must learn a parametric rule instead.
Learning, Approximation, and Equilibrium Computation takes up what that buys and what it costs.
91.4. Part 2: a constant deficit and two steady states#
Now strip out the randomness.
Let the government finance a constant deficit \(G\) per young person, and let utility be \(\ln c_1 + \ln c_2\) as before.
With perfect foresight over the price level, the young save
where \(\pi_t\) is the gross inflation rate, the reciprocal of the return on currency.
Let \(h_t = H_t/(N p_t)\) be real balances per young person.
The government’s budget constraint in real terms is \(h_t = h_{t-1}/\pi_{t-1} + G\), and equilibrium requires \(h_t = s_t\).
Eliminating \(h\) between these gives an autonomous difference equation in the inflation rate,
Stationary equilibria are the fixed points of \(g\), and since \(g\) is a hyperbola there are generically two of them.
We use the parameters of Marimon and Sunder [1993]’s “Economy 7C”: \(w_1 = 6\), \(w_2 = 1\), \(G = 1\).
w1_d, w2_d, G_d = 6.0, 1.0, 1.0
A1 = (w1_d + w2_d - 2*G_d) / w2_d
A2 = w1_d / w2_d

def g_map(π):
    return A1 - A2/π

π_low, π_high = np.sort(np.roots([1, -A1, A2]))
print(f"A1 = {A1},  A2 = {A2}")
print(f"stationary gross inflation rates: {π_low} and {π_high}")
print(f"   i.e. net inflation of {100*(π_low-1):.0f}% and {100*(π_high-1):.0f}% per period")
print(f"\nslope of g at the low  rate: {A2/π_low**2:.4f}   -> unstable under RE dynamics")
print(f"slope of g at the high rate: {A2/π_high**2:.4f}   -> stable under RE dynamics")
A1 = 5.0,  A2 = 6.0
stationary gross inflation rates: 2.0 and 3.0
   i.e. net inflation of 100% and 200% per period

slope of g at the low  rate: 1.5000   -> unstable under RE dynamics
slope of g at the high rate: 0.6667   -> stable under RE dynamics
There it is: the low-inflation stationary equilibrium is unstable under the rational expectations dynamics, and the high-inflation one is stable.
The case \(G = 0\) connects this model to the bubbles of A Peculiar Definition of Bounded Rationality.
With no deficit, \(A_1 = 1 + w_1/w_2\), and the fixed points of \(g\) are \(\pi = 1\) and \(\pi = w_1/w_2\).
These are the bubbleless, quantity-theory equilibrium of The bubble with a constant money supply, and the inflation rate that every one of its bubble paths approaches.
The scales differ.
That lecture endows agents with \(2w_1\) and \(2w_2\), so its demand for real balances is \(w_1 - w_2\pi\), while saving here is \((w_1 - w_2\pi)/2\).
It also fixes the growth rate \(\mu\) of the money supply where we fix the deficit \(G\), and the two models coincide when \(\mu = 1\) and \(G = 0\).
The stability analysis below therefore answers that lecture’s question of which bubble we are in: least squares learners kill the bubble (Exercise 91.5).
π_grid = np.linspace(1.35, 4.2, 400)

fig, ax = plt.subplots(figsize=(6.5, 5.5))
ax.plot(π_grid, g_map(π_grid), lw=1.6, label=r"$g(\pi) = A_1 - A_2/\pi$")
ax.plot(π_grid, π_grid, 'k--', lw=0.8, label="45 degree line")

# cobweb the RE dynamics away from the low steady state
π = π_low + 0.05
for _ in range(30):
    nxt = g_map(π)
    ax.plot([π, π], [π, nxt], color='C3', lw=0.9)
    ax.plot([π, nxt], [nxt, nxt], color='C3', lw=0.9)
    π = nxt

for p, name in [(π_low, "low"), (π_high, "high")]:
    ax.plot(p, p, 'ko', ms=6)
    ax.annotate(f"{name}\n$\\pi = {p:.0f}$", (p, p), textcoords="offset points",
                xytext=(10, -22), fontsize=9)
ax.set_xlabel(r"$\pi_t$")
ax.set_ylabel(r"$\pi_{t+1}$")
ax.legend(frameon=False, loc='upper left')
plt.show()
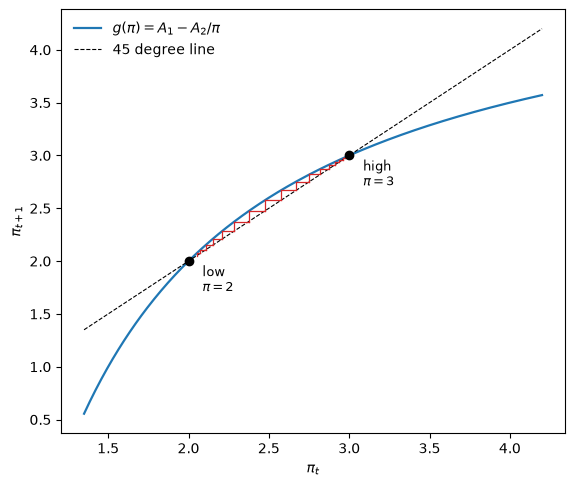
Fig. 91.2 Rational expectations inflation dynamics#
In Fig. 91.2 the red staircase starts just above the low-inflation steady state and marches away from it, toward the high-inflation one.
The table follows rational expectations paths from four initial inflation rates.
def re_path(π0, T=25):
    path = [π0]
    for _ in range(T):
        nxt = g_map(path[-1])
        path.append(nxt if nxt > 0 else np.nan)
    return np.array(path)

pd.DataFrame({f"$\\pi_0 = {p}$": re_path(p) for p in (1.99, 2.01, 2.5, 4.0)}
             ).rename_axis("t").round(4).iloc[[0, 1, 2, 5, 10, 25]]
| $\pi_0 = 1.99$ | $\pi_0 = 2.01$ | $\pi_0 = 2.5$ | $\pi_0 = 4.0$ | |
|---|---|---|---|---|
| t | ||||
| 0 | 1.9900 | 2.0100 | 2.5000 | 4.0000 |
| 1 | 1.9849 | 2.0149 | 2.6000 | 3.5000 |
| 2 | 1.9772 | 2.0222 | 2.6923 | 3.2857 |
| 5 | 1.9187 | 2.0712 | 2.8836 | 3.0705 |
| 10 | 0.6693 | 2.3681 | 2.9830 | 3.0087 |
| 25 | NaN | 2.9961 | 3.0000 | 3.0000 |
Started fractionally below the low steady state the economy collapses (inflation computed from (91.8) turns negative, so no positive price level exists); started fractionally above it, the economy converges to \(\pi = 3\).
This matters because of how the two equilibria rank.
The comparative statics of the low-inflation equilibrium are “classical”: raising the deficit \(G\) lowers \(A_1\), which raises the low stationary inflation rate.
The comparative statics of the high-inflation equilibrium are the reverse, because the economy is on the wrong side of an inflation-tax Laffer curve; see Exercise 91.4.
And the low-inflation equilibrium Pareto-dominates every other equilibrium of this model, stationary or not.
(The ranking relies on everyone in a generation being alike; Sargent notes that in versions with borrowers and lenders within a generation the equilibria are not Pareto-comparable.)
So the rational expectations dynamics repel the economy from the Pareto-optimal outcome, and most classical doctrine in monetary theory depends on selecting the equilibrium that those dynamics reject.
91.4.1. Least squares dynamics#
Marcet and Sargent [1989] studied a version of this economy in which agents do not have perfect foresight but instead run a regression.
Each period they regress the price level on its own lagged value and use the fitted slope as their forecast of gross inflation,
and then save \(s_t = (w_1 - w_2 \beta_t)/2\) according to (91.7).
Since \(\beta_t\) uses data through \(t-1\) only, there is no simultaneity: beliefs determine saving, saving determines the price level, and the new price level enters next period’s regression.
Because \(p_s = \pi_{s-1} p_{s-1}\), the estimator can be written
a weighted average of past realized inflation rates, with weights proportional to \(p_{s-1}^2\).
Those weights are far from equal.
Written recursively,
least squares is adaptive expectations whose gain \(\gamma_t\) is the newest observation’s share of the weight.
During an inflation the price level grows geometrically, so that share does not shrink: when \(p\) grows at gross rate \(\pi\), \(\gamma_t\) tends to \(1 - 1/\pi^2\), which is \(0.75\) at \(\pi = 2\).
So least squares in levels does not average a long history; during an inflation it behaves like adaptive expectations with a large gain.
The same form makes the recursion easy to compute.
The price level grows geometrically, so the two sums overflow quickly, but if we rescale both by the newest weight at each step everything stays of order one.
The code treats the initial belief \(\pi_0\) as a single pseudo-observation.
def ls_dynamics(π_init, T=3000, G=G_d):
    """
    Least squares dynamics.  Carries the two regression sums rescaled by the
    newest p^2, so nothing overflows even though the price level does not stop
    growing.  Returns (beliefs, realized inflation, survived?).
    """
    s_prev = (w1_d - w2_d*π_init) / 2
    num, den, π_last = π_init, 1.0, π_init
    betas, infl = [], []

    for t in range(T):
        β = num / den
        s_t = (w1_d - w2_d*β) / 2
        if s_t <= G or not np.isfinite(s_t):
            return np.array(betas), np.array(infl), False   # no positive price level
        π_t = s_prev / (s_t - G)                            # realized gross inflation
        num = num/π_last**2 + π_t
        den = den/π_last**2 + 1.0
        π_last, s_prev = π_t, s_t
        betas.append(β)
        infl.append(π_t)

    return np.array(betas), np.array(infl), True


rows = []
for π0 in (0.5, 1.2, 1.5, 1.9, 2.1, 2.5, 2.9, 2.99, 3.01):
    b, infl, ok = ls_dynamics(π0)
    if ok:
        settled = np.argmax(np.abs(b - π_low) < 1e-3)
        rows.append([π0, "yes", b[-1], settled, np.nan])
    else:
        rows.append([π0, "no", np.nan, np.nan, len(b)])

pd.DataFrame(rows, columns=["initial belief $\\pi_0$", "survived", "belief $\\beta_T$",
                            "periods to within 0.001 of $\\pi_{low}$",
                            "period of collapse"]).round(5)
| initial belief $\pi_0$ | survived | belief $\beta_T$ | periods to within 0.001 of $\pi_{low}$ | period of collapse | |
|---|---|---|---|---|---|
| 0 | 0.50 | yes | 2.0 | 11.0 | NaN |
| 1 | 1.20 | yes | 2.0 | 13.0 | NaN |
| 2 | 1.50 | yes | 2.0 | 13.0 | NaN |
| 3 | 1.90 | yes | 2.0 | 3.0 | NaN |
| 4 | 2.10 | yes | 2.0 | 3.0 | NaN |
| 5 | 2.50 | yes | 2.0 | 13.0 | NaN |
| 6 | 2.90 | yes | 2.0 | 10.0 | NaN |
| 7 | 2.99 | yes | 2.0 | 17.0 | NaN |
| 8 | 3.01 | no | NaN | NaN | 5.0 |
91.4.2. The stability reversal#
Least squares learning converges to the low-inflation equilibrium from every initial belief below \(3\) in the table, within 20 periods, even from beliefs just below \(3\), the steady state that the rational expectations dynamics converge to.
A belief just above \(3\) ends the monetary economy: expected inflation rises until saving no longer covers the deficit.
Fig. 91.3 sets least squares paths beside rational expectations paths.
fig, ax = plt.subplots(figsize=(8, 4.5))

for π0 in (1.5, 2.5, 2.95):
    _, infl, _ = ls_dynamics(π0, T=60)
    ax.plot(infl, color='C0', lw=1.2,
            label="least squares dynamics" if π0 == 1.5 else None)

for π0 in (2.05, 2.5, 4.0):
    ax.plot(re_path(π0, 60), color='C3', lw=1.2, ls='--',
            label="rational expectations dynamics" if π0 == 2.05 else None)

ax.axhline(π_low, color='k', lw=0.8, ls=':')
ax.axhline(π_high, color='k', lw=0.8, ls=':')
ax.annotate("low", (52, π_low + 0.04), fontsize=9)
ax.annotate("high", (52, π_high + 0.04), fontsize=9)
ax.set_xlim(0, 60)
ax.set_ylim(1.2, 4.2)
ax.set_xlabel("$t$")
ax.set_ylabel("gross inflation")
ax.legend(frameon=False)
plt.show()
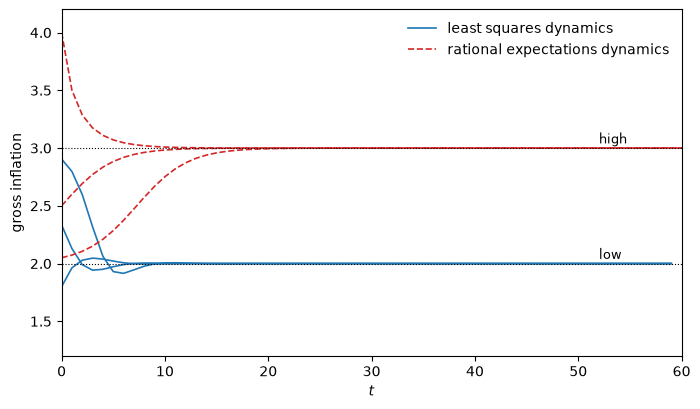
Fig. 91.3 Least squares and rational expectations inflation paths#
The two families of paths run in opposite directions.
A bisection locates the edge of the least squares basin of attraction.
lo, hi = 2.5, 3.7
for _ in range(40):                      # bisect for the edge of the basin
    mid = (lo + hi) / 2
    lo, hi = (mid, hi) if ls_dynamics(mid)[2] else (lo, mid)
print(f"least squares dynamics survive for initial beliefs up to {lo:.6f}")
print(f"the rational-expectations-stable steady state is      {π_high}")
least squares dynamics survive for initial beliefs up to 3.000000
the rational-expectations-stable steady state is      3.0
The edge of the basin is \(\pi_{\text{high}}\) itself.
At exactly \(\pi_0 = 3\), beliefs stay put: \(\pi_{\text{high}}\) is a rest point of the least squares dynamics, but an unstable one.
We never start at exactly \(3\), because in floating-point arithmetic a rounding error of order \(10^{-16}\) eventually grows, and the economy then falls to \(\pi_{\text{low}}\) or collapses, depending on the sign of the error.
So the steady state that the rational expectations dynamics single out as the stable one is precisely the edge of the basin of attraction of the learning dynamics toward the other one.
Here the initial belief matters permanently, because it decides whether the monetary economy survives.
91.4.2.1. Why the reversal? E-stability#
Fix a belief \(\beta\) and suppose agents held it forever.
Saving would be constant at \(s(\beta) = (w_1 - w_2\beta)/2\), and the budget constraint \(h_t = h_{t-1}/\pi_{t-1} + G\) with \(h_t = s(\beta)\) would deliver constant actual inflation
\(T\) maps perceived inflation into actual inflation; it is this model’s version of the \(T\)-map of A Peculiar Definition of Bounded Rationality, and its fixed points are the stationary equilibria.
Least squares moves beliefs toward the inflation they produce, so when the gain is small the average motion of beliefs follows the ordinary differential equation
A fixed point \(\beta^*\) is stable under this equation, or E-stable, if \(T'(\beta^*) < 1\) (One recursion, many learners, and Least Squares Learning in Self-Referential Models for the general theory).
At Economy 7C’s parameters \(T(\beta) = (6 - \beta)/(4 - \beta)\), so \(T'(\beta) = 2/(4-\beta)^2\).
def T_map(β, G=G_d):
    "Actual gross inflation when the belief β is held forever."
    s = (w1_d - w2_d*β) / 2
    return s / (s - G)

def slope(f, x, h=1e-6):
    return (f(x + h) - f(x - h)) / (2*h)

for π_star, name in [(π_low, "low "), (π_high, "high")]:
    print(f"{name} steady state π = {π_star:.0f}:   T'(π) = {slope(T_map, π_star):.3f},"
          f"   g'(π) = {slope(g_map, π_star):.3f}")
low  steady state π = 2:   T'(π) = 0.500,   g'(π) = 1.500
high steady state π = 3:   T'(π) = 2.000,   g'(π) = 0.667
So \(T'(2) = 1/2\) and \(T'(3) = 2\): the low steady state is E-stable and the high one is not.
Every slope lies on the opposite side of one from the corresponding slope of \(g\).
Under perfect foresight, a belief slightly above \(\pi_{\text{low}}\) is validated and amplified, because \(g\) has slope \(1.5\) there.
Under learning, the same belief lowers saving and so raises actual inflation, but only half as much, since \(T\) has slope \(1/2\); realized inflation comes in below the belief, and the belief is revised back down.
At \(\pi_{\text{high}}\) it is the other way around.
This is not a coincidence of Economy 7C’s parameters.
At every steady state with positive saving, \(\operatorname{sign}(T' - 1) = -\operatorname{sign}(g' - 1)\), so whenever there are two steady states, the lower is E-stable and unstable under rational expectations, and the higher is the reverse; Exercise 91.6 asks you to prove it.
The reversal is a theorem about this model.
There is a second way to see why the two dynamics disagree.
Under perfect foresight nothing in the past pins down the initial inflation rate, so the rational-expectations-stable high steady state is approached by a continuum of equilibrium paths, while near the unstable low one the only equilibrium path is the stationary one.
Learning selects the steady state that is locally unique.
One caveat remains.
The differential equation describes the average motion of beliefs when each observation moves them only a little, and we saw above that least squares here gives the newest observation a weight near \(1 - 1/\pi^2\), three quarters at \(\pi_{\text{low}}\).
So we check the verdict directly.
Near a steady state \(\pi^*\) least squares behaves like adaptive expectations \(\beta_{t+1} = \beta_t + \gamma(\pi_{t-1} - \beta_t)\) with \(\gamma = 1 - 1/\pi^{*2}\).
Realized inflation \(\pi_{t-1} = s(\beta_{t-1})/(s(\beta_t) - G)\) depends on two successive beliefs, so this is a second-order difference equation in \(\beta\).
The code linearizes it at each steady state and reports its largest root in modulus, at the least squares gain and across all gains between 0 and 1.
def local_modulus(π_star, γ):
    "Largest root, in modulus, of the adaptive-expectations recursion linearized at π_star."
    s = (w1_d - w2_d*π_star) / 2
    a = -(w2_d/2) / (s - G_d)                   # ∂π_{t-1} / ∂β_{t-1}
    b = (w2_d/2) * s / (s - G_d)**2             # ∂π_{t-1} / ∂β_t
    return np.max(np.abs(np.roots([1, -(1 - γ + γ*b), -γ*a])))

γ_grid = np.linspace(0.01, 1, 100)
for π_star, name in [(π_low, "low "), (π_high, "high")]:
    γ_ls = 1 - 1/π_star**2
    moduli = [local_modulus(π_star, γ) for γ in γ_grid]
    print(f"{name}: least squares gain {γ_ls:.3f}, largest root {local_modulus(π_star, γ_ls):.3f};"
          f"  over gains in (0, 1]: from {min(moduli):.3f} to {max(moduli):.3f}")
low : least squares gain 0.750, largest root 0.612;  over gains in (0, 1]: from 0.500 to 0.995
high: least squares gain 0.889, largest root 2.409;  over gains in (0, 1]: from 1.010 to 2.618
At \(\pi_{\text{low}}\) every root lies inside the unit circle, whatever the gain; at \(\pi_{\text{high}}\) some root lies outside it, whatever the gain.
The E-stability verdict survives the large gain.
It also explains why Bruno and Fischer [1990] found the same reversal in a closely related model using Friedman-style adaptive expectations instead of least squares.
Sargent nevertheless cites Bullard and Duffy [1993] as a warning not to overgeneralize from this result.
In overlapping generations economies whose agents live \(n\) periods, they found that for \(n \geq 4\) least squares learning fails to converge locally to a rational expectations equilibrium.
91.4.3. Marimon and Sunder’s experiment#
Which set of dynamics describes people?
Marimon and Sunder [1993] built a laboratory economy to find out.
A fixed number of paying subjects were assigned roles as “young” and “old” in an implementation of exactly this model.
Each period the young submitted a schedule saying how much output they were willing to supply to the old for money at each price, and the experimenters cleared the market against the demand from the old and from the government.
Subjects temporarily on the sidelines played a forecasting game with its own cash prize, so the experiment produced a direct record of the price expectations driving the economy.
The session length was unknown to the subjects but governed by publicly announced rules that made the economy equivalent, from their point of view, to one that never ends.
Two findings matter here.
First, the experimental inflation paths were much better approximated by the least squares dynamics converging to the low stationary rate than by the rational expectations dynamics converging to the high one.
Sargent reports that this pattern is indicative of all of their results: on average, the experimental dynamics are much better approximated by the adaptive dynamics than by the rational expectations dynamics.
Second, the sideliners’ forecast errors were comparable in size to those a least squares forecaster would have made using the same data.
The subjects were not doing something exotic, they were doing roughly what the adaptive model says.
The equilibrium that theory calls unstable is the one that both the algorithm and the humans select.
Note
Experimental evidence is not the only way to discriminate.
İmrohoroğlu [1993] estimated a rational expectations version of this model on German hyperinflation data and found the opposite: his estimated equilibrium slides along the bad side of the Laffer curve toward the high stationary rate, which is inconsistent with the equilibrium the adaptive dynamics select.
91.4.4. A warning#
It is tempting to conclude that adaptive dynamics reliably select the Pareto-superior equilibrium.
Sargent offers a counterexample, shown to him by Benjamin Bental, built from a special case of Brock [1974]’s money-in-the-utility-function model.
An infinitely lived household with endowment \(y\) maximizes \(\sum_t \delta^t (\ln c_t + \phi \ln(m_t/p_t))\) subject to a sequence of budget constraints, while the government finances a fixed expenditure \(G > 0\) by printing currency.
(Sargent writes \(\beta\) and \(\gamma\) for the discount factor \(\delta\) and the weight \(\phi\); we keep \(\beta\) for beliefs and \(\gamma\) for gains.)
Under the parameter restriction \(\phi(y - G) > G\) the model has a unique stationary equilibrium, with gross inflation
which has the classical property of rising with the deficit.
φ_b, δ_b, y_b = 1.0, 1/1.05, 11.0

def brock_π(G):
    return ((y_b - G)*φ_b - δ_b*G) / ((y_b - G)*φ_b - G)

G_vals = (0.5, 1.0, 1.5, 2.0)
pd.DataFrame({
    "$G$": G_vals,
    "restriction $\\phi(y-G) > G$": [φ_b*(y_b - G) > G for G in G_vals],
    "stationary $\\pi$": [brock_π(G) for G in G_vals],
    "return on currency $1/\\pi$": [1/brock_π(G) for G in G_vals],
}).round(5)
| $G$ | restriction $\phi(y-G) > G$ | stationary $\pi$ | return on currency $1/\pi$ | |
|---|---|---|---|---|
| 0 | 0.5 | True | 1.00238 | 0.99762 |
| 1 | 1.0 | True | 1.00529 | 0.99474 |
| 2 | 1.5 | True | 1.00893 | 0.99115 |
| 3 | 2.0 | True | 1.01361 | 0.98658 |
But the model also has a continuum of non-stationary equilibria, indexed by initial price levels below the stationary one, in all of which the gross inflation rate converges to \(\delta\) — that is, the economy ends in deflation, with the return on currency approaching \(1/\delta = 1.05\) and real balances exploding.
These exist because the demand for currency implied by \(\phi \ln(m/p)\) is so elastic with respect to the rate of return that the government can raise enough seigniorage to finance \(G\) even while paying interest on currency through deflation.
Sargent reports that least squares learning here selects the classical stationary equilibrium, just as in the overlapping generations model.
The \(T\)-map makes that easy to check.
With consumption constant at \(y - G\), the household’s first-order condition for money gives real balances \(h(\pi^e) = \phi (y - G) \pi^e / (\pi^e - \delta)\) when expected inflation is \(\pi^e\).
The budget constraint \(h = h/\pi + G\) then turns a belief held forever into actual inflation \(T(\pi^e) = h(\pi^e)/(h(\pi^e) - G)\).
def brock_T(πe, G):
    "Actual gross inflation when expected inflation πe is held forever."
    h = φ_b * (y_b - G) * πe / (πe - δ_b)
    return h / (h - G)

G_b = 1.0
print(f"stationary π = {brock_π(G_b):.5f},   T'(π) = {slope(lambda x: brock_T(x, G_b), brock_π(G_b)):.3f}")
stationary π = 1.00529, T'(π) = 0.095
The slope is far below one, so the classical stationary equilibrium is E-stable.
The difference from the overlapping generations model is the welfare ranking: in the Brock model, the non-stationary equilibria all Pareto-dominate the classical stationary one that learning picks.
So in both examples least squares dynamics select the classical equilibrium.
Whether that equilibrium is the good one is a separate question, and the answer depends on the model.
91.5. A government learning the Phillips curve#
The examples so far put adaptive households into a monetary economy.
We close with an application in which the adaptive agent is the government, learning an econometric relationship that it acts on.
The model, due to Sims [1988] and estimated by Chung [1990], extends the Phillips curve example of Kydland and Prescott [1977].
It nests two stories about post-war U.S. inflation: a government misled by an apparently exploitable Phillips curve, and Phillips-curve fitters whose adaptive methods caught the adverse shift in time.
The Phillips curve lectures that begin with The Rise and Fall of U.S. Inflation develop this material in depth, with the same calibration; here we give a condensed version.
91.5.1. The model#
Inflation is decomposed into an expected and an unexpected part,
where \(g_{t-1}\) is the inflation the public expects (and which the government controls) and \(\eta_t\) is the public’s forecast error, orthogonal to earlier information.
The true Phillips curve is the natural-rate one: only the surprise \(\eta_t\) moves unemployment:
The government does not know this.
It believes unemployment depends on the level of inflation, and fits the non-expectational regression
Each period it minimizes \(\tfrac12 \mathbb{E}(U_t^2 + \pi_t^2)\) subject to its perceived model, which yields the myopic target
The system is self-referential: the government’s beliefs \(\alpha\) set its policy \(g\) through (91.13); the policy shapes the joint distribution of \((\pi, U)\); and that distribution is what the government’s regression (91.12) estimates.
Note
We follow Sargent [1993]’s notation, in which \(\pi_t\) is net inflation in percent.
The table translates to Escaping Nash Inflation and Priors, Escapes, and Learning Cycles; A note on notation covers the rest of the Phillips curve lectures.
object |
here |
Escaping Nash Inflation, Priors, Escapes, and Learning Cycles |
|---|---|---|
inflation |
\(\pi_t\) |
\(\pi_n\) |
government’s target (systematic) inflation |
\(g_{t-1}\) |
\(x_n\) |
natural rate of unemployment |
\(U^*\) |
\(u\) |
inflation surprise |
\(\eta_t\) |
\(\sigma_2 W_{2n}\) |
unemployment shock |
\(u_t\) |
\(\sigma_1 W_{1n}\) |
belief: intercept, slope |
\(\alpha_0\), \(\alpha_1\) |
\(\gamma_{-1}\), \(\gamma_1\) (escaping_nash); \(a\), \(b\) (priors) |
constant gain |
\(\gamma\) |
\(\varepsilon\) |
equilibrium with the inflation bias |
self-confirming (Kydland–Prescott’s “consistent”) |
self-confirming (Nash) |
U_star, θ_pc = 5.0, 1.0             # natural rate 5%, Phillips slope
σ_η, σ_u = 0.3, 0.3                 # inflation-surprise and unemployment shocks

def govt_target(α):
    "Government's myopic optimal target inflation."
    α0, α1 = α
    return -α0 * α1 / (1 + α1**2)
91.5.2. The self-confirming equilibrium#
Kydland and Prescott’s consistent equilibrium is what the Phillips curve lectures call a self-confirming equilibrium: a belief vector \(\alpha\) whose induced policy generates data whose regression returns the same \(\alpha\).
Under a constant policy \(g\), the surprise \(\eta_t\) is the only thing moving inflation around its mean, so the population regression of \(U\) on \(\pi\) has slope exactly \(-\theta\) and intercept \(U^* + \theta g\).
Solving that fixed point with the decision rule (91.13) gives Kydland and Prescott’s time-consistent outcome,
α_consistent = np.array([(1 + θ_pc**2) * U_star, -θ_pc])
g_consistent = θ_pc * U_star
print(f"self-confirming beliefs α = {α_consistent},  target inflation g = {g_consistent}")
print(f"optimal (Ramsey) outcome:                     target inflation g = 0")
self-confirming beliefs α = [10. -1.],  target inflation g = 5.0
optimal (Ramsey) outcome:                     target inflation g = 0
This is the inflation bias.
The government inflates at rate \(\theta U^*\) and gets nothing for it: because only surprises move unemployment, average unemployment is \(U^*\) either way.
Had the government understood the true model (91.11), it would have chosen \(g = 0\), the Ramsey outcome, with the same unemployment and none of the inflation.
The self-confirming equilibrium is unique, and the Ramsey outcome is not an equilibrium: to choose \(g = 0\) the government would have to believe there is no tradeoff, but the data that \(g = 0\) generates show the slope \(-\theta\).
The self-confirming equilibrium is E-stable, so a government that believes its coefficients are constant and estimates them by least squares with a decreasing gain is drawn toward it asymptotically (Self-Confirming Equilibria, Adaptive Learning and Escape Dynamics); in finite samples a falling gain can also let an early escape stick, because it slows the return as well.
That is the natural-rate story: the government keeps inflating because its own policy keeps producing data that confirm the tradeoff it believes in.
91.5.3. Constant-gain learning and escapes#
Sims [1988] and Chung [1990] made the government less sure that its coefficients are constant: it suspects they drift as a random walk and estimates them with a Kalman filter (see A First Look at the Kalman Filter), which discounts old data in favor of recent data.
Sims found two kinds of history.
Some stayed near the self-confirming equilibrium; others converged to a process that spends most of its time near the zero-inflation Ramsey outcome, because a government willing to entertain drifting coefficients learns, without a big inflation, that the tradeoff is poor.
Which kind emerges depends partly on parameters, especially the drift variances the government entertains.
Our government learns in a simpler way, by constant-gain recursive least squares, the version studied by Sargent [1999] and Cho et al. [2002], which approximates a Kalman filter with a particular prior about the drift [Sargent and Williams, 2005].
With \(x_t = (1, \pi_t)^\top\) and a constant gain \(\gamma\), it sets \(g_{t-1}\) by (91.13) using its estimate \(\alpha_t\), observes \((\pi_t, U_t)\), and updates
Unlike a \(1/t\) gain, which eventually freezes the estimates, a constant gain keeps the government paying attention to what just happened.
We start it at the self-confirming beliefs, with \(M_0 = I\) and \(\gamma = 0.02\).
def constant_gain(T=40_000, gain=0.02, seed=1):
    """
    Government estimates its Phillips curve by constant-gain recursive least
    squares, starting from the self-confirming beliefs.  Returns the paths of
    target inflation g_{t-1}, inflation π_t and unemployment U_t.
    """
    rng = np.random.default_rng(seed)
    α = α_consistent.copy()
    M = np.eye(2)                                          # moment-matrix estimate
    g_path, π_path, U_path = np.empty(T), np.empty(T), np.empty(T)
    for t in range(T):
        g = govt_target(α)
        η = σ_η * rng.standard_normal()
        π = g + η
        U = U_star - θ_pc * η + σ_u * rng.standard_normal()   # true Phillips curve
        x = np.array([1.0, π])
        M = M + gain * (np.outer(x, x) - M)
        α = α + gain * np.linalg.solve(M, x * (U - x @ α))
        g_path[t], π_path[t], U_path[t] = g, π, U
    return g_path, π_path, U_path

g_path, _, _ = constant_gain()

fig, ax = plt.subplots(figsize=(9, 4))
ax.plot(g_path, lw=0.5)
ax.axhline(g_consistent, color='C3', ls='--', lw=1, label="self-confirming equilibrium (inflation bias)")
ax.axhline(0, color='C2', ls=':', lw=1, label="Ramsey / zero inflation")
ax.set_ylim(-1, 6.8)
ax.set_xlabel("$t$")
ax.set_ylabel("target inflation $g_t$")
ax.legend(frameon=False, loc='upper center', ncol=2)
plt.show()
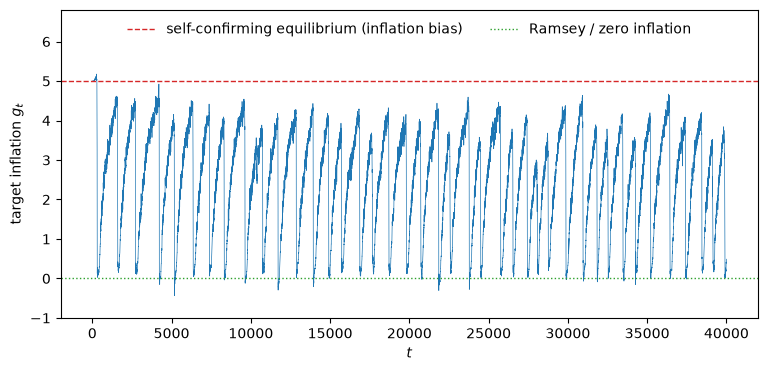
Fig. 91.4 Constant-gain learning and recurrent escapes toward zero inflation#
Fig. 91.4 shows that the constant-gain government does not settle at the inflation bias.
It repeatedly and abruptly escapes toward zero inflation, then climbs back toward the inflation bias, and at this gain it usually escapes again before it gets there: a recurring sawtooth.
The escapes reinforce themselves.
A run of shocks that makes unemployment look unresponsive to inflation flattens the estimated slope \(\alpha_1\), and the government cuts inflation.
That predictable fall in inflation does not raise unemployment, since only surprises move it, so the government’s own policy generates data that confirm the flatter slope and push inflation further toward zero.
This recurrent escape-and-return is the dynamics of Sargent [1999] and Cho et al. [2002], not Sims’s, whose escaping histories stayed near the Ramsey outcome; Priors, Escapes, and Learning Cycles traces the difference to how the government sets up its Kalman filter.
Adaptive Learning and Escape Dynamics and Escaping Nash Inflation show how the frequency of escapes depends on the gain, and how Sargent [1999] turned them into a theory of how U.S. inflation was conquered in the early 1980s.
Chung went further and estimated the government’s learning rule itself on post-war U.S. data; Exercise 91.7 asks you to solve a stripped-down version of his problem.
91.6. Concluding remarks#
Part 1 showed that a system of adaptive agents can find a rational expectations equilibrium it was never told about.
It also showed that which equilibrium it finds is not up to the agents: economy 2 has two stationary equilibria, and learning finds only the low-inflation one.
And it made visible how much the complexity of the environment governs the speed of learning: a rare deficit state is learned about slowly.
Part 2 sharpened the selection result.
Where the model has two steady states, least squares learning picks out the one that the rational expectations dynamics reject, and laboratory subjects go the same way.
E-stability explains why: at every steady state with positive saving the slopes of the \(T\)-map and of the rational expectations map lie on opposite sides of one.
The same logic disposes of the bubbles of A Peculiar Definition of Bounded Rationality (Exercise 91.5).
That is the best case in Sargent [1993] for treating adaptive dynamics as an equilibrium selection device.
The Brock counterexample marks its limit.
In both models learning selects the classical equilibrium, which is the good one in one model and a bad one in the other.
The selection is a fact about the dynamics, not a welfare theorem, and 1993 Prospects for Bounded Rationality in Macroeconomics returns to how much weight it can bear.
The Phillips curve application turned the gain into the object of interest.
With a decreasing gain the government settles at the inflation bias; with a constant gain it keeps escaping toward the Ramsey outcome, which is not an equilibrium at all.
The Phillips curve lectures that begin with The Rise and Fall of U.S. Inflation take this up in depth.
Learning, Approximation, and Equilibrium Computation takes up the question Part 1 left open: what an agent must give up when the state is continuous.
Exchange Rate Indeterminacy, Learning, and Experiments then returns to this overlapping generations economy with two currencies, where the rational expectations equilibria form a continuum and the limit of learning depends on where beliefs start.
Further ahead, Money as a Medium of Exchange among Artificially Intelligent Agents takes the selection question to a setting where the competing equilibria are not high and low inflation but different monetary institutions: which good becomes money.
91.7. Exercises#
Exercise 91.1
Because agents learn a separate saving rate for each deficit state, they can only learn about a state as fast as that state occurs.
Compare two economies with \(\bar G = (0.8, 0)\) that differ only in the transition matrix: one where the two states are equally likely, and one where the high-deficit state is rare.
For each, compute the stationary equilibrium, run the learning simulation for 30,000 periods, and report how far each state’s learned saving rate is from its target along with how often that state was visited.
A single run can mislead, so repeat the comparison across 20 seeds.
Solution
For each chain we record, in every run, the error of each state’s learned rule (averaged over the two classes) and the number of periods spent in each state.
G_ex = np.array([0.8, 0.0])
cases = {"equally likely": np.array([[0.5, 0.5], [0.5, 0.5]]),
         "high deficit rare": np.array([[0.5, 0.5], [0.03, 0.97]])}
seeds = range(20)

rows, ratios = [], {}
for name, P in cases.items():
    s_star, _ = stationary_equilibrium(G_ex, P)
    errors, visits = [], []
    for seed in seeds:
        hist, states = simulate(G_ex, P, T=30_000, s0=start, seed=seed)
        errors.append(np.abs(hist[-1].mean(axis=0) - s_star))
        visits.append(np.bincount(states, minlength=2))
    errors, visits = np.array(errors), np.array(visits)
    rmse = np.sqrt(np.mean(errors**2, axis=0))
    ratios[name] = errors[:, 0] / errors[:, 1]
    for k in (0, 1):
        rows.append([name, k+1, visits[:, k].mean(), s_star[k], rmse[k]])

display(pd.DataFrame(rows, columns=["chain", "state", "visits (mean over seeds)",
                                    "equilibrium $s_i$", "RMS error over seeds"]
                     ).set_index(["chain", "state"]).round(4))

for name, r in ratios.items():
    print(f"{name:18s}: error ratio state 1 / state 2 across seeds: "
          f"median {np.median(r):.1f}, range {r.min():.1f} to {r.max():.1f}, "
          f"state 1 worse in {np.sum(r > 1)} of {len(r)} seeds")
| visits (mean over seeds) | equilibrium $s_i$ | RMS error over seeds | ||
|---|---|---|---|---|
| chain | state | |||
| equally likely | 1 | 15001.05 | 4.4965 | 0.0053 |
| 2 | 14998.95 | 4.4965 | 0.0051 | |
| high deficit rare | 1 | 1707.65 | 4.6828 | 0.0108 |
| 2 | 28292.35 | 4.9646 | 0.0015 |
equally likely    : error ratio state 1 / state 2 across seeds: median 0.8, range 0.0 to 181.2, state 1 worse in 9 of 20 seeds
high deficit rare : error ratio state 1 / state 2 across seeds: median 9.1, range 0.2 to 39.8, state 1 worse in 15 of 20 seeds
When the two states are equally likely the chain is IID, so both states face the same distribution of future returns and the equilibrium has \(s_1 = s_2\).
Each state is visited about half the time, and the two rules are learned about equally well.
When the high-deficit state is rare it is visited only about 6 percent of the time, roughly 1,700 periods out of 30,000, and the root-mean-square error in its rule is several times that of the common state, even though both have had 30,000 periods of calendar time to settle.
The ratio is large in most runs but varies a good deal from seed to seed, which is why a single run is a poor basis for the comparison.
Sargent’s comment is worth keeping in mind: in terms of unconditional expected utility, failing to learn what to do in a rarely visited state may cost very little.
The cost of slow learning is not proportional to the size of the error.
Note also that changing the transition matrix changes the equilibrium itself — beliefs about the persistence of deficits feed straight into (91.5) — so the comparison has to be against a separately recomputed target for each chain.
Exercise 91.2
In a stochastic environment, the declining gain \(\gamma_\tau = 1/(\tau + 20)\) is what makes (91.6) converge.
An agent who suspected the environment might be drifting would use a constant gain instead, weighting recent experience more heavily forever.
Use the gain argument of simulate to give the agents a constant gain, and describe what
happens to the limiting behavior of the saving rules.
Compare gains of \(0.02\) and \(0.005\) against the declining-gain benchmark, in both economy 1 and economy 2.
Solution
For each economy and gain we average the last 5,000 periods of the rules (over the two classes), and report the mean error relative to equilibrium and the standard deviation.
rows, paths = [], {}
for G, P, s_star, econ in [(G1, P1, s1, "economy 1"), (G2, P2, s2, "economy 2")]:
    for label, gain in [("0.02", 0.02), ("0.005", 0.005), ("1/(τ+20)", None)]:
        hist, _ = simulate(G, P, T=30_000, s0=start, gain=gain)
        paths[econ, label] = hist[:, 0, 0]
        tail = hist[-5_000:].mean(axis=1)        # average the two classes
        rows.append([econ, label,
                     *[f"{e:.1e}" for e in tail.mean(axis=0) - s_star],
                     *[f"{d:.1e}" for d in tail.std(axis=0)]])

pd.DataFrame(rows, columns=["economy", "gain", "mean error $s_1$", "mean error $s_2$",
                            "s.d. $s_1$", "s.d. $s_2$"]).set_index(["economy", "gain"])
| mean error $s_1$ | mean error $s_2$ | s.d. $s_1$ | s.d. $s_2$ | ||
|---|---|---|---|---|---|
| economy | gain | ||||
| economy 1 | 0.02 | -8.9e-16 | -8.9e-16 | 2.2e-14 | 2.2e-14 |
| 0.005 | -4.4e-15 | -4.4e-15 | 8.3e-14 | 8.3e-14 | |
| 1/(τ+20) | 1.7e-04 | 1.6e-04 | 9.3e-06 | 8.2e-06 | |
| economy 2 | 0.02 | -2.9e-03 | 2.2e-02 | 3.7e-02 | 3.9e-02 |
| 0.005 | 2.5e-03 | 2.1e-02 | 1.8e-02 | 1.6e-02 | |
| 1/(τ+20) | 9.1e-03 | 1.0e-02 | 1.1e-03 | 1.8e-03 |
The figure follows the even class’s rule for state 1 in economy 2.
fig, ax = plt.subplots(figsize=(8, 4))
for label, colour, lw in [("0.02", 'C1', 0.7), ("0.005", 'C2', 0.7), ("1/(τ+20)", 'C0', 1.2)]:
    ax.plot(paths["economy 2", label], color=colour, lw=lw, label=f"gain = {label}")
ax.axhline(s2[0], color='k', lw=0.8, ls='--', label="equilibrium")
ax.set_xlim(0, 30_000)
ax.set_ylim(3.8, 5.0)
ax.set_xlabel("$t$")
ax.set_ylabel("saving rate, state 1")
ax.legend(frameon=False, fontsize=9)
plt.show()
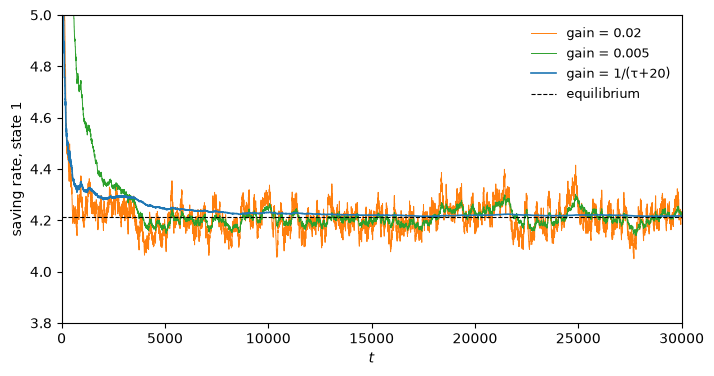
In economy 2 the constant-gain rules do not converge.
They settle into a neighborhood of the equilibrium and then keep rattling around inside it forever, because each new observation is always given the same weight and so never stops moving the estimate.
Shrinking the gain tightens the band but does not eliminate it.
In economy 1, by contrast, the constant-gain rules converge to the equilibrium to machine precision, and faster than the declining-gain rule.
Nothing random hits the agents at that equilibrium: with no deficit, \(R \equiv 1\) in every state, so once the rules are right every observation confirms them.
So the correct statement is conditional.
When there are intrinsic shocks at the equilibrium, only a gain that declines to zero delivers convergence to a point, which is why the convergence theorems for these systems require it.
Without such shocks a constant gain converges too, and quickly.
The table also shows the price of a declining gain in economy 2.
After 30,000 periods the \(1/(\tau + 20)\) rule is still about \(0.01\) above the equilibrium in both states, and since its standard deviation is several times smaller, that error is bias: the rule has not yet arrived.
The constant-gain rules, by contrast, wander around the equilibrium with standard deviations of about \(0.02\) to \(0.04\), slowly enough that even a 5,000-period average can sit a couple of hundredths away from it.
What the constant-gain agent buys in exchange for its permanent noise is speed and adaptability: if the deficit process were to change, the declining-gain agent would barely notice, while the constant-gain agent would track the change.
That trade-off reappears throughout this literature, and in the Phillips curve application above.
Exercise 91.3
Economy 2 has a second, high-inflation stationary equilibrium, s2_hi, computed above.
In the simulations of Fig. 91.1 the projection facility keeps state 1’s saving above \(\bar G_1 + 0.4 = 1.2\), which already rules it out, since its \(s_1\) is below \(1.2\).
Lower the projection band to \(0.01\), start both classes at the high-inflation equilibrium, and run the learning economy for 20,000 periods with 20 different seeds. Where do the saving rules go, and how often does the projection facility bind?
Explain the result with the associated ordinary differential equation. When both classes use the rule \(s\), the average Newton step in state \(i\) is \(-E_i U'(s_i) / E_i U''(s_i)\), where \(E_i\) averages over next period’s state with the returns \(R(i, j) = (N s_j - \bar G_j)/(N s_i)\). Compute the eigenvalues of the Jacobian of this map at both equilibria.
Solution
We start every run exactly at the high-inflation equilibrium and record where the rules (averaged over the two classes) end up, and whether state 1’s rule ever hits the floor \(\bar G_1 + 0.01\).
band = 0.01
floor_1 = G2[0]/N + band
final, hit_floor = [], []
for seed in range(20):
    hist, _ = simulate(G2, P2, T=20_000, s0=np.tile(s2_hi, (2, 1)), seed=seed, band=band)
    final.append(hist[-1].mean(axis=0))
    hit_floor.append(np.any(np.isclose(hist[:, :, 0], floor_1)))
final, hit_floor = np.array(final), np.array(hit_floor)
climbed = final[:, 0] > s2_hi[0] + 1

print(f"climbed toward the low-inflation equilibrium:  {climbed.sum()} of 20 runs,"
      f"  mean final rule {np.round(final[climbed].mean(axis=0), 3)}")
print(f"fell to the projection floor:                  {(~climbed).sum()} of 20 runs,"
      f"  mean final rule {np.round(final[~climbed].mean(axis=0), 3)}")
print(f"hit the floor at least once:                   {hit_floor.sum()} of 20 runs")
print(f"low-inflation equilibrium:                     {np.round(s2, 3)}")
climbed toward the low-inflation equilibrium:  15 of 20 runs,  mean final rule [4.096 4.254]
fell to the projection floor:                  5 of 20 runs,  mean final rule [0.81  0.348]
hit the floor at least once:                   12 of 20 runs
low-inflation equilibrium:                     [4.211 4.364]
Learning never stays at the high-inflation equilibrium, even when it starts exactly there.
Most runs climb toward the low-inflation equilibrium, covering most of the distance in 20,000 periods and still climbing.
The rest go the other way: state 1’s rule falls to the floor, where saving barely covers the deficit, and state 2’s rule sinks far below its starting point.
Without the projection facility those economies would end, and many of the runs that eventually climb also touch the floor on the way.
The mean dynamics explain both outcomes.
def mean_newton_step(s, G, P):
    "Average Newton step -E_i U'/E_i U'' in each state when both classes use the rule s."
    R = (N*s[None, :] - G[None, :]) / (N*s[:, None])
    EU1 = (P * U_prime(s[:, None], R)).sum(axis=1)
    EU2 = (P * U_double(s[:, None], R)).sum(axis=1)
    return -EU1 / EU2

def jacobian(f, x, h=1e-6):
    J = np.empty((len(x), len(x)))
    for k in range(len(x)):
        e = np.zeros(len(x))
        e[k] = h
        J[:, k] = (f(x + e) - f(x - e)) / (2*h)
    return J

for s_eq, name in [(s2, "low inflation "), (s2_hi, "high inflation")]:
    eig = np.linalg.eigvals(jacobian(lambda s: mean_newton_step(s, G2, P2), s_eq))
    print(f"{name} equilibrium {np.round(s_eq, 4)}:  eigenvalues {np.round(np.sort(eig.real), 3)}")
low inflation  equilibrium [4.2111 4.3637]:  eigenvalues [-1.948 -0.795]
high inflation equilibrium [1.1896 1.6343]:  eigenvalues [-3.696  3.263]
At the low-inflation equilibrium both eigenvalues are negative, so it is a stable rest point of the associated differential equation.
At the high-inflation equilibrium one eigenvalue is positive: it is a saddle, and the noise in realized returns pushes the rules off it along the unstable direction, which leads up toward the low-inflation equilibrium on one side and down toward collapse on the other.
This is Part 2’s stability reversal in a stochastic economy: as with \(\pi_{\text{high}}\) there, the high-inflation equilibrium is the boundary between convergence to the low-inflation equilibrium and the end of the monetary economy.
Learning by itself excludes the high-inflation equilibrium; the projection facility matters on the downside, where it keeps collapsing economies alive.
Exercise 91.4
The claim that the high-inflation steady state sits on “the wrong side of a Laffer curve” can be made precise.
In a stationary equilibrium with gross inflation \(\pi\), real balances are \(h = (w_1 - w_2\pi)/2\) and the government collects seigniorage \(h(1 - 1/\pi)\).
Plot seigniorage as a function of \(\pi\), mark the two stationary equilibria, and use the picture to explain why raising \(G\) raises the low stationary inflation rate but lowers the high one, and what happens when \(G\) gets too large.
Solution
Here is the inflation-tax Laffer curve for Economy 7C.
def seigniorage(π):
    return (w1_d - w2_d*π)/2 * (1 - 1/π)

π_grid = np.linspace(1.01, 5.5, 500)
peak = π_grid[np.argmax(seigniorage(π_grid))]

fig, ax = plt.subplots(figsize=(7.5, 4.5))
ax.plot(π_grid, seigniorage(π_grid), lw=1.6)
for G_try, style in [(1.0, '-'), (1.03, '--'), (1.0505, ':')]:
    ax.axhline(G_try, color='C3', lw=0.9, ls=style, label=f"$G = {G_try}$")
ax.plot([π_low, π_high], [seigniorage(π_low), seigniorage(π_high)], 'ko', ms=6)
ax.axvline(peak, color='gray', lw=0.8, ls=':')
ax.set_xlabel(r"gross inflation $\pi$")
ax.set_ylabel("seigniorage")
ax.set_ylim(0, 1.5)
ax.legend(frameon=False)
plt.show()

print(f"peak of the Laffer curve at π = {peak:.4f}, raising {seigniorage(peak):.4f}")
print(f"the two steady states raise {seigniorage(π_low):.4f} and {seigniorage(π_high):.4f}")
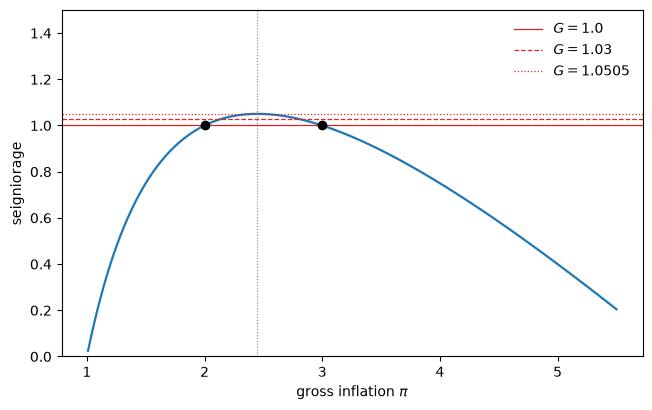
peak of the Laffer curve at π = 2.4497, raising 1.0505
the two steady states raise 1.0000 and 1.0000
The two stationary equilibria are the two inflation rates at which the inflation-tax Laffer curve crosses the required revenue \(G\), one on each side of the peak.
The low one sits on the rising branch, so financing a larger deficit there requires more inflation: the classical comparative static.
The high one sits on the falling branch, where more inflation raises less revenue, so a larger deficit is financed by a lower stationary inflation rate, the anti-classical comparative static that makes the high equilibrium so awkward.
As \(G\) rises the horizontal line moves up and the two intersections converge.
Past the peak of the curve there is no stationary equilibrium at all: the deficit exceeds the maximum revenue the inflation tax can raise.
The table tracks the two roots as \(G\) rises.
rows = []
for G_try in (0.8, 1.0, 1.04, 1.05, 1.0505, 1.06):
    A1_try = (w1_d + w2_d - 2*G_try)/w2_d
    disc = A1_try**2 - 4*A2
    if disc < 0:
        rows.append([G_try, np.nan, np.nan, "none"])
    else:
        r = np.sort(np.roots([1, -A1_try, A2]))
        rows.append([G_try, r[0], r[1], "two"])

pd.DataFrame(rows, columns=["$G$", "low $\\pi$", "high $\\pi$",
                            "stationary equilibria"]).round(4)
| $G$ | low $\pi$ | high $\pi$ | stationary equilibria | |
|---|---|---|---|---|
| 0 | 0.8000 | 1.5642 | 3.8358 | two |
| 1 | 1.0000 | 2.0000 | 3.0000 | two |
| 2 | 1.0400 | 2.2328 | 2.6872 | two |
| 3 | 1.0500 | 2.4000 | 2.5000 | two |
| 4 | 1.0505 | 2.4424 | 2.4566 | two |
| 5 | 1.0600 | NaN | NaN | none |
The two roots move toward each other as \(G\) rises and collide at \(G \approx 1.0505\), after which the model has no stationary equilibrium at all.
That number is not a coincidence.
Setting the discriminant of (91.8)’s fixed-point equation to zero gives a double root at \(\pi = \sqrt{A_2} = \sqrt{w_1/w_2}\), and the deficit at which it occurs is exactly the peak of the Laffer curve computed above.
G_max = (w1_d + w2_d - 2*np.sqrt(A2)*w2_d) / 2
print(f"roots collide at G       = {G_max:.6f},  where π = √(w1/w2) = {np.sqrt(A2):.6f}")
print(f"peak of the Laffer curve = {seigniorage(np.sqrt(A2)):.6f}  at π = {np.sqrt(A2):.6f}")
roots collide at G       = 1.050510,  where π = √(w1/w2) = 2.449490
peak of the Laffer curve = 1.050510  at π = 2.449490
The largest deficit the government can finance is the maximum of the inflation tax, and at that deficit the two stationary equilibria have merged into one.
Exercise 91.5
This exercise brings the bubbles of The bubble into Part 2’s model.
Set \(G = 0\), keeping \(w_1 = 6\) and \(w_2 = 1\).
Show that the stationary inflation rates are \(\pi = 1\) and \(\pi = w_1/w_2 = 6\), and identify them with equilibria of A Peculiar Definition of Bounded Rationality’s money model with a constant money supply.
Show that the \(T\)-map (91.9) is constant, and say what that implies for least squares learning.
Run
ls_dynamicswithG=0from several initial beliefs below 6, and compare with the rational expectations paths from the same starting points. Which bubble does a society of least squares learners select?
Solution
With \(G = 0\), \(A_1 = 1 + w_1/w_2\) and \(A_2 = w_1/w_2\), so the fixed-point equation \(\pi^2 - A_1 \pi + A_2 = 0\) factors as \((\pi - 1)(\pi - w_1/w_2) = 0\).
With no deficit the money supply is constant, so this is A Peculiar Definition of Bounded Rationality’s money model with \(\mu = 1\).
There, \(\pi = 1\) is the quantity-theory equilibrium \(c = 0\), in which the price level is proportional to the (constant) money supply, and \(\pi = w_1/w_2\) is the inflation rate that every bubble path with \(c > 0\) approaches as real balances shrink to zero.
At \(\pi = w_1/w_2\) saving is \((w_1 - w_2\pi)/2 = 0\), so it is the limit of a demonetizing economy, not a monetary steady state.
With \(G = 0\) the \(T\)-map is \(T(\beta) = s(\beta)/s(\beta) = 1\) for every belief that leaves saving positive: if agents expected any constant inflation rate, they would save a constant amount, and a constant stock of money chasing constant real balances means a constant price level.
So the differential equation for beliefs is \(d\beta/d\tau = 1 - \beta\), and least squares beliefs should converge to \(1\) from anywhere below \(6\).
print("T-map at G = 0:", [T_map(β, G=0.0) for β in (0.5, 2.0, 4.0, 5.9)])

def re_path_G0(π0, T=25):
    "Rational expectations path π_{t+1} = A1 - A2/π_t with G = 0."
    A1_0, A2_0 = (w1_d + w2_d) / w2_d, w1_d / w2_d
    path = [π0]
    for _ in range(T):
        nxt = A1_0 - A2_0/path[-1]
        path.append(nxt if path[-1] > 0 and nxt > 0 else np.nan)
    return np.array(path)

dates = (10, 100, 1_000, 20_000)
rows = []
for π0 in (0.5, 1.5, 3.0, 5.0, 5.9):
    b, infl, ok = ls_dynamics(π0, T=dates[-1], G=0.0)
    rows.append([π0, "yes" if ok else "no", *b[[d - 1 for d in dates]],
                 re_path_G0(π0)[-1]])

pd.DataFrame(rows, columns=["initial belief $\\pi_0$", "survived",
                            *[f"belief at t = {d:,}" for d in dates],
                            "RE inflation at t = 25"]).set_index("initial belief $\\pi_0$").round(4)
T-map at G = 0: [1.0, 1.0, 1.0, 1.0]
| survived | belief at t = 10 | belief at t = 100 | belief at t = 1,000 | belief at t = 20,000 | RE inflation at t = 25 | |
|---|---|---|---|---|---|---|
| initial belief $\pi_0$ | ||||||
| 0.5 | yes | 0.8586 | 0.9843 | 0.9984 | 0.9999 | NaN |
| 1.5 | yes | 1.0155 | 1.0015 | 1.0002 | 1.0000 | 6.0 |
| 3.0 | yes | 0.9628 | 0.9954 | 0.9995 | 1.0000 | 6.0 |
| 5.0 | yes | 0.7225 | 0.8876 | 0.9846 | 0.9992 | 6.0 |
| 5.9 | yes | 0.5871 | 0.5932 | 0.6466 | 0.9117 | 6.0 |
From every starting point below \(6\), least squares beliefs head to \(\pi = 1\): the learners select \(c = 0\), and learning kills the bubble.
Convergence is slow, though, and slowest from high initial beliefs.
Without inflation the price level stops growing, so least squares weights observations roughly equally and its gain falls like \(1/t\), unlike the large effective gain we found in Part 2.
And from a belief near \(6\) the first realized inflation rate is exactly \(1\), which pulls the belief down at once, and the second is a deep deflation: saving jumps up from almost nothing, the price level collapses, and the early observations, taken at high price levels, dominate the regression for thousands of periods.
The rational expectations paths from the same starting points above \(1\) do the opposite: they are bubble paths, and inflation rises toward \(w_1/w_2 = 6\).
(From a starting point below \(1\) the rational expectations path has no positive price level.)
The sign result of Exercise 91.6 does not apply at \(\pi = 6\), where saving is zero and the \(T\)-map is undefined.
Exercise 91.6
This exercise proves that the stability reversal of The stability reversal is a theorem about the model, not a property of Economy 7C’s parameters.
Let \(F(x) = x^2 - A_1 x + A_2\), so that the stationary inflation rates are the roots of \(F\), and let \(s(\beta) = (w_1 - w_2\beta)/2\).
Show that \(g(\pi) - \pi = -F(\pi)/\pi\) and \(T(\beta) - \beta = \dfrac{w_2}{2}\,\dfrac{F(\beta)}{s(\beta) - G}\).
Deduce that at every steady state with positive saving, \(\operatorname{sign}(T' - 1) = -\operatorname{sign}(g' - 1)\). Conclude that whenever there are two such steady states, the lower one is E-stable and unstable under the rational expectations dynamics, and the higher one is the reverse.
Check the result numerically for randomly drawn \((w_1, w_2, G)\) with two steady states.
Solution
For the first identity,
For the second,
and
At a steady state \(\pi^*\) we have \(F(\pi^*) = 0\), so differentiating the two identities gives
If saving is positive at the steady state, then \(\pi^* = s/(s - G) > 0\) forces \(s - G > 0\), so both denominators are positive and
\(F\) is an upward-opening parabola, so \(F' < 0\) at its smaller root and \(F' > 0\) at its larger one.
At \(\pi_{\text{low}}\), therefore, \(T' < 1\) (E-stable) and \(g' > 1\) (unstable under rational expectations, since \(g' = A_2/\pi^2 > 0\)); at \(\pi_{\text{high}}\), \(T' > 1\) and \(g' < 1\).
When the two roots merge, at the largest financeable deficit of Exercise 91.4, \(F' = 0\) and both slopes equal one.
Here is a numerical check, using \(T'(\beta) = (w_2/2)\,G/(s(\beta) - G)^2\) and \(g'(\pi) = A_2/\pi^2\).
rng = np.random.default_rng(0)
checked = 0
while checked < 1_000:
    w2_r = rng.uniform(0.5, 5)
    w1_r = w2_r * rng.uniform(1.1, 10)               # w1 > w2
    G_r = rng.uniform(0, (np.sqrt(w1_r) - np.sqrt(w2_r))**2 / 2)   # below the largest deficit
    A1_r, A2_r = (w1_r + w2_r - 2*G_r) / w2_r, w1_r / w2_r
    for π_star in np.roots([1, -A1_r, A2_r]).real:
        s = (w1_r - w2_r*π_star) / 2
        T_slope = (w2_r/2) * G_r / (s - G_r)**2
        g_slope = A2_r / π_star**2
        assert s > G_r and np.sign(T_slope - 1) == -np.sign(g_slope - 1)
    checked += 1
print(f"sign(T' - 1) = -sign(g' - 1) at both steady states in all {checked} economies")
sign(T' - 1) = -sign(g' - 1) at both steady states in all 1000 economies
Exercise 91.7
Chung [1990] estimated the government’s learning rule itself: he treated the parameters of the government’s Kalman filter as free parameters of a likelihood function for post-war U.S. data on inflation and unemployment.
Here is a stripped-down version of his problem.
Simulate 16,000 periods of \((\pi_t, U_t)\) from constant_gain with gain \(0.02\).
Suppose an econometrician knows everything about the model except the gain: \(\theta\), \(U^*\), \(\sigma_\eta\), \(\sigma_u\), and the government’s initial beliefs and moment matrix.
Explain why, for any candidate gain \(\gamma\), the econometrician can reconstruct the government’s beliefs and target inflation \(g_{t-1}(\gamma)\) from the data.
Using the first \(T\) observations, compute the Gaussian log likelihood of inflation, \(\ell_T(\gamma) = -\sum_{t \le T} (\pi_t - g_{t-1}(\gamma))^2 / (2\sigma_\eta^2)\) up to a constant, on a grid of gains around \(0.02\), for \(T\) = 250, 1,000, 4,000 and 16,000. How does the shape of \(\ell_T\) change as \(T\) grows?
Why does information about the gain keep accumulating?
Solution
The government’s beliefs are a deterministic function of the data: given the initial beliefs and moment matrix, the recursion that updates \((\alpha_t, M_t)\) uses only the observed \((\pi_t, U_t)\) and the gain.
So for each candidate gain the econometrician can rerun the government’s recursion on the data and read off the targets \(g_{t-1}(\gamma)\) from (91.13).
The function below does this for a whole grid of gains at once.
def reconstruct_targets(π, U, gains):
    """
    Target inflation g_{t-1}(γ) that a government with gain γ would have chosen,
    reconstructed from data on (π_t, U_t), for each candidate γ in `gains`.
    """
    gains = np.asarray(gains)
    K = len(gains)
    α = np.tile(α_consistent, (K, 1))
    M = np.tile(np.eye(2), (K, 1, 1))
    targets = np.empty((len(π), K))
    for t in range(len(π)):
        targets[t] = -α[:, 0] * α[:, 1] / (1 + α[:, 1]**2)
        x = np.array([1.0, π[t]])
        M = M + gains[:, None, None] * (np.outer(x, x) - M)
        err = U[t] - α @ x
        step = np.linalg.solve(M, (err[:, None] * x)[:, :, None])[:, :, 0]
        α = α + gains[:, None] * step
    return targets

true_gain = 0.02
g_true, π_data, U_data = constant_gain(T=16_000, gain=true_gain, seed=1)
gains = np.round(np.linspace(0.017, 0.023, 61), 6)    # includes 0.02 exactly
targets = reconstruct_targets(π_data, U_data, gains)
print(f"largest error in reconstructed targets at the true gain: "
      f"{np.max(np.abs(targets[:, 30] - g_true)):.1e}")
print(f"first period with target inflation below 1: {np.argmax(g_true < 1)}")
largest error in reconstructed targets at the true gain: 8.9e-16
first period with target inflation below 1: 307
Now the log likelihood, normalized to zero at its maximum, for four sample sizes.
fig, ax = plt.subplots(figsize=(8, 4.5))
rows = []
for T in (250, 1_000, 4_000, 16_000):
    ssr = np.sum((π_data[:T, None] - targets[:T])**2, axis=0)
    loglik = -ssr / (2 * σ_η**2)
    loglik -= loglik.max()
    ax.plot(gains, loglik, label=f"$T = {T:,}$")
    rows.append([T, gains[np.argmax(loglik)], loglik[20], loglik[40]])
ax.axvline(true_gain, color='k', lw=0.8, ls=':')
ax.set_ylim(-60, 3)
ax.set_xlabel(r"candidate gain $\gamma$")
ax.set_ylabel(r"$\ell_T(\gamma) - \max_\gamma \ell_T$")
ax.legend(frameon=False)
plt.show()

pd.DataFrame(rows, columns=["T", "maximizing gain",
                            f"drop at γ = {gains[20]:.3f}",
                            f"drop at γ = {gains[40]:.3f}"]).set_index("T").round(4)
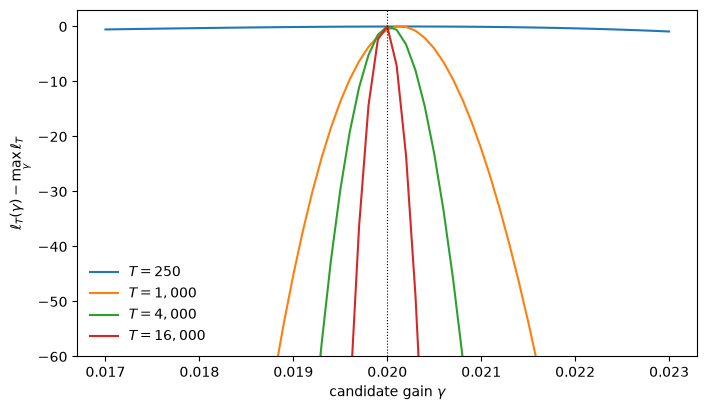
| maximizing gain | drop at γ = 0.019 | drop at γ = 0.021 | |
|---|---|---|---|
| T | |||
| 250 | 0.0202 | -0.0980 | -0.0601 |
| 1000 | 0.0201 | -45.1487 | -22.2241 |
| 4000 | 0.0200 | -118.9857 | -93.1558 |
| 16000 | 0.0200 | -488.2670 | -462.3829 |
At the true gain the reconstructed targets equal the actual ones, so the residuals are exactly the surprises \(\eta_t\).
Any other gain implies a different history of beliefs and targets, and the log likelihood penalizes it.
With 250 observations the likelihood is nearly flat.
The sample ends before the first escape, and while beliefs sit near the self-confirming equilibrium they hardly move whatever the gain, so the data say little about it.
Once escapes begin, the likelihood becomes sharply peaked at the true gain, and the drop at a fixed wrong gain keeps growing with \(T\), roughly in proportion to \(T\) in the later samples.
Information about the gain keeps accumulating because a constant gain never stops shaping beliefs: every period the government responds to its newest observations with the same weight, so every period carries fresh evidence about that weight, and most of it arrives during escapes, when beliefs move a lot.
With a decreasing gain the influence of the gain’s parameters on beliefs would die away, and so would the information about them; 1993 Prospects for Bounded Rationality in Macroeconomics takes up this contrast.
Chung’s problem was harder than this one: he also estimated \(\theta\), \(U^*\), the shock variances and the government’s prior, from a few decades of quarterly data rather than thousands of periods.