33. Bayesian versus Frequentist Decision Rules#
import matplotlib.pyplot as plt
import numpy as np
from numba import jit, prange, float64, int64
from numba.experimental import jitclass
from math import gamma
from scipy.integrate import quad
33.1. Overview#
This lecture follows up on ideas presented in the following lectures:
A Problem that Stumped Milton Friedman described a problem that a Navy Captain presented to Milton Friedman during World War II.
The Navy had told the Captain to use a decision rule for comparing two designs of an ordnance device by firing test rounds.
In particular, the Navy had ordered the Captain to use an instance of a frequentist decision rule.
The Captain doubted that that rule was a good one.
Milton Friedman recognized the Captain’s conjecture as posing a challenging statistical problem that he and other members of the US Government’s Statistical Research Group at Columbia University proceeded to try to solve.
A member of the group, the great mathematician and economist Abraham Wald, soon solved the problem.
A good way to formulate the problem is to use some ideas from Bayesian statistics that we describe in Exchangeability and Bayesian Updating and in the section on likelihood ratio processes and Bayes’ law of Likelihood Ratio Processes and Bayesian Learning, which describes the link between Bayesian updating and likelihood ratio processes.
The present lecture uses Python to generate simulations that evaluate expected losses under the Neyman-Pearson frequentist procedure that the Navy captain questioned and the Bayesian decision rule described in A Bayesian Formulation of Friedman and Wald’s Problem.
We choose the frequentist rule’s sample size and cutoff to minimize expected loss under the prior probability and losses that the Bayesian uses.
The frequentist rule then becomes a Bayes rule whose sample size is fixed in advance.
The Bayesian rule chooses its sample size sequentially.
A rule with a fixed sample size is a special sequential rule, so the best sequential rule has an expected loss no larger than the best fixed-sample rule.
Wald and Wolfowitz [1948] proved that, among all tests with given probabilities of type I and type II errors, Wald’s sequential probability ratio test minimizes the expected number of draws under both hypotheses.
Arrow et al. [1949] showed how to compute Bayes solutions of sequential decision problems by backward induction.
Our simulations illustrate these theorems and measure how much the Navy Captain’s hunch was worth.
33.2. Setup#
To formalize the problem that had confronted the Navy Captain, we consider a setting with the following parts.
Each period a decision maker draws a non-negative random variable \(Z\). He knows that two probability distributions are possible, \(f_{0}\) and \(f_{1}\), and that which ever distribution it is remains fixed over time. The decision maker believes that before the beginning of time, nature once and for all had selected either \(f_{0}\) or \(f_1\) and that the probability that it selected \(f_0\) is probability \(\pi^{*}\).
The decision maker observes a sample \(\left\{ z_{i}\right\} _{i=1}^{t}\) from the distribution chosen by nature.
The decision maker wants to decide which distribution actually governs \(Z\).
He is worried about two types of errors and the losses that they will impose on him.
a loss \(\bar L_{1}\) from a type I error that occurs if he decides that \(f=f_{1}\) when actually \(f=f_{0}\)
a loss \(\bar L_{0}\) from a type II error that occurs if he decides that \(f=f_{0}\) when actually \(f=f_{1}\)
The decision maker pays a cost \(c\) for drawing another \(z\).
Note
This lecture lets \(\pi\) denote the probability of \(f_0\) and defines the likelihood ratio as \(L = f_0/f_1\).
Under this convention, high values of \(\pi\) and of \(L\) favor \(f_0\), and the Bayesian decision maker accepts \(f_0\) when \(\pi \geq A\).
A Bayesian Formulation of Friedman and Wald’s Problem lets \(\pi\) denote the probability of \(f_1\); its decision maker accepts \(f_1\) when \(\pi \geq A\).
A Problem that Stumped Milton Friedman defines the likelihood ratio as \(f_1/f_0\).
We rewrite the code that we borrow from A Bayesian Formulation of Friedman and Wald’s Problem for our convention: \(\pi\) and \(1-\pi\) trade places in the Bayes update \(\kappa\), in the expected losses from stopping, and in the Bellman operator Q.
We mainly borrow parameters from the quantecon lecture A Bayesian Formulation of Friedman and Wald’s Problem except that we increase both \(\bar L_{0}\) and \(\bar L_{1}\) from \(25\) to \(100\) to encourage the Bayesian decision rule to take more draws before deciding.
We set the cost \(c\) of taking one more draw at \(1.25\).
We set the probability distributions \(f_{0}\) and \(f_{1}\) to be beta distributions with \(a_{0}=b_{0}=1\), \(a_{1}=3\), and \(b_{1}=1.2\), respectively.
Below is some Python code that sets up these objects.
@jit
def p(x, a, b):
    "Beta distribution."

    r = gamma(a + b) / (gamma(a) * gamma(b))

    return r * x**(a-1) * (1 - x)**(b-1)
We start with defining a jitclass that stores parameters and
functions we need to solve problems for both the Bayesian and
frequentist Navy Captains.
wf_data = [
    ('c', float64),           # cost of drawing another z
    ('a0', float64),          # parameters of beta distribution
    ('b0', float64),
    ('a1', float64),
    ('b1', float64),
    ('L0', float64),          # cost of selecting f0 when f1 is true
    ('L1', float64),          # cost of selecting f1 when f0 is true
    ('π_grid', float64[:]),   # grid of beliefs π
    ('π_grid_size', int64),
    ('mc_size', int64),       # size of Monte Carlo simulation
    ('z0', float64[:]),       # sequence of random values
    ('z1', float64[:])        # sequence of random values
]
@jitclass(wf_data)
class WaldFriedman:

    def __init__(self,
                 c=1.25,
                 a0=1,
                 b0=1,
                 a1=3,
                 b1=1.2,
                 L0=100,
                 L1=100,
                 π_grid_size=200,
                 mc_size=1000):

        self.c, self.π_grid_size = c, π_grid_size
        self.a0, self.b0, self.a1, self.b1 = a0, b0, a1, b1
        self.L0, self.L1 = L0, L1
        self.π_grid = np.linspace(0, 1, π_grid_size)
        self.mc_size = mc_size

        self.z0 = np.random.beta(a0, b0, mc_size)
        self.z1 = np.random.beta(a1, b1, mc_size)

    def f0(self, x):

        return p(x, self.a0, self.b0)

    def f1(self, x):

        return p(x, self.a1, self.b1)

    def κ(self, z, π):
        """
        Updates π using Bayes' rule and the current observation z
        """

        a0, b0, a1, b1 = self.a0, self.b0, self.a1, self.b1

        π_f0, π_f1 = π * p(z, a0, b0), (1 - π) * p(z, a1, b1)
        π_new = π_f0 / (π_f0 + π_f1)

        return π_new
The constructor of WaldFriedman draws mc_size Monte Carlo values of \(z\) from each density with numba’s random number generator.
Calling np.random.seed from Python does not seed numba’s generator.
We seed it inside a jitted function.
@jit
def seed_numba(seed):
    "Seed the random number generator used by numba-compiled code."
    np.random.seed(seed)

seed_numba(1234)
wf = WaldFriedman()

grid = np.linspace(0, 1, 50)

plt.figure()

plt.title("Two Distributions")
plt.plot(grid, wf.f0(grid), lw=2, label="$f_0$")
plt.plot(grid, wf.f1(grid), lw=2, label="$f_1$")

plt.legend()
plt.xlabel("$z$ values")
plt.ylabel("density of $z_k$")

plt.tight_layout()
plt.show()
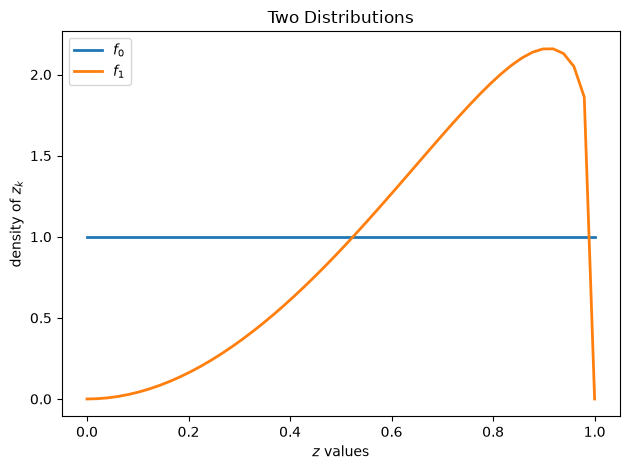
Above, we plot the two possible probability densities \(f_0\) and \(f_1\)
33.3. Frequentist Decision Rule#
The Navy told the Captain to use a Neyman-Pearson likelihood ratio decision rule.
That decision rule is characterized by
a sample size \(t\), and
a cutoff value \(d\) of a likelihood ratio
Let \(L\left(z^{t}\right)=\prod_{i=1}^{t}\frac{f_{0}\left(z_{i}\right)}{f_{1}\left(z_{i}\right)}\) be the likelihood ratio associated with observing the sequence \(\left\{ z_{i}\right\} _{i=1}^{t}\).
The decision rule associated with a sample size \(t\) is:
decide that \(f_0\) is the distribution if the likelihood ratio is greater than \(d\)
decide that \(f_1\) is the distribution if the likelihood ratio is less than \(d\)
For our purposes here, we want to compute an expected loss from using this rule, where we borrow
loss parameters \(\bar L_0\) and \(\bar L_1\) from A Bayesian Formulation of Friedman and Wald’s Problem.
Let null and alternative hypotheses be
null: \(H_{0}\): \(f=f_{0}\),
alternative \(H_{1}\): \(f=f_{1}\).
Given sample size \(t\) and cutoff \(d\), under the model described above, the mathematical expectation of total loss is
Here
\(PFA\) denotes the probability of a false alarm, i.e., rejecting \(H_0\) when it is true
\(PD\) denotes the probability of detection, i.e., rejecting \(H_0\) when \(H_1\) is true (the power of the test); \(1 - PD\) is the probability of a type II error
For a given sample size \(t\), the pairs \(\left(PFA,PD\right)\) lie on a receiver operating characteristic curve.
by choosing \(d\), we select a particular pair \(\left(PFA,PD\right)\) along the curve for a given \(t\)
To see some receiver operating characteristic curves, please see this lecture Likelihood Ratio Processes.
To solve for \(\bar{V}_{fre}\left(t,d\right)\) numerically, we first simulate sequences of \(z\) when either \(f_0\) or \(f_1\) generates data.
Let’s plot empirical distributions, i.e., histograms, associated with \(f_0\) and \(f_1\).
N = 10000
T = 100
rng = np.random.default_rng(1234)

z0_arr = rng.beta(wf.a0, wf.b0, (N, T))
z1_arr = rng.beta(wf.a1, wf.b1, (N, T))
plt.hist(z0_arr.flatten(), bins=50, alpha=0.4, label='f0')
plt.hist(z1_arr.flatten(), bins=50, alpha=0.4, label='f1')
plt.legend()
plt.show()
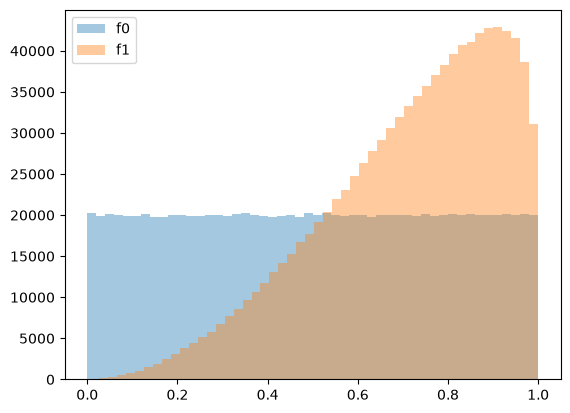
We can compute sequences of likelihood ratios using simulated samples.
l = lambda z: wf.f0(z) / wf.f1(z)
l0_arr = l(z0_arr)
l1_arr = l(z1_arr)

L0_arr = np.cumprod(l0_arr, 1)
L1_arr = np.cumprod(l1_arr, 1)
Column t-1 of L0_arr and L1_arr holds \(L(z^t)\), the likelihood ratio after \(t\) draws.
With an empirical distribution of likelihood ratios in hand, we can draw receiver operating characteristic curves by enumerating \(\left(PFA,PD\right)\) pairs given each sample size \(t\).
PFA = np.arange(0, 100, 1)

for t in range(1, 15, 4):
    percentile = np.percentile(L0_arr[:, t-1], PFA)
    PD = [np.sum(L1_arr[:, t-1] < p) / N for p in percentile]

    plt.plot(PFA / 100, PD, label=f"t={t}")

plt.scatter(0, 1, label="perfect detection")
plt.plot([0, 1], [0, 1], color='k', ls='--', label="random detection")

plt.arrow(0.5, 0.5, -0.15, 0.15, head_width=0.03)
plt.text(0.35, 0.7, "better")
plt.xlabel("Probability of false alarm")
plt.ylabel("Probability of detection")
plt.legend()
plt.title("Receiver Operating Characteristic Curve")
plt.show()
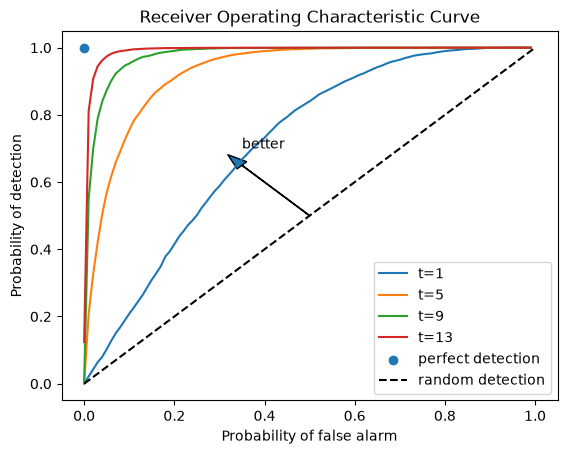
We can minimize the expected total loss presented in equation (33.1) by choosing \(\left(t,d\right)\).
Doing that delivers an expected loss
We let \(t\) range over \(1, 2, \ldots, T\).[1]
We first consider the case in which \(\pi^{*}=\Pr\left\{ \text{nature selects }f_{0}\right\} =0.5\).
We can solve the minimization problem in two steps.
First, we fix \(t\) and find the optimal cutoff \(d\) and consequently the minimal \(\bar{V}_{fre}\left(t\right)\).
For every \(t\), the cutoff
minimizes \(\bar{V}_{fre}\left(t,d\right)\).
The rule “decide \(f_1\) if \(L(z^t) < d^*\)” chooses the decision with the smaller posterior expected loss after \(t\) draws.
The frequentist rule with \(d = d^*\) is therefore a Bayes rule whose sample size is fixed in advance.
Exercise 33.1 asks you to derive (33.2) and to verify it numerically.
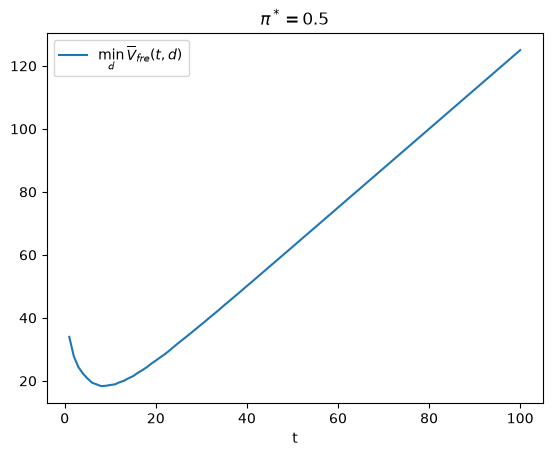
Second, we minimize \(\bar{V}_{fre}\left(t\right) = \bar{V}_{fre}\left(t, d^*\right)\) over \(t\).
Here is Python code that does that and then plots a useful graph.
@jit
def V_fre_d_t(d, t, L0_arr, L1_arr, π_star, wf):

    N = L0_arr.shape[0]

    PFA = np.sum(L0_arr[:, t-1] < d) / N
    PD = np.sum(L1_arr[:, t-1] < d) / N

    V = π_star * PFA * wf.L1 + (1 - π_star) * (1 - PD) * wf.L0

    return V
def d_star(π_star, wf):
    "Cutoff for L = f0/f1 that minimizes expected loss for any t."

    return (1 - π_star) * wf.L0 / (π_star * wf.L1)


def V_fre_t(t, L0_arr, L1_arr, π_star, wf):

    d = d_star(π_star, wf)
    V = V_fre_d_t(d, t, L0_arr, L1_arr, π_star, wf)

    PFA = np.mean(L0_arr[:, t-1] < d)
    PD = np.mean(L1_arr[:, t-1] < d)

    return V, PFA, PD
def compute_V_fre(L0_arr, L1_arr, π_star, wf):

    T = L0_arr.shape[1]

    V_fre_arr = np.empty(T)
    PFA_arr = np.empty(T)
    PD_arr = np.empty(T)

    for t in range(1, T+1):
        V, PFA, PD = V_fre_t(t, L0_arr, L1_arr, π_star, wf)
        V_fre_arr[t-1] = wf.c * t + V
        PFA_arr[t-1] = PFA
        PD_arr[t-1] = PD

    return V_fre_arr, PFA_arr, PD_arr
π_star = 0.5
V_fre_arr, PFA_arr, PD_arr = compute_V_fre(L0_arr, L1_arr, π_star, wf)

plt.plot(range(1, T+1), V_fre_arr, label=r'$\min_{d} \overline{V}_{fre}(t,d)$')
plt.xlabel('t')
plt.title(r'$\pi^*=0.5$')
plt.legend()
plt.show()
t_optimal = np.argmin(V_fre_arr) + 1
The above graph illustrates how minimizing over \(t\) tells the frequentist to draw \(t_{\rm optimal}\) observations and then decide.
Let’s now change the value of \(\pi^{*}\) and watch how the decision rule changes.
n_π = 20
π_star_arr = np.linspace(0.1, 0.9, n_π)

V_fre_bar_arr = np.empty(n_π)
t_optimal_arr = np.empty(n_π)
PFA_optimal_arr = np.empty(n_π)
PD_optimal_arr = np.empty(n_π)

for i, π_star in enumerate(π_star_arr):
    V_fre_arr, PFA_arr, PD_arr = compute_V_fre(L0_arr, L1_arr, π_star, wf)
    t_idx = np.argmin(V_fre_arr)

    V_fre_bar_arr[i] = V_fre_arr[t_idx]
    t_optimal_arr[i] = t_idx + 1
    PFA_optimal_arr[i] = PFA_arr[t_idx]
    PD_optimal_arr[i] = PD_arr[t_idx]
plt.plot(π_star_arr, V_fre_bar_arr)
plt.xlabel(r'$\pi^*$')
plt.title(r'$\overline{V}_{fre}$')

plt.show()

V_no_data = np.minimum(π_star_arr * wf.L1, (1 - π_star_arr) * wf.L0)
print("π* at which deciding without data beats every t ≥ 1:",
      np.round(π_star_arr[V_no_data < V_fre_bar_arr], 2))
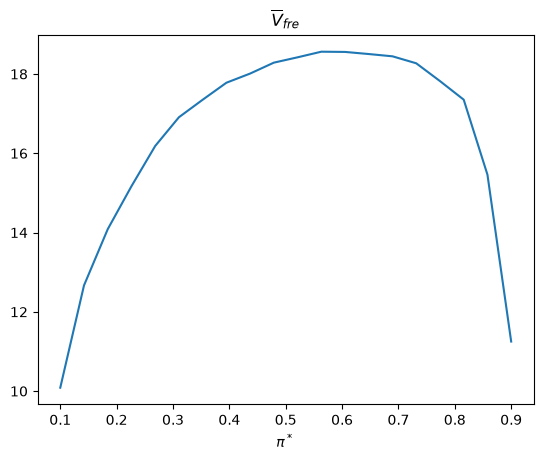
π* at which deciding without data beats every t ≥ 1: [0.1 0.86 0.9 ]
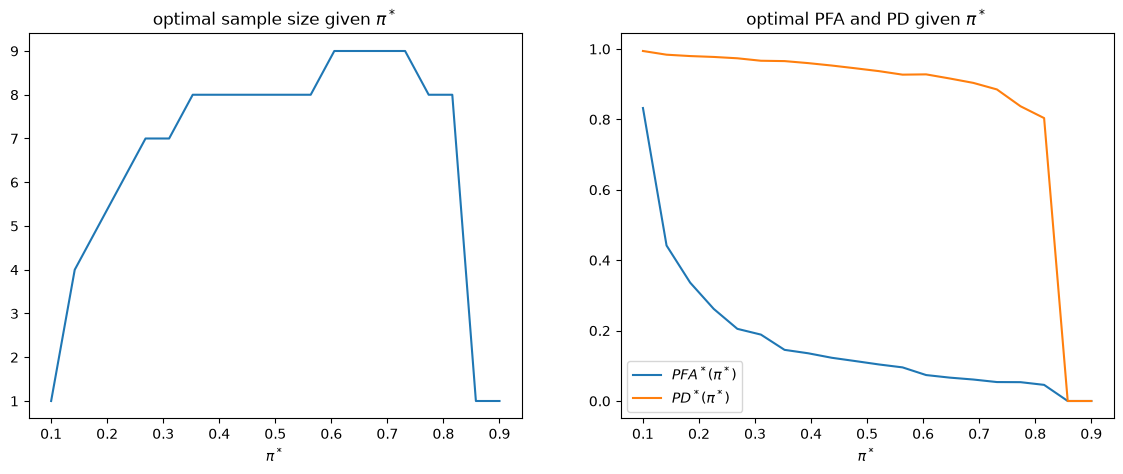
The following shows how optimal sample size \(t\) and targeted \(\left(PFA,PD\right)\) change as \(\pi^{*}\) varies.
fig, axs = plt.subplots(1, 2, figsize=(14, 5))

axs[0].plot(π_star_arr, t_optimal_arr)
axs[0].set_xlabel(r'$\pi^*$')
axs[0].set_title(r'optimal sample size given $\pi^*$')

axs[1].plot(π_star_arr, PFA_optimal_arr, label=r'$PFA^*(\pi^*)$')
axs[1].plot(π_star_arr, PD_optimal_arr, label=r'$PD^*(\pi^*)$')
axs[1].set_xlabel(r'$\pi^*$')
axs[1].legend()
axs[1].set_title(r'optimal PFA and PD given $\pi^*$')

plt.show()
33.4. Bayesian Decision Rule#
In A Problem that Stumped Milton Friedman, we learned how Abraham Wald confirmed the Navy Captain’s hunch that there is a better decision rule.
In A Bayesian Formulation of Friedman and Wald’s Problem we presented a Bayesian procedure that makes decisions by comparing a Bayesian posterior probability \(\pi\) with cutoff probabilities called \(A\) and \(B\).
To proceed, we borrow some Python code from the quantecon lecture A Bayesian Formulation of Friedman and Wald’s Problem that computes optimal values of \(A\) and \(B\).
We rewrite that code for our convention that \(\pi\) is the probability of \(f_0\).
@jit(parallel=True)
def Q(h, wf):

    c, π_grid = wf.c, wf.π_grid
    L0, L1 = wf.L0, wf.L1
    z0, z1 = wf.z0, wf.z1
    mc_size = wf.mc_size

    κ = wf.κ

    h_new = np.empty_like(π_grid)
    h_func = lambda p: np.interp(p, π_grid, h)

    for i in prange(len(π_grid)):
        π = π_grid[i]

        # Find the expected value of J by integrating over z
        integral_f0, integral_f1 = 0, 0
        for m in range(mc_size):
            π_0 = κ(z0[m], π)  # Draw z from f0 and update π
            integral_f0 += min((1 - π_0) * L0, π_0 * L1, h_func(π_0))

            π_1 = κ(z1[m], π)  # Draw z from f1 and update π
            integral_f1 += min((1 - π_1) * L0, π_1 * L1, h_func(π_1))

        integral = (π * integral_f0 + (1 - π) * integral_f1) / mc_size

        h_new[i] = c + integral

    return h_new
@jit
def solve_model(wf, tol=1e-4, max_iter=1000):
    """
    Compute the continuation value function

    * wf is an instance of WaldFriedman
    """

    # Set up loop
    h = np.zeros(len(wf.π_grid))
    i = 0
    error = tol + 1

    while i < max_iter and error > tol:
        h_new = Q(h, wf)
        error = np.max(np.abs(h - h_new))
        i += 1
        h = h_new

    if error > tol:
        print("Failed to converge!")

    return h_new
h_star = solve_model(wf)
def find_cutoff_rule(wf, h):
    """
    This function takes a continuation value function and returns the
    cutoffs (B, A): the decision maker accepts f1 if π ≤ B, accepts f0
    if π ≥ A, and draws another z if B < π < A
    """

    π_grid = wf.π_grid

    # Expected losses from accepting each model
    payoff_f0 = (1 - π_grid) * wf.L0
    payoff_f1 = π_grid * wf.L1

    # B is the largest π at which accepting f1 is optimal;
    # A is the smallest π at which accepting f0 is optimal
    B = π_grid[payoff_f1 <= np.minimum(payoff_f0, h)].max()
    A = π_grid[payoff_f0 <= np.minimum(payoff_f1, h)].min()

    return (B, A)

B, A = find_cutoff_rule(wf, h_star)
print(f"B = {B:.3f}, A = {A:.3f}")

cost_L0 = (1 - wf.π_grid) * wf.L0
cost_L1 = wf.π_grid * wf.L1

fig, ax = plt.subplots(figsize=(10, 6))

ax.plot(wf.π_grid, h_star, label='continuation value')
ax.plot(wf.π_grid, cost_L1, label='choose f1')
ax.plot(wf.π_grid, cost_L0, label='choose f0')
ax.plot(wf.π_grid,
        np.amin(np.column_stack([h_star, cost_L0, cost_L1]),axis=1),
        lw=15, alpha=0.1, color='b', label='minimum cost')

ax.annotate(r"$B$", xy=(B + 0.01, 0.5), fontsize=14)
ax.annotate(r"$A$", xy=(A + 0.01, 0.5), fontsize=14)

plt.vlines(B, 0, B * wf.L1, linestyle="--")
plt.vlines(A, 0, (1 - A) * wf.L0, linestyle="--")

ax.set(xlim=(0, 1), ylim=(0, 0.5 * max(wf.L0, wf.L1)), ylabel="cost",
       xlabel=r"$\pi$", title="Value function")

plt.legend(borderpad=1.1)
plt.show()
B = 0.050, A = 0.945
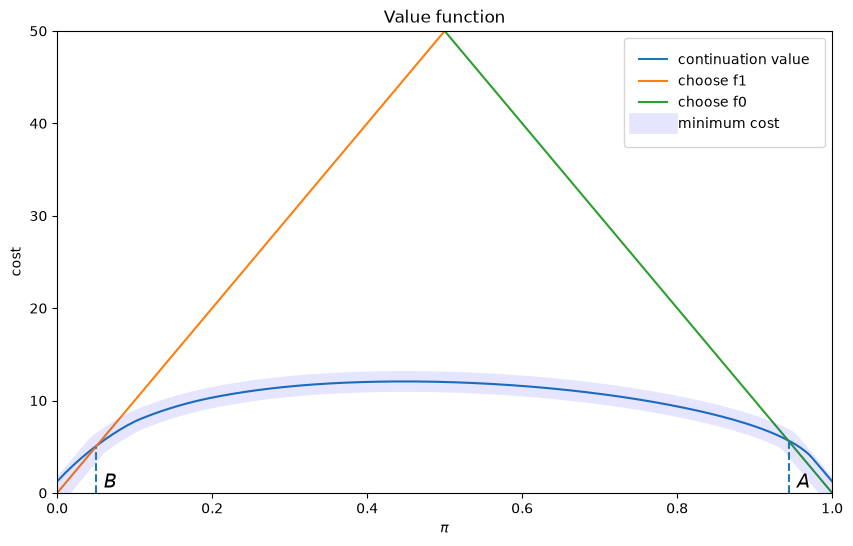
The above figure portrays the value function plotted against the decision maker’s Bayesian posterior.
It also shows the cutoff probabilities \(A\) and \(B\).
The Bayesian decision rule is:
accept \(H_0\) if \(\pi \geq A\)
accept \(H_1\) if \(\pi \leq B\)
delay deciding and draw another \(z\) if \( B < \pi < A\)
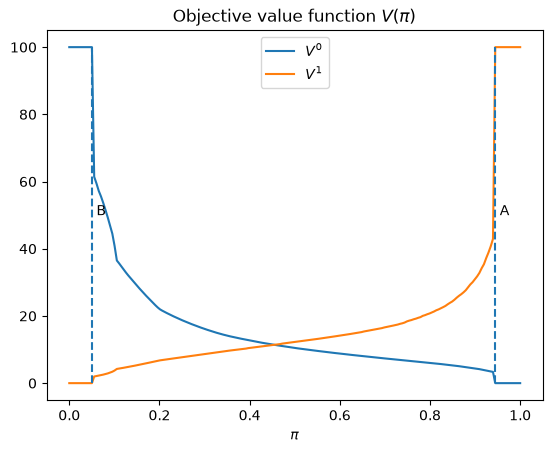
We can calculate two “objective” loss functions under this situation conditioning on knowing for sure that nature has selected \(f_{0}\), in the first case, or \(f_{1}\), in the second case.
under \(f_{0}\),
\[\begin{split} V^{0}\left(\pi\right)=\begin{cases} 0 & \text{if }A \leq\pi,\\ c+E_{f_0}V^{0}\left(\pi^{\prime}\right) & \text{if }B<\pi< A,\\ \bar L_{1} & \text{if }\pi\leq B. \end{cases} \end{split}\]under \(f_{1}\)
\[\begin{split} V^{1}\left(\pi\right)=\begin{cases} \bar L_{0} & \text{if }A \leq\pi,\\ c+E_{f_1}V^{1}\left(\pi^{\prime}\right) & \text{if }B <\pi<A,\\ 0 & \text{if }\pi\leq B. \end{cases} \end{split}\]
where \(\pi^{\prime}=\frac{\pi f_{0}\left(z^{\prime}\right)}{\pi f_{0}\left(z^{\prime}\right)+\left(1-\pi\right)f_{1}\left(z^{\prime}\right)}\) and \(E_{f_i}\) integrates over \(z^{\prime}\) drawn from \(f_i\).
Given a prior probability \(\pi_{0}\), the expected loss for the Bayesian is
Below we write some Python code that computes \(V^{0}\left(\pi\right)\) and \(V^{1}\left(\pi\right)\) numerically.
The code iterates on the two functional equations at the grid points in the continuation region \((B, A)\).
It replaces each expectation with an average over the mc_size Monte Carlo draws stored in wf.
It uses the terminal losses exactly when \(\pi^{\prime}\) leaves \((B, A)\) and interpolates only between grid points inside \((B, A)\).
@jit(parallel=True)
def V_q(wf, A, B, flag, tol=1e-5, max_iter=10_000):
    """
    Expected loss of the Bayesian cutoff rule (B, A) when f0 (flag=0)
    or f1 (flag=1) generates the data
    """

    π_grid = wf.π_grid

    if flag == 0:
        z_arr = wf.z0
        loss_f0, loss_f1 = 0.0, wf.L1   # losses from accepting f0, f1
    else:
        z_arr = wf.z1
        loss_f0, loss_f1 = wf.L0, 0.0

    m = len(z_arr)

    # Terminal losses outside the continuation region
    V = np.where(π_grid >= A, loss_f0, np.where(π_grid <= B, loss_f1, 0.0))

    cont = (π_grid > B) & (π_grid < A)
    π_cont = π_grid[cont]
    n_cont = len(π_cont)
    if n_cont == 0:
        return V

    V_cont = np.zeros(n_cont)
    for it in range(max_iter):
        V_old = V_cont.copy()

        for i in prange(n_cont):
            total = 0.0
            for j in range(m):
                π_next = wf.κ(z_arr[j], π_cont[i])
                if π_next >= A:
                    total += loss_f0
                elif π_next <= B:
                    total += loss_f1
                else:
                    total += np.interp(π_next, π_cont, V_old)
            V_cont[i] = wf.c + total / m

        if np.max(np.abs(V_cont - V_old)) < tol:
            break

    V[cont] = V_cont

    return V
V0 = V_q(wf, A, B, 0)
V1 = V_q(wf, A, B, 1)

plt.plot(wf.π_grid, V0, label='$V^0$')
plt.plot(wf.π_grid, V1, label='$V^1$')
plt.vlines(B, 0, wf.L0, linestyle='--')
plt.text(B+0.01, wf.L0/2, 'B')
plt.vlines(A, 0, wf.L0, linestyle='--')
plt.text(A+0.01, wf.L0/2, 'A')
plt.xlabel(r'$\pi$')
plt.title(r'Objective value function $V(\pi)$')
plt.legend()
plt.show()
Given an assumed value for \(\pi^{*}=\Pr\left\{ \text{nature selects }f_{0}\right\}\), we can then compute \(\bar{V}_{Bayes}\left(\pi_{0}\right)\).
We can then determine an initial Bayesian prior \(\pi_{0}^{*}\) that minimizes this objective concept of expected loss.
A theorem tells us that \(\pi_{0}^{*}=\pi^{*}\).
The Bayes rule that starts from the prior \(\pi^{*}\) minimizes \(\pi^{*}\)-weighted expected loss over all sequential decision rules.
A Bayesian who starts from another prior \(\pi_0\) uses one of those rules.
Therefore \(\bar{V}_{Bayes}\left(\pi_{0}\right)\geq\bar{V}_{Bayes}\left(\pi^{*}\right)\) for every \(\pi_0\).
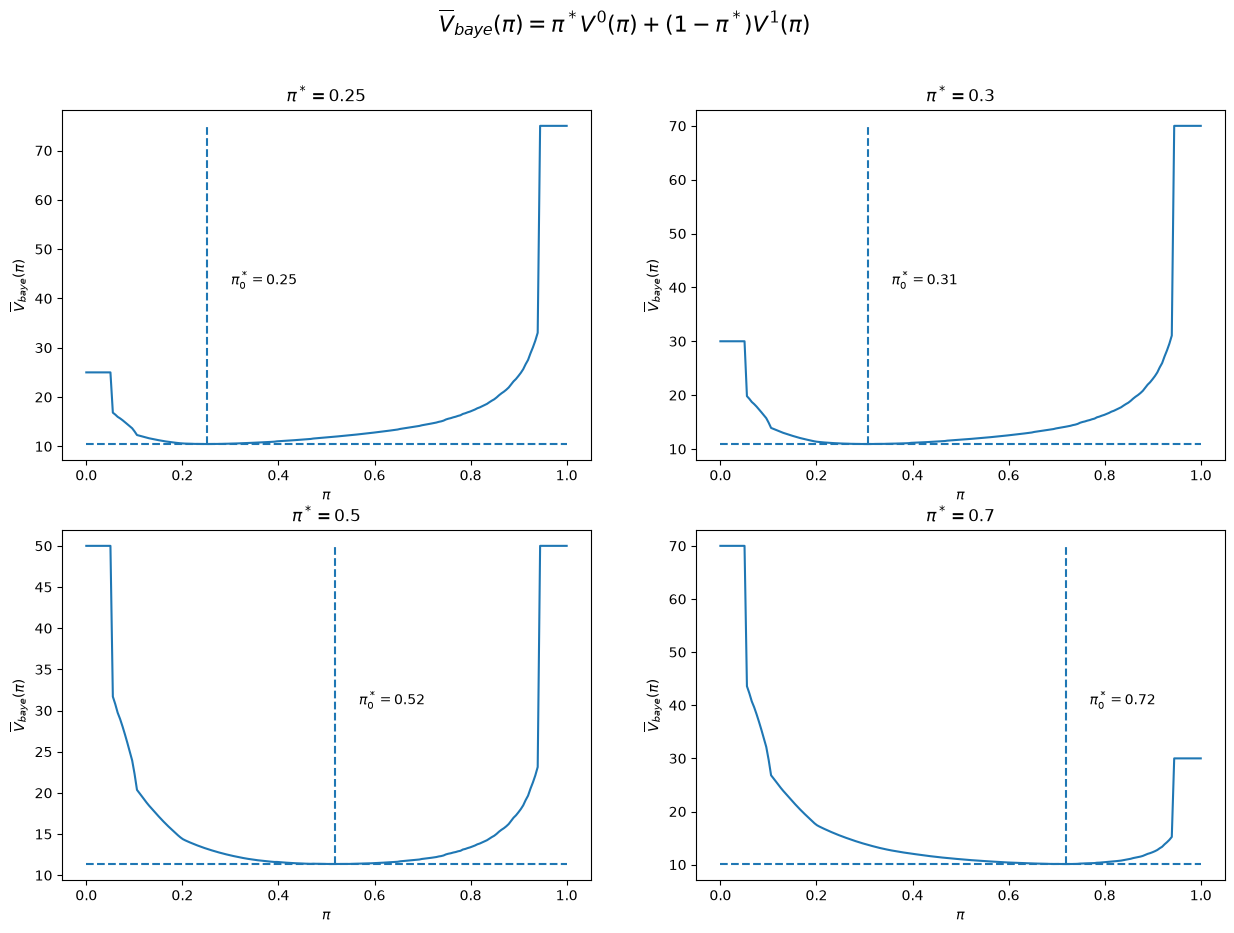
The figure below plots four cases corresponding to \(\pi^{*}=0.25,0.3,0.5,0.7\).
The numerical minimizers lie near \(\pi^{*}\) but not exactly at it.
The function \(\bar{V}_{Bayes}\left(\pi_{0}\right)\) is flat near its minimum, so small grid and Monte Carlo errors move the computed \(\pi_{0}^{*}\).
def compute_V_baye_bar(π_star, V0, V1, wf):

    V_baye = π_star * V0 + (1 - π_star) * V1
    π_idx = np.argmin(V_baye)
    π_optimal = wf.π_grid[π_idx]
    V_baye_bar = V_baye[π_idx]

    return V_baye, π_optimal, V_baye_bar
π_star_arr = [0.25, 0.3, 0.5, 0.7]

fig, axs = plt.subplots(2, 2, figsize=(15, 10))

for i, π_star in enumerate(π_star_arr):
    row_i = i // 2
    col_i = i % 2

    V_baye, π_optimal, V_baye_bar = compute_V_baye_bar(π_star, V0, V1, wf)

    axs[row_i, col_i].plot(wf.π_grid, V_baye)
    axs[row_i, col_i].hlines(V_baye_bar, 0, 1, linestyle='--')
    axs[row_i, col_i].vlines(π_optimal, V_baye_bar, V_baye.max(), linestyle='--')
    axs[row_i, col_i].text(π_optimal+0.05, (V_baye_bar + V_baye.max()) / 2,
                        r'${\pi_0^*}=$'+f'{π_optimal:0.2f}')
    axs[row_i, col_i].set_xlabel(r'$\pi$')
    axs[row_i, col_i].set_ylabel(r'$\overline{V}_{baye}(\pi)$')
    axs[row_i, col_i].set_title(r'$\pi^*=$' + f'{π_star}')

fig.suptitle(r'$\overline{V}_{baye}(\pi)=\pi^*V^0(\pi) + (1-\pi^*)V^1(\pi)$', fontsize=16)
plt.show()
The following Python code computes \(\pi_{0}^{*}\) and \(\bar{V}_{Bayes} = \bar{V}_{Bayes}\left(\pi_{0}^{*}\right)\) for a grid of values of \(\pi^{*}\).
π_star_arr = np.linspace(0.1, 0.9, n_π)
V_baye_bar_arr = np.empty_like(π_star_arr)
π_optimal_arr = np.empty_like(π_star_arr)

for i, π_star in enumerate(π_star_arr):

    V_baye, π_optimal, V_baye_bar = compute_V_baye_bar(π_star, V0, V1, wf)

    V_baye_bar_arr[i] = V_baye_bar
    π_optimal_arr[i] = π_optimal

fig, axs = plt.subplots(1, 2, figsize=(14, 5))

axs[0].plot(π_star_arr, V_baye_bar_arr)
axs[0].set_xlabel(r'$\pi^*$')
axs[0].set_title(r'$\overline{V}_{baye}$')

axs[1].plot(π_star_arr, π_optimal_arr, label='optimal prior')
axs[1].plot([π_star_arr.min(), π_star_arr.max()],
            [π_star_arr.min(), π_star_arr.max()],
            c='k', linestyle='--', label='45 degree line')
axs[1].set_xlabel(r'$\pi^*$')
axs[1].set_title(r'optimal prior given $\pi^*$')
axs[1].legend()

plt.show()

print(f"largest |π_0^* - π^*| = {np.max(np.abs(π_optimal_arr - π_star_arr)):.3f}")
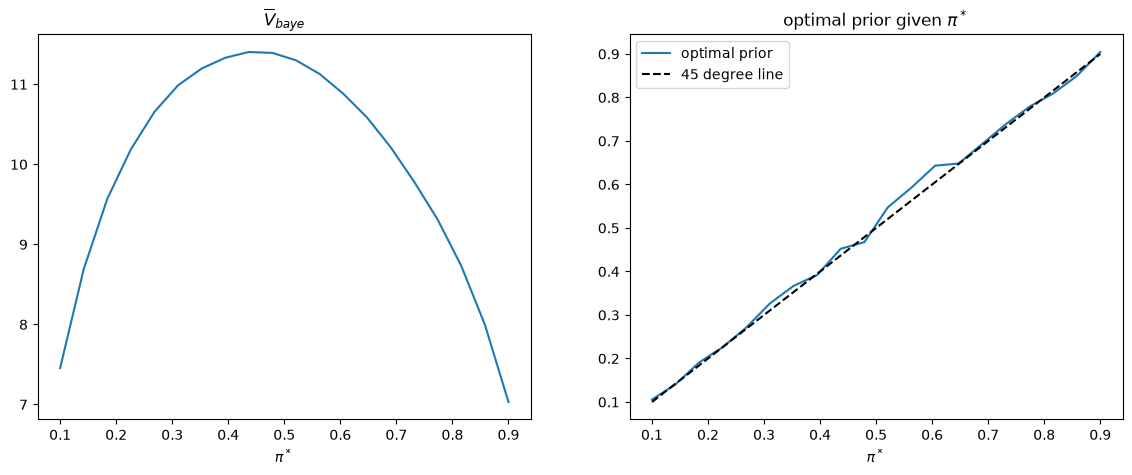
largest |π_0^* - π^*| = 0.038
The computed \(\pi_{0}^{*}\) stays within \(0.04\) of the 45 degree line.
33.5. Was the Navy Captain’s Hunch Correct?#
We now compare average losses obtained by our frequentist Neyman-Pearson and Bayesian decision rules.
The comparison is between a rule with a fixed sample size and a sequential rule.
Both rules use the prior \(\pi^{*}\) and the losses \(\bar L_0\), \(\bar L_1\), and \(c\).
A fixed-sample rule \((t, d)\) is a sequential rule that ignores the data until date \(t\) and then stops.
The Bayesian rule minimizes expected loss over all sequential rules.
Therefore \(\bar{V}_{Bayes}\leq\bar{V}_{fre}\) for every \(\pi^{*}\).
The simulations below illustrate this inequality and measure the gap.
As a starting point, let’s compare average loss functions when \(\pi^{*}=0.5\).
π_star = 0.5
# frequentist
V_fre_arr, PFA_arr, PD_arr = compute_V_fre(L0_arr, L1_arr, π_star, wf)

# bayesian
V_baye = π_star * V0 + (1 - π_star) * V1
V_baye_bar = V_baye.min()

print(f"V_fre = {V_fre_arr.min():.2f} at t = {np.argmin(V_fre_arr) + 1}")
print(f"V_Bayes = {V_baye_bar:.2f}")
V_fre = 18.33 at t = 8
V_Bayes = 11.36
plt.plot(range(1, T+1), V_fre_arr, label=r'$\min_{d} \overline{V}_{fre}(t,d)$')
plt.plot([1, T], [V_baye_bar, V_baye_bar], label=r'$\overline{V}_{baye}$')
plt.xlabel('t')
plt.title(r'$\pi^*=0.5$')
plt.legend()
plt.show()
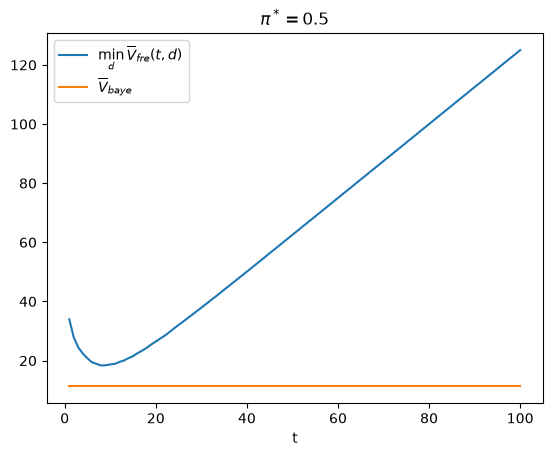
Evidently, there is no sample size \(t\) at which the Neyman-Pearson decision rule attains a lower loss function than does the Bayesian rule.
At \(\pi^{*}=0.5\), the best fixed-sample rule draws \(8\) observations and has expected loss \(18.33\); the Bayesian rule has expected loss \(11.36\).
The Bayesian value is computed with the \(1{,}000\) Monte Carlo draws stored in wf.z0 and wf.z1, so its last digits are not reliable; the simulation in a later section puts the Bayesian loss near \(12.3\), still far below \(18.33\).
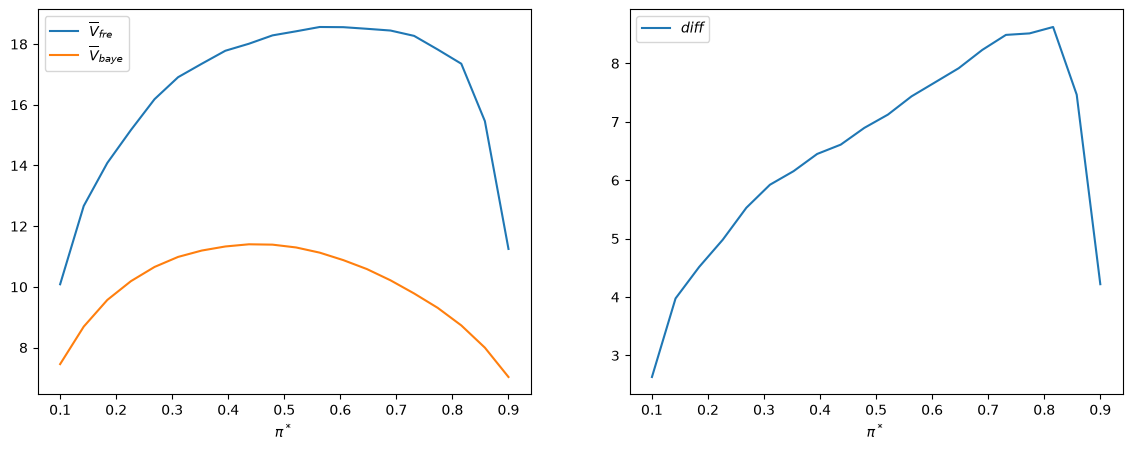
The following graph compares the two rules for all values of \(\pi^{*}\).
fig, axs = plt.subplots(1, 2, figsize=(14, 5))

axs[0].plot(π_star_arr, V_fre_bar_arr, label=r'$\overline{V}_{fre}$')
axs[0].plot(π_star_arr, V_baye_bar_arr, label=r'$\overline{V}_{baye}$')
axs[0].legend()
axs[0].set_xlabel(r'$\pi^*$')

axs[1].plot(π_star_arr, V_fre_bar_arr - V_baye_bar_arr, label='$diff$')
axs[1].legend()
axs[1].set_xlabel(r'$\pi^*$')

plt.show()

diff = V_fre_bar_arr - V_baye_bar_arr
print(f"min diff = {diff.min():.2f} at π* = {π_star_arr[np.argmin(diff)]:.2f}")
print(f"max diff = {diff.max():.2f} at π* = {π_star_arr[np.argmax(diff)]:.2f}")
min diff = 2.63 at π* = 0.10
max diff = 8.62 at π* = 0.82
The right panel of the above graph plots the difference \(\bar{V}_{fre}-\bar{V}_{Bayes}\).
It is always positive, as the theorem requires.
The gap is smallest, \(2.63\), at \(\pi^{*}=0.1\) and largest, \(8.62\), at \(\pi^{*}\approx 0.82\).
33.6. More Details#
We can provide more insights by focusing on the case in which \(\pi^{*}=0.5=\pi_{0}\).
π_star = 0.5
Recall that when \(\pi^*=0.5\), the frequentist Neyman-Pearson decision rule sets a
sample size t_optimal ex ante.
For our parameter settings, we can compute its value:
t_optimal
np.int64(8)
For convenience, let’s define t_idx as the Python array index
corresponding to t_optimal sample size.
t_idx = t_optimal - 1
33.7. Distribution of Bayesian Decision Rule’s Time to Decide#
We use simulations to compute the frequency distribution of the time to decide for the Bayesian decision rule and compare that time to the frequentist rule’s fixed \(t\).
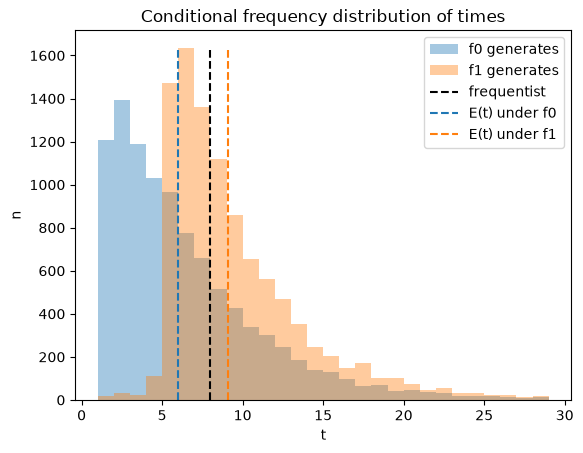
The following Python code creates a graph that shows the frequency distribution of Bayesian times to decide of Bayesian decision maker, conditional on distribution \(q=f_{0}\) or \(q= f_{1}\) generating the data.
The blue and orange dashed lines show averages for the Bayesian decision rule under \(f_0\) and \(f_1\), while the black dashed line shows the frequentist optimal sample size \(t\).
On average the Bayesian rule decides earlier than the frequentist rule when \(q= f_0\) and later when \(q = f_1\).
The function check_results records time \(T+1\) for a path that has not reached a decision by \(T\).
@jit(parallel=True)
def check_results(L_arr, A, B, flag, π0):

    N, T = L_arr.shape

    time_arr = np.full(N, T + 1)                  # T + 1 means no decision by T
    correctness = np.zeros(N, dtype=np.bool_)

    π_arr = π0 * L_arr / (π0 * L_arr + 1 - π0)

    for i in prange(N):
        for t in range(T):
            if (π_arr[i, t] <= B) or (π_arr[i, t] >= A):
                time_arr[i] = t + 1
                correctness[i] = (flag == 0 and π_arr[i, t] >= A) or (flag == 1 and π_arr[i, t] <= B)
                break

    return time_arr, correctness
time_arr0, correctness0 = check_results(L0_arr, A, B, 0, π_star)
time_arr1, correctness1 = check_results(L1_arr, A, B, 1, π_star)

# unconditional distribution
time_arr_u = np.concatenate((time_arr0, time_arr1))
correctness_u = np.concatenate((correctness0, correctness1))

print("paths with no decision by T:", np.sum(time_arr_u > T))
print(f"mean time to decide: {time_arr0.mean():.2f} under f0, "
      f"{time_arr1.mean():.2f} under f1, {time_arr_u.mean():.2f} pooled")
paths with no decision by T: 0
mean time to decide: 5.97 under f0, 9.11 under f1, 7.54 pooled
n1 = plt.hist(time_arr0, bins=range(1, 30), alpha=0.4, label='f0 generates')[0]
n2 = plt.hist(time_arr1, bins=range(1, 30), alpha=0.4, label='f1 generates')[0]
plt.vlines(t_optimal, 0, max(n1.max(), n2.max()), linestyle='--',
           color='k', label='frequentist')
plt.vlines(np.mean(time_arr0), 0, max(n1.max(), n2.max()),
           linestyle='--', color='C0', label='E(t) under f0')
plt.vlines(np.mean(time_arr1), 0, max(n1.max(), n2.max()),
           linestyle='--', color='C1', label='E(t) under f1')
plt.legend();

plt.xlabel('t')
plt.ylabel('n')
plt.title('Conditional frequency distribution of times')

plt.show()
Later we’ll figure out how these distributions ultimately affect objective expected values under the Neyman-Pearson and Bayesian decision rules.
To begin, let’s look at simulations of the Bayesian’s beliefs over time.
We can compute updated beliefs at any time \(t\) using the one-to-one mapping from \(L_{t}\) to \(\pi_{t}\) given \(\pi_0\) described in the section on likelihood ratio processes and Bayes’ law of Likelihood Ratio Processes and Bayesian Learning.
π0_arr = π_star * L0_arr / (π_star * L0_arr + 1 - π_star)
π1_arr = π_star * L1_arr / (π_star * L1_arr + 1 - π_star)
fig, axs = plt.subplots(1, 2, figsize=(14, 4))

axs[0].plot(np.arange(1, π0_arr.shape[1]+1), np.mean(π0_arr, 0), label='f0 generates')
axs[0].plot(np.arange(1, π1_arr.shape[1]+1), 1 - np.mean(π1_arr, 0), label='f1 generates')
axs[0].set_xlabel('t')
axs[0].set_ylabel(r'$E(\pi_t)$ or ($1 - E(\pi_t)$)')
axs[0].set_title('Expectation of beliefs after drawing t observations')
axs[0].legend()

axs[1].plot(np.arange(1, π0_arr.shape[1]+1), np.var(π0_arr, 0), label='f0 generates')
axs[1].plot(np.arange(1, π1_arr.shape[1]+1), np.var(π1_arr, 0), label='f1 generates')
axs[1].set_xlabel('t')
axs[1].set_ylabel(r'var($\pi_t$)')
axs[1].set_title('Variance of beliefs after drawing t observations')
axs[1].legend()

plt.show()
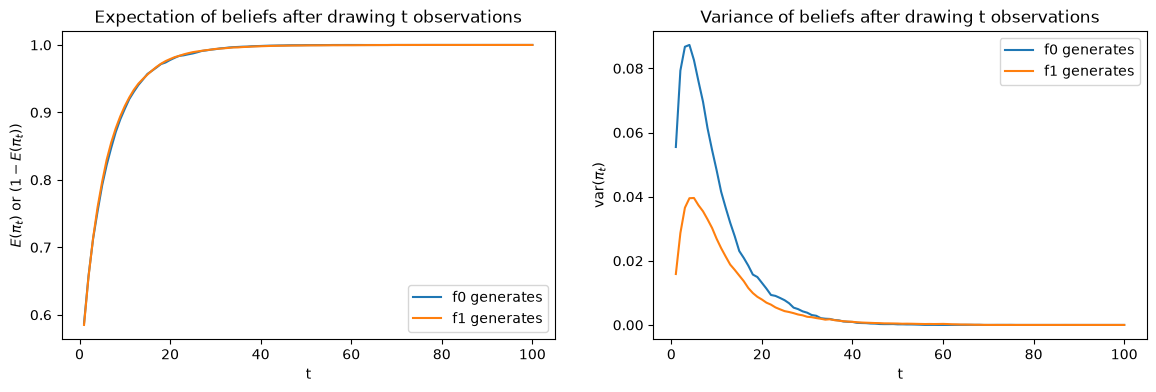
The above figures compare averages and variances of updated Bayesian posteriors after \(t\) draws.
The left graph compares \(E_{f_0}\left(\pi_{t}\right)\) to \(1-E_{f_1}\left(\pi_{t}\right)\): they lie on top of each other.
The martingale property of \(\pi_t\) implies this outcome.
Under the Bayesian’s subjective distribution, which mixes \(f_0\) and \(f_1\) with weights \(\pi_0\) and \(1-\pi_0\), \(\pi_t\) is a martingale with mean \(\pi_0\).
Therefore \(\pi_0 E_{f_0}\left(\pi_{t}\right)+\left(1-\pi_0\right)E_{f_1}\left(\pi_{t}\right)=\pi_0\) for every \(t\).
With \(\pi_0=1/2\), this identity becomes \(E_{f_0}\left(\pi_{t}\right)=1-E_{f_1}\left(\pi_{t}\right)\).
The two simulated curves differ only by Monte Carlo error.
The right graph shows that the variance of \(\pi_t\) is lower under \(f_{1}\) when \(t\) is small.
An asymmetry in Kullback-Leibler divergences explains why the Bayesian decision maker waits longer to decide when \(f_{1}\) generates the data.
Statistical Divergence Measures describes Kullback-Leibler divergence.
Under \(f_0\), \(\log L_t\) rises on average by \(KL(f_0\|f_1) = E_{f_0}\left[\log\left(f_0(z)/f_1(z)\right)\right]\) per draw.
Under \(f_1\), \(\log L_t\) falls on average by \(KL(f_1\|f_0) = E_{f_1}\left[\log\left(f_1(z)/f_0(z)\right)\right]\) per draw.
With \(\pi_0 = 1/2\), the Bayesian stops when \(\log L_t\) leaves the interval \((\log L_B, \log L_A)\), where \(L_A = A/(1-A)\) and \(L_B = B/(1-B)\).
Wald’s approximation to the expected number of draws ignores the amount by which \(\log L_t\) overshoots a threshold:
and similarly under \(f_0\).
def KL(f, g):
    "KL(f || g), the integral of f log(f/g) over [0, 1]."
    integrand = lambda z: f(z) * np.log(f(z) / g(z))
    return quad(integrand, 0, 1)[0]

KL_01 = KL(wf.f0, wf.f1)
KL_10 = KL(wf.f1, wf.f0)

LA = (1 - π_star) * A / (π_star * (1 - A))
LB = (1 - π_star) * B / (π_star * (1 - B))

p0 = correctness0.mean()   # probability of accepting f0 under f0
p1 = correctness1.mean()   # probability of accepting f1 under f1

EN0_wald = (p0 * np.log(LA) + (1 - p0) * np.log(LB)) / KL_01
EN1_wald = (p1 * np.log(LB) + (1 - p1) * np.log(LA)) / (-KL_10)

print(f"KL(f0||f1) = {KL_01:.3f},  KL(f1||f0) = {KL_10:.3f}")
print(f"log L_A = {np.log(LA):.2f},  log L_B = {np.log(LB):.2f}")
print(f"E_f0[N]: Wald approximation {EN0_wald:.1f}, simulation {time_arr0.mean():.1f}")
print(f"E_f1[N]: Wald approximation {EN1_wald:.1f}, simulation {time_arr1.mean():.1f}")

# Average overshoot of log L_A under f0 and of log L_B under f1
logL0_stop = np.log(L0_arr[np.arange(N), time_arr0 - 1])
logL1_stop = np.log(L1_arr[np.arange(N), time_arr1 - 1])
print(f"mean overshoot: {np.mean(logL0_stop[correctness0] - np.log(LA)):.2f} "
      f"under f0, {np.mean(np.log(LB) - logL1_stop[correctness1]):.2f} under f1")
KL(f0||f1) = 0.759,  KL(f1||f0) = 0.344
log L_A = 2.84,  log L_B = -2.94
E_f0[N]: Wald approximation 3.4, simulation 6.0
E_f1[N]: Wald approximation 8.3, simulation 9.1
mean overshoot: 1.98 under f0, 0.31 under f1
The divergence \(KL(f_0\|f_1)\approx 0.759\) is more than twice \(KL(f_1\|f_0)\approx 0.344\).
The thresholds \(\log L_A \approx 2.84\) and \(\log L_B \approx -2.94\) lie about equally far from zero.
Under \(f_1\), \(\log L_t\) drifts toward \(\log L_B\) at less than half the speed at which it drifts toward \(\log L_A\) under \(f_0\).
Wald’s approximation gives \(E_{f_1}[N]\approx 8.3\), close to the simulated \(9.1\).
It gives \(E_{f_0}[N]\approx 3.4\), far below the simulated \(6.0\).
Under \(f_0\), draws of \(z\) near zero make \(\log\left(f_0(z)/f_1(z)\right)\) very large, so \(\log L_t\) overshoots \(\log L_A\) by about \(2\) on average; under \(f_1\), \(\log L_t\) overshoots \(\log L_B\) by about \(0.3\).
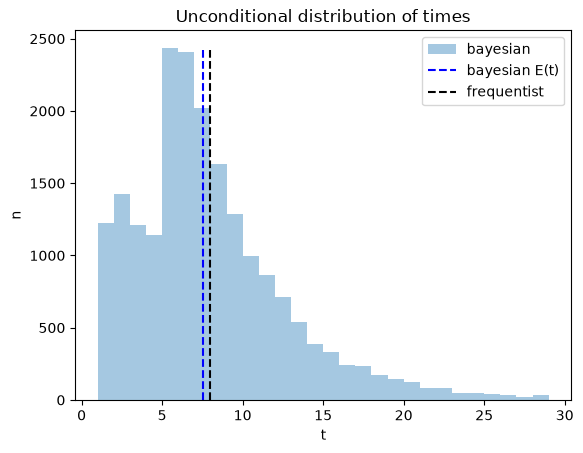
The code below plots outcomes of constructing an unconditional distribution by simply pooling the simulated data across the two possible distributions \(f_0\) and \(f_1\).
The pooled distribution describes a sense in which on average the Bayesian decides earlier, an outcome that seems at least partly to confirm the Navy Captain’s hunch.
The pooled mean time to decide is \(7.54\) draws, against \(t_{\rm optimal}=8\).
n = plt.hist(time_arr_u, bins=range(1, 30), alpha=0.4, label='bayesian')[0]
plt.vlines(np.mean(time_arr_u), 0, n.max(), linestyle='--',
           color='b', label='bayesian E(t)')
plt.vlines(t_optimal, 0, n.max(), linestyle='--', color='k', label='frequentist')
plt.legend()

plt.xlabel('t')
plt.ylabel('n')
plt.title('Unconditional distribution of times')

plt.show()
33.8. Probability of Making Correct Decision#
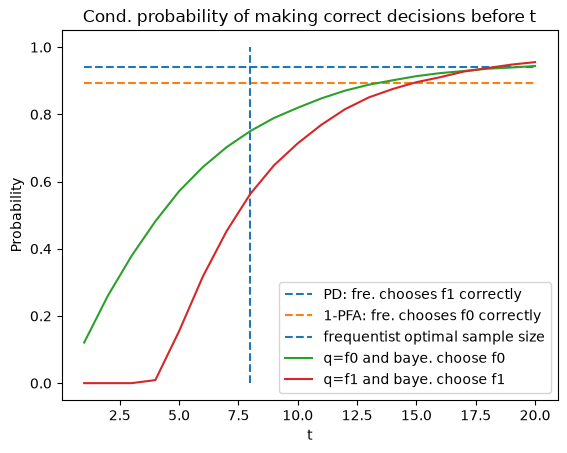
Now we use simulations to compute the fractions of samples in which the Bayesian and the frequentist Neyman-Pearson decision rules decide correctly.
For the frequentist Neyman-Pearson rule, the probability of making the correct decision under \(f_{1}\) is the optimal probability of detection given \(t\) that we defined earlier, and similarly it equals \(1\) minus the optimal probability of a false alarm under \(f_{0}\).
Below we plot these two probabilities for the frequentist rule, along with the conditional probabilities that the Bayesian rule decides before \(t\) and that the decision is correct.
# optimal PFA and PD of frequentist with optimal sample size
V, PFA, PD = V_fre_t(t_optimal, L0_arr, L1_arr, π_star, wf)
plt.plot([1, 20], [PD, PD], linestyle='--', label='PD: fre. chooses f1 correctly')
plt.plot([1, 20], [1-PFA, 1-PFA], linestyle='--', label='1-PFA: fre. chooses f0 correctly')
plt.vlines(t_optimal, 0, 1, linestyle='--', label='frequentist optimal sample size')

T_arr = np.arange(1, 21)
plt.plot(T_arr, [np.mean(correctness0 & (time_arr0 <= t)) for t in T_arr],
        label='q=f0 and baye. choose f0')
plt.plot(T_arr, [np.mean(correctness1 & (time_arr1 <= t)) for t in T_arr],
        label='q=f1 and baye. choose f1')
plt.legend(loc=4)

plt.xlabel('t')
plt.ylabel('Probability')
plt.title('Cond. probability of making correct decisions before t')

plt.show()
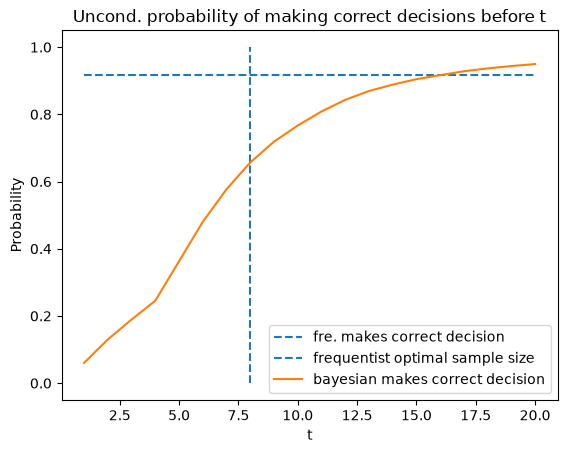
By averaging using \(\pi^{*}\), we also plot the unconditional distribution.
plt.plot([1, 20], [(PD + 1 - PFA) / 2, (PD + 1 - PFA) / 2],
        linestyle='--', label='fre. makes correct decision')
plt.vlines(t_optimal, 0, 1, linestyle='--', label='frequentist optimal sample size')

plt.plot(T_arr, [np.mean(correctness_u & (time_arr_u <= t)) for t in T_arr],
        label="bayesian makes correct decision")
plt.legend()

plt.xlabel('t')
plt.ylabel('Probability')
plt.title('Uncond. probability of making correct decisions before t')

plt.show()
The simulated times to decide and probabilities of correct decisions give a second estimate of the Bayesian’s expected loss.
This estimate uses the same simulated paths that we used for the frequentist rule.
V0_sim = wf.c * time_arr0.mean() + wf.L1 * (1 - correctness0.mean())
V1_sim = wf.c * time_arr1.mean() + wf.L0 * (1 - correctness1.mean())
V_baye_sim = π_star * V0_sim + (1 - π_star) * V1_sim

V_fre_sim = wf.c * t_optimal + V

print(f"Bayesian rule:     {V_baye_sim:.2f}")
print(f"fixed-sample rule: {V_fre_sim:.2f}")
Bayesian rule:     12.27
fixed-sample rule: 18.33
The simulated expected loss of the Bayesian rule, \(12.27\), exceeds the value \(11.36\) that V_q delivered.
The gap comes from Monte Carlo error in the \(1{,}000\) draws wf.z0 and wf.z1 that V_q uses to approximate expectations.
Both values lie far below the fixed-sample loss of \(18.33\).
33.9. Distribution of Likelihood Ratios at Neyman-Pearson’s \(t\)#
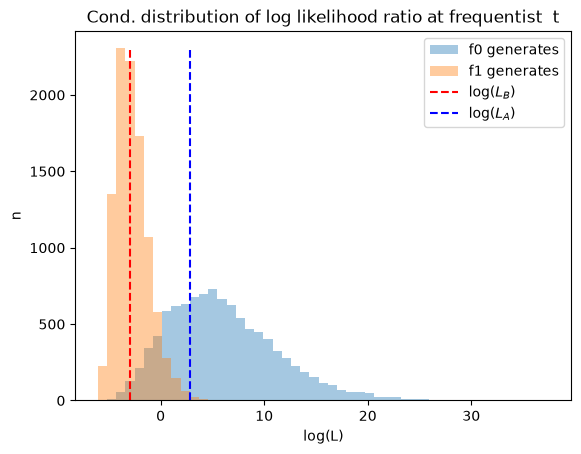
Next we use simulations to construct distributions of likelihood ratios after \(t\) draws.
To serve as useful reference points, we also show the likelihood ratios \(L_A\) and \(L_B\) that correspond to the Bayesian cutoffs \(A\) and \(B\).
In order to exhibit the distribution more clearly, we report logarithms of likelihood ratios.
The graphs below reports two distributions, one conditional on \(f_0\) generating the data, the other conditional on \(f_1\) generating the data.
L_min = min(L0_arr[:, t_idx].min(), L1_arr[:, t_idx].min())
L_max = max(L0_arr[:, t_idx].max(), L1_arr[:, t_idx].max())
bin_range = np.linspace(np.log(L_min), np.log(L_max), 50)
n0 = plt.hist(np.log(L0_arr[:, t_idx]), bins=bin_range, alpha=0.4, label='f0 generates')[0]
n1 = plt.hist(np.log(L1_arr[:, t_idx]), bins=bin_range, alpha=0.4, label='f1 generates')[0]

plt.vlines(np.log(LB), 0, max(n0.max(), n1.max()), linestyle='--', color='r', label='log($L_B$)')
plt.vlines(np.log(LA), 0, max(n0.max(), n1.max()), linestyle='--', color='b', label='log($L_A$)')
plt.legend()

plt.xlabel('log(L)')
plt.ylabel('n')
plt.title('Cond. distribution of log likelihood ratio at frequentist  t')

plt.show()
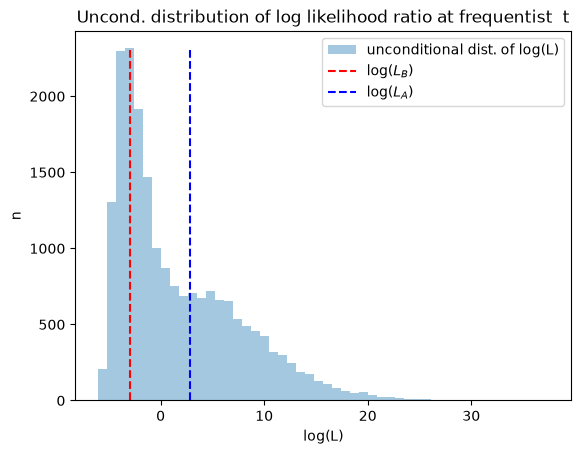
The next graph plots the unconditional distribution of \(\log L\) at the frequentist \(t\), constructed by pooling the two conditional distributions.
With \(\pi^* = 0.5\), pooling equal numbers of paths from \(f_0\) and \(f_1\) weights them by \(\pi^*\) and \(1-\pi^*\).
n = plt.hist(np.log(np.concatenate([L0_arr[:, t_idx], L1_arr[:, t_idx]])),
             bins=50, alpha=0.4, label='unconditional dist. of log(L)')[0]
plt.vlines(np.log(LB), 0, n.max(), linestyle='--', color='r', label='log($L_B$)')
plt.vlines(np.log(LA), 0, n.max(), linestyle='--', color='b', label='log($L_A$)')
plt.legend()

plt.xlabel('log(L)')
plt.ylabel('n')
plt.title('Uncond. distribution of log likelihood ratio at frequentist  t')

plt.show()
33.10. Exercises#
Exercise 33.1
Fix a sample size \(t\) and regard the expected loss (33.1) as a function of the cutoff \(d\).
Show that \(d^{*}=\left(1-\pi^{*}\right)\bar L_{0}/\left(\pi^{*}\bar L_{1}\right)\) minimizes (33.1) for every \(t\). Hint: write \(PFA\) and \(1-PD\) as integrals over samples \(z^t\) and minimize the integrand at each \(z^t\).
Let \(\pi_t\) be the posterior probability of \(f_0\) after \(t\) draws from a prior \(\pi^{*}\). Show that the rule “decide \(f_1\) if \(L(z^t)<d^{*}\)” chooses the decision with the smaller posterior expected loss. Explain why this makes the frequentist rule of this lecture a Bayes rule with a sample size fixed in advance.
For the 20 values of \(\pi^{*}\) in
π_star_arrand \(t = 1, \ldots, 20\), compare the simulated lossV_fre_d_tat \(d^{*}\) with its minimum over a fine grid of values of \(d\). Do the same for the loss attained by a Nelder-Mead search over \(d\) that starts at \(d=1\).
Exercise 33.2
A frequentist can test the Navy Captain’s hunch without a prior.
Set \(\pi^{*}=0.5\) and take the error probabilities of the best fixed-sample rule: \(\alpha = PFA\) and \(\beta = 1 - PD\) at \(t_{\rm optimal}\).
Wald’s sequential probability ratio test with targets \((\alpha, \beta)\) uses the thresholds \(a(\alpha,\beta) = (1-\beta)/\alpha\) and \(b(\alpha,\beta) = \beta/(1-\alpha)\) of A Problem that Stumped Milton Friedman.
That lecture applies them to the likelihood ratio \(f_1/f_0 = 1/L\).
In terms of our \(L_t = L(z^t)\), the test is
accept \(f_0\) if \(L_t \geq A_L \equiv 1/b(\alpha,\beta) = (1-\alpha)/\beta\)
accept \(f_1\) if \(L_t \leq B_L \equiv 1/a(\alpha,\beta) = \alpha/(1-\beta)\)
draw another \(z\) if \(B_L < L_t < A_L\)
Simulate the test on the paths L0_arr and L1_arr.
Report its realized error probabilities, \(E_{f_0}[N]\), and \(E_{f_1}[N]\), and compare them with \(t_{\rm optimal}\).
Exercise 33.3
This exercise measures the value of sequential sampling.
Evaluate both rules on the simulated paths L0_arr and L1_arr, so that both use the same random numbers.
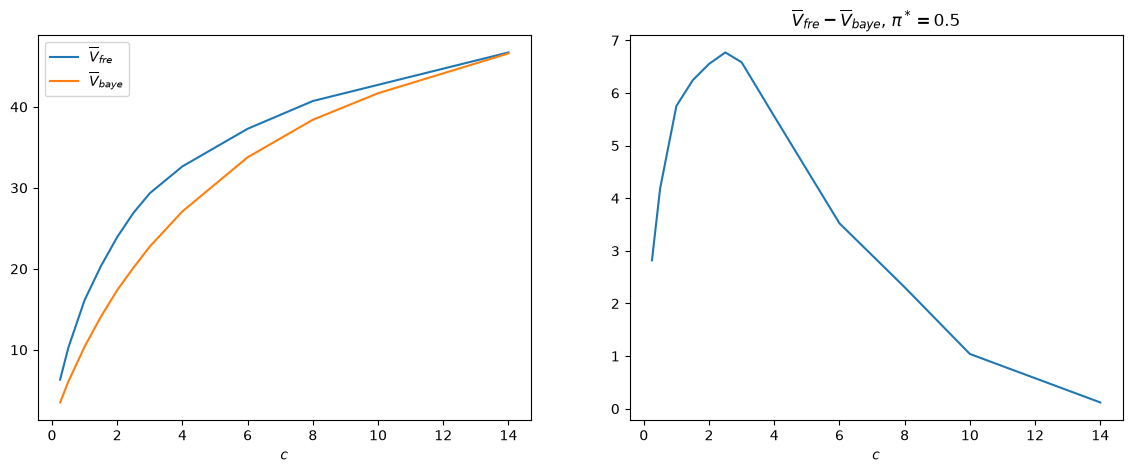
Set \(\pi^{*}=0.5\). For a grid of sampling costs \(c\) between \(0.25\) and \(14\), compute \(\bar V_{fre}\) and \(\bar V_{Bayes}\) and plot \(\bar V_{fre}-\bar V_{Bayes}\) against \(c\). For each \(c\), solve the Bayesian’s problem again to get new cutoffs \(A\) and \(B\). Let the fixed-sample rule choose \(t=0\), which means deciding without data at expected loss \(\min\{\pi^{*}\bar L_1, (1-\pi^{*})\bar L_0\}\).
Set \(c=1.25\) and \(\pi^{*}=0.5\), and let the Bayesian start from a prior \(\pi_0 \neq \pi^{*}\). Plot \(\bar V_{fre}-\bar V_{Bayes}(\pi_0)\) against \(\pi_0\). Do the same when the fixed-sample rule chooses \((t, d)\) with \(\pi_0\) in place of \(\pi^{*}\).
Solution
The function below computes the expected loss of the Bayesian rule with cutoffs \((B, A)\) and prior \(\pi_0\) when nature selects \(f_0\) with probability \(\pi^{*}\).
A Bayesian whose prior lies outside \((B, A)\) decides without data.
def V_baye_sim(A, B, π0, π_star, wf):

    if π0 >= A:
        return (1 - π_star) * wf.L0
    if π0 <= B:
        return π_star * wf.L1

    t0, c0 = check_results(L0_arr, A, B, 0, π0)
    t1, c1 = check_results(L1_arr, A, B, 1, π0)
    assert max(t0.max(), t1.max()) <= T     # every path decides by T

    V0 = wf.c * t0.mean() + wf.L1 * (1 - c0.mean())
    V1 = wf.c * t1.mean() + wf.L0 * (1 - c1.mean())

    return π_star * V0 + (1 - π_star) * V1
The misclassification losses of the fixed-sample rule do not depend on \(c\), so we compute them once.
π_star = 0.5
t_grid = np.arange(1, T+1)
loss_t = np.array([V_fre_t(t, L0_arr, L1_arr, π_star, wf)[0] for t in t_grid])
loss_0 = min(π_star * wf.L1, (1 - π_star) * wf.L0)   # decide with t = 0

c_grid = np.array([0.25, 0.5, 1, 1.5, 2, 2.5, 3, 4, 6, 8, 10, 14])
V_fre_c = np.empty_like(c_grid)
V_baye_c = np.empty_like(c_grid)

for i, c in enumerate(c_grid):
    seed_numba(1234)
    wf_c = WaldFriedman(c=c)
    B_c, A_c = find_cutoff_rule(wf_c, solve_model(wf_c))

    V_fre_c[i] = min(loss_0, (c * t_grid + loss_t).min())
    V_baye_c[i] = V_baye_sim(A_c, B_c, π_star, π_star, wf_c)

fig, axs = plt.subplots(1, 2, figsize=(14, 5))

axs[0].plot(c_grid, V_fre_c, label=r'$\overline{V}_{fre}$')
axs[0].plot(c_grid, V_baye_c, label=r'$\overline{V}_{baye}$')
axs[0].set_xlabel('$c$')
axs[0].legend()

axs[1].plot(c_grid, V_fre_c - V_baye_c)
axs[1].set_xlabel('$c$')
axs[1].set_title(r'$\overline{V}_{fre} - \overline{V}_{baye}$, $\pi^*=0.5$')

plt.show()

print(np.round(V_fre_c - V_baye_c, 2))
[2.82 4.18 5.75 6.24 6.55 6.77 6.58 5.56 3.52 2.31 1.04 0.12]
The gap rises from \(2.82\) at \(c=0.25\) to \(6.77\) at \(c=2.5\) and falls to \(0.12\) at \(c=14\).
When draws are cheap, both rules take many draws and rarely err.
When draws are expensive, both rules take about one draw.
At intermediate costs, the sequential rule stops early after informative draws, while the fixed-sample rule pays for draws that it does not need.
For the second part, compute_V_fre with \(\pi_0\) in place of \(\pi^{*}\) gives the fixed-sample rule that a decision maker with prior \(\pi_0\) would choose.
We evaluate that rule’s error probabilities with the weights \(\pi^{*}\) and \(1-\pi^{*}\).
V_fre_arr, _, _ = compute_V_fre(L0_arr, L1_arr, π_star, wf)
V_fre_bar = V_fre_arr.min()

π0_grid = np.linspace(0.1, 0.9, 17)
V_baye_π0 = np.empty_like(π0_grid)
V_fre_π0 = np.empty_like(π0_grid)

for i, π0 in enumerate(π0_grid):
    V_baye_π0[i] = V_baye_sim(A, B, π0, π_star, wf)

    V_arr, PFA_arr, PD_arr = compute_V_fre(L0_arr, L1_arr, π0, wf)
    k = np.argmin(V_arr)
    V_fre_π0[i] = (wf.c * (k + 1) + π_star * PFA_arr[k] * wf.L1
                   + (1 - π_star) * (1 - PD_arr[k]) * wf.L0)

plt.plot(π0_grid, V_fre_bar - V_baye_π0,
         label=r'fixed-sample rule designed with $\pi^*$')
plt.plot(π0_grid, V_fre_π0 - V_baye_π0,
         label=r'fixed-sample rule designed with $\pi_0$')
plt.axhline(0, color='k', lw=0.5)
plt.axvline(π_star, color='k', ls=':', lw=1)
plt.xlabel(r'$\pi_0$')
plt.title(r'$\overline{V}_{fre} - \overline{V}_{baye}(\pi_0)$, $\pi^*=0.5$')
plt.legend()
plt.show()

print(np.round(V_fre_bar - V_baye_π0, 2))
print(np.round(V_fre_π0 - V_baye_π0, 2))
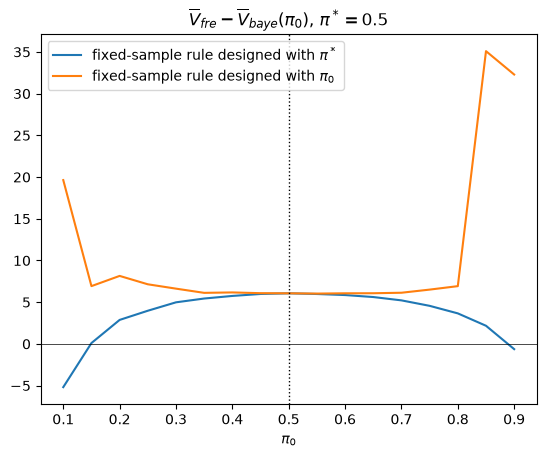
[-5.18  0.1   2.88  3.98  4.98  5.44  5.75  5.99  6.06  5.98  5.86  5.62
  5.22  4.56  3.66  2.17 -0.63]
[19.64  6.93  8.15  7.15  6.62  6.12  6.17  6.08  6.06  6.03  6.07  6.07
  6.13  6.51  6.92 35.09 32.29]
A Bayesian with a wrong prior still beats the correctly designed fixed-sample rule for \(0.15 \leq \pi_0 \leq 0.85\).
At \(\pi_0 = 0.1\) and \(\pi_0 = 0.9\), the Bayesian starts close to a cutoff and often accepts the wrong distribution.
When the fixed-sample rule uses the same wrong prior, the sequential rule wins at every \(\pi_0\) on the grid.