30. Blackwell’s Theorem on Comparing Experiments#
30.1. Overview#
This lecture studies Blackwell’s theorem [Blackwell, 1951, Blackwell, 1953] on ranking statistical experiments.
Our presentation brings in findings from a Bayesian interpretation of Blackwell’s theorem by Kihlstrom [1984].
Blackwell and Kihlstrom study statistical model-selection questions closely related to those encountered in this QuantEcon lecture Likelihood Ratio Processes and Bayesian Learning.
To appreciate the connection involved, it is helpful to appreciate how Blackwell’s notion of an experiment is related to the concept of a “probability distribution” or “parameterized statistical model” appearing in Likelihood Ratio Processes and Bayesian Learning
Blackwell studies a situation in which a decision maker wants to know the value of a state \(s\) that lives in a space \(S\).
For Blackwell, an experiment is a conditional probability model \(\{\mu(\cdot \mid s) : s \in S\}\), i.e., a family of probability distributions that are conditioned by the same state \(s \in S\).
We are free to interpret the “state” as a “parameter” or “parameter vector”.
In a two-state case \(S = \{s_1, s_2\}\), the two conditional densities \(f(\cdot) = \mu(\cdot \mid s_1)\) and \(g(\cdot) = \mu(\cdot \mid s_2)\) are the ones used repeatedly in our studies of classical hypothesis testing and Bayesian inference in this QuantEcon lecture Likelihood Ratio Processes and Bayesian Learning as well as several other lectures in this suite of QuantEcon lectures.
Kihlstrom [1984] interprets the question which experiment is more informative? as asking which conditional probability model allows a Bayesian decision maker with a prior over \(\{s_1, s_2\}\) to gather higher expected utility.
We’ll use the terms “signal” and “experiment” as synonyms.
Thus, suppose that two signals, \(\tilde{x}_\mu\) and \(\tilde{x}_\nu\), are both informative about an unknown state \(\tilde{s}\).
Signal \(\mu\) is at least as informative as signal \(\nu\) if every Bayesian decision maker can attain weakly higher expected utility with \(\mu\) than with \(\nu\).
This economic criterion is equivalent to two statistical criteria:
Sufficiency (Blackwell): \(\tilde{x}_\nu\) can be generated from \(\tilde{x}_\mu\) by an additional randomization.
Uncertainty reduction (DeGroot [1962]): \(\tilde{x}_\mu\) lowers expected uncertainty at least as much as \(\tilde{x}_\nu\) for every concave uncertainty function.
Kihlstrom’s formulation focuses on the posterior distribution.
More informative experiments generate posterior distributions that are more dispersed in convex order.
In the two-state case, this becomes a mean-preserving-spread comparison on \([0, 1]\), which can be checked with the integrated-CDF test used for second-order stochastic dominance.
Information and Market Equilibrium and The Design and Price of Information build on the results of this lecture.
The lecture proceeds as follows.
We define experiments as Markov matrices and garblings as stochastic transformations.
We state three equivalent criteria for ranking experiments and Blackwell’s theorem.
We develop Kihlstrom’s Bayesian interpretation through standard experiments, mean-preserving spreads, and convex order.
We study DeGroot’s uncertainty functions and two applications.
We connect Blackwell’s order to the data processing inequality and to the likelihood-ratio learning of Likelihood Ratio Processes and Bayesian Learning.
Python simulations illustrate each step.
We begin with some imports.
import numpy as np
import matplotlib.pyplot as plt
from scipy.optimize import minimize
30.2. Experiments and stochastic transformations#
30.2.1. The state space and experiments#
Let \(S = \{s_1, \ldots, s_N\}\) be a finite set of possible states of the world.
An experiment is described by the conditional distribution of an observed signal \(\tilde{x}\) given the state \(\tilde{s}\).
When the signal space is also finite, say \(X = \{x_1, \ldots, x_M\}\), an experiment reduces to an \(N \times M\) Markov matrix
Each row \(i\) gives the distribution of signals when the true state is \(s_i\).
μ = np.array([[0.6, 0.3, 0.1],
              [0.1, 0.3, 0.6]])

Q = np.array([[1.0, 0.0],
              [0.5, 0.5],
              [0.0, 1.0]])

ν = μ @ Q

print("Experiment μ (3 signals, rows sum to 1):")
print(μ)
print("\nStochastic transformation Q (3 × 2):")
print(Q)
print("\nExperiment ν = μ @ Q (2 signals):")
print(ν)
print("\nRow sums μ:", μ.sum(axis=1))
print("Row sums ν:", ν.sum(axis=1))
Experiment μ (3 signals, rows sum to 1):
[[0.6 0.3 0.1]
 [0.1 0.3 0.6]]

Stochastic transformation Q (3 × 2):
[[1.  0. ]
 [0.5 0.5]
 [0.  1. ]]

Experiment ν = μ @ Q (2 signals):
[[0.75 0.25]
 [0.25 0.75]]

Row sums μ: [1. 1.]
Row sums ν: [1. 1.]
30.2.2. Stochastic transformations#
A stochastic transformation \(Q\) maps signals from one experiment to signals from another by further randomization.
In the discrete setting with \(M\) input signals and \(K\) output signals, \(Q\) is an \(M \times K\) Markov matrix: \(q_{lk} \geq 0\) and \(\sum_k q_{lk} = 1\) for every row \(l\).
Definition 30.1 (Sufficiency)
Experiment \(\mu\) is sufficient for \(\nu\) if there exists a stochastic transformation \(Q\) (an \(M \times K\) Markov matrix) such that
meaning that an observer of \(\tilde{x}_\mu\) can generate the distribution of \(\tilde{x}_\nu\) by passing their signal through \(Q\).
With general signal spaces, \(Q\) is a Markov kernel and the condition reads \(\nu_i(E) = \int Q(x, E) \, \mu_i(dx)\) for every measurable set \(E\) of \(\nu\)’s signals and every state \(s_i\).
We write \(\mu \geq \nu\) when \(\mu\) is sufficient for \(\nu\), and we call \(\nu\) a garbling of \(\mu\).
If you observe the more informative signal \(\tilde{x}_\mu\), then you can always throw away information to reproduce a less informative signal.
The reverse generally fails: a garbling cannot restore what it discards.
We can verify this numerically using the two experiments \(\mu\) and \(\nu\) defined above.
The function below searches for a stochastic transformation \(Q\) that minimizes \(\|\nu - \mu \, Q\|\).
If an exact \(Q\) exists the residual will be close to zero; otherwise it will be large.
def find_stochastic_transform(μ, ν, tol=1e-8):
    """
    Find a row-stochastic matrix Q that minimizes ||ν - μ @ Q||.
    """
    _, M = μ.shape
    _, K = ν.shape

    def unpack(q_flat):
        return q_flat.reshape(M, K)

    def objective(q_flat):
        Q = unpack(q_flat)
        return np.linalg.norm(ν - μ @ Q)**2

    constraints = [
        {"type": "eq", "fun": lambda q_flat,
        row=i: unpack(q_flat)[row].sum() - 1.0}
        for i in range(M)
    ]
    bounds = [(0.0, 1.0)] * (M * K)
    Q0 = np.full((M, K), 1 / K).ravel()

    result = minimize(
        objective,
        Q0,
        method="SLSQP",
        bounds=bounds,
        constraints=constraints,
        options={"ftol": tol, "maxiter": 1_000},
    )

    Q = unpack(result.x)
    residual = np.linalg.norm(ν - μ @ Q)
    return Q, residual

# Forward: find Q such that ν = μ @ Q  (should succeed)
Q_fwd, res_fwd = find_stochastic_transform(μ, ν)
print("Forward (μ to ν):")
print(f"  residual = {res_fwd:.2e}")
print(f"  exact transformation exists: {res_fwd < 1e-6}")

# Reverse: find Q' such that μ = ν @ Q'  (should fail)
Q_rev, res_rev = find_stochastic_transform(ν, μ)
print("\nReverse (ν to μ):")
print(f"  residual = {res_rev:.2e}")
print(f"  exact transformation exists: {res_rev < 1e-6}")
Forward (μ to ν):
  residual = 5.05e-09
  exact transformation exists: True

Reverse (ν to μ):
  residual = 1.44e-01
  exact transformation exists: False
The forward residual is close to zero: a stochastic transformation from \(\mu\) to \(\nu\) exists, confirming that \(\mu\) is sufficient for \(\nu\).
The reverse residual is large: no stochastic transformation can recover \(\mu\) from \(\nu\).
Exercise 30.1 proves that no stochastic transformation maps \(\nu\) into \(\mu\).
A garbling can only pull posterior beliefs toward the prior, and \(\mu\) generates posteriors farther from the prior than \(\nu\) can reach.
30.3. Three equivalent criteria#
Blackwell’s theorem establishes that three different ways of comparing experiments all turn out to be equivalent.
30.3.1. Criterion 1: the economic criterion#
The first criterion compares experiments by their value to decision makers.
Let \(A\) be a compact set of actions and \(u: A \times S \to \mathbb{R}\) a bounded continuous utility function.
A decision maker observes \(x \in X\) and then chooses an action, possibly at random.
A decision rule \(\delta\) assigns to each signal \(x\) a probability distribution \(\delta(\cdot \mid x)\) over actions.
Let \(p = (p_1, \ldots, p_N)\) be the prior over states, and write
for the probability simplex.
For fixed \(A\) and \(u\), the set of achievable expected-utility vectors under experiment \(\mu\) is
Each \(v \in B(\mu, A, u)\) lists the expected utilities that one decision rule delivers in each state.
Randomized rules make \(B(\mu, A, u)\) convex.
They also make the replication argument below exact: a decision maker who sees \(\tilde{x}_\mu\) can draw a synthetic \(\tilde{x}_\nu\) and then follow any rule designed for \(\nu\).
Definition 30.2 (Economic criterion)
\(\mu\) is at least as informative as \(\nu\) in the economic sense if
for every compact action set \(A\) and every bounded continuous utility function \(u: A \times S \to \mathbb{R}\).
This criterion says that experiment \(\mu\) is better than experiment \(\nu\) if anything a decision maker can achieve after seeing \(\nu\), they can also achieve after seeing \(\mu\).
The reason is that a more informative experiment lets the agent imitate a less informative one by ignoring or garbling some of the extra information.
But the reverse need not be possible.
So \(B(\mu, A, u) \supseteq B(\nu, A, u)\) means that \(\mu\) gives the decision maker at least as many feasible expected-utility outcomes as \(\nu\).
Blackwell’s theorem below implies an equivalent comparison of values.
For every prior \(p \in P\), every \(A\), and every \(u\), the maximized expected utility \(\max_{v \in B(\mu, A, u)} \sum_i p_i v_i\) is at least as large under \(\mu\) as under \(\nu\).
A Bayesian decision maker attains that maximum with a deterministic rule that chooses an optimal action at each posterior; randomization matters only for the comparison of sets.
30.3.2. Criterion 2: the sufficiency criterion#
The second criterion is the sufficiency relation of Definition 30.1: \(\mu \geq \nu\) if \(\nu = \mu Q\) for some stochastic transformation \(Q\).
30.3.3. Criterion 3: the uncertainty criterion#
The third criterion compares experiments by how much they reduce uncertainty about the state.
DeGroot [1962] calls any concave function \(U: P \to \mathbb{R}\) an uncertainty function.
The prototypical example is Shannon entropy:
Definition 30.3 (DeGroot uncertainty criterion)
\(\mu\) reduces expected uncertainty at least as much as \(\nu\) if, for every prior \(p \in P\) and every concave \(U: P \to \mathbb{R}\),
where \(\hat\mu^p\) is the distribution of posterior beliefs induced by experiment \(\mu\) under prior \(p\).
Every experiment weakly lowers expected uncertainty.
To see why, let \(\tilde{\pi} = p^\mu(\tilde{x}_\mu)\) denote the random posterior induced by experiment \(\mu\).
Then \(\tilde{\pi}\) has distribution \(\hat\mu^p\), so
The posterior has mean \(p\) (Property 30.1 below), so Jensen’s inequality gives
Hence
so any experiment weakly lowers expected uncertainty.
Criterion 3 quantifies over every prior \(p\).
Blackwell’s theorem implies that one prior with full support suffices: if the inequality holds for every concave \(U\) at one such prior, it holds at every prior.
Kihlstrom’s construction below exploits this fact by working with a fixed prior \(c\), often the uniform prior \((1/N, \ldots, 1/N)\).
30.4. The main theorem#
Theorem 30.1 (Blackwell’s theorem)
The following three conditions are equivalent:
(i) Economic criterion: \(B(\mu, A, u) \supseteq B(\nu, A, u)\) for every compact \(A\) and every bounded continuous utility function \(u\).
(ii) Sufficiency criterion: There exists a stochastic transformation \(Q\) from the signal space of \(\mu\) to the signal space of \(\nu\) such that \(\nu = \mu Q\).
(iii) Uncertainty criterion: \(\int_P U(q)\,\hat\mu^p(dq) \leq \int_P U(q)\,\hat\nu^p(dq)\) for every concave \(U\), at every prior \(p \in P\), or equivalently at one prior with full support.
See also Blackwell [1951], Bohnenblust et al. [1949], and DeGroot [1962].
The hard part is the equivalence between the economic and sufficiency criteria.
Sketch (ii \(\Rightarrow\) i): If \(\nu = \mu Q\), then any decision rule based on \(\tilde{x}_\nu\) can be replicated by first observing \(\tilde{x}_\mu\), then drawing a synthetic \(\tilde{x}_\nu\) from \(Q\), and then applying the same rule.
Sketch (i \(\Rightarrow\) ii): Since \(B(\mu, A, u) \supseteq B(\nu, A, u)\) for every \(A\) and \(u\), a separating-hyperplane (duality) argument implies that the posterior distribution of \(\mu\) is a mean-preserving spread of that of \(\nu\), and Strassen’s theorem [Strassen, 1965] then supplies a posterior-space mean-preserving kernel \(D\) sending the standard experiment of \(\nu\) into that of \(\mu\). Passing from these posterior laws back to the original signal spaces then yields the required garbling \(Q\) with \(\nu = \mu Q\). Thus \(D\) is an intermediate randomization on posterior beliefs, not literally the signal-space kernel \(Q\).
Sketch (ii \(\Rightarrow\) iii): Under a garbling, the posterior from the coarser experiment is the conditional expectation of the posterior from the finer experiment, so Jensen’s inequality gives the result for every concave \(U\).
Sketch (iii \(\Rightarrow\) ii): The converse, that the inequality for all concave \(U\) forces the existence of \(Q\), is proved in [Blackwell, 1953]. Kihlstrom’s posterior-based representation makes the geometry transparent.
30.5. Kihlstrom’s Bayesian interpretation#
30.5.1. Posteriors and standard experiments#
The key object in Kihlstrom’s analysis is the posterior belief vector.
When prior \(p\) holds and experiment \(\mu\) produces signal \(x\), Bayes’ rule gives
The posterior \(p^\mu(x) \in P\) is a random point in the simplex.
Property 30.1 (Mean preservation)
The prior \(p\) is the expectation of the posterior:
This is sometimes called the law of iterated expectations for beliefs.
For a fixed prior \(c\), Kihlstrom’s standard experiment replaces the raw signals of \(\mu\) with the posterior beliefs they generate.
Let \(\hat\mu^c\) denote the distribution over posteriors induced by \(\mu\) under prior \(c\). Mean preservation implies \(\int_P q \, \hat\mu^c(dq) = c\).
Two experiments are informationally equivalent when they induce the same posterior distribution.
The standard experiment strips away every detail of the signal except its posterior, so it provides a canonical Bayesian representation for comparing experiments.
A stochastic kernel on posterior beliefs lives on the simplex \(P\), whereas a Blackwell garbling \(Q\) lives on the original signal space. Kihlstrom’s construction uses the former to study convex order and then recovers the latter after passing to standard experiments.
Any two experiments that generate the same distribution over posteriors lead to identical decisions for every Bayesian decision maker, regardless of how different their raw signal spaces may look.
30.5.2. Mean-preserving spreads and Blackwell’s order#
Kihlstrom’s key reformulation is the following.
Theorem 30.2 (Kihlstrom’s Reformulation)
\(\mu \geq \nu\) in Blackwell’s sense if and only if \(\hat\mu^c\) is a mean-preserving spread of \(\hat\nu^c\); that is,
for every convex function \(g: P \to \mathbb{R}\).
Equivalently, \(\hat\mu^c\) is larger than \(\hat\nu^c\) in convex order.
The prior \(c\) can be any prior with full support; the comparison does not depend on which one.
A better experiment spreads posterior beliefs farther from the prior while preserving their mean.
To see this concretely, we define two experiments for the two-state case and compute their posteriors.
def compute_posteriors(μ, prior, tol=1e-14):
    """
    Compute the posterior distribution for each signal realisation.
    """
    N, M = μ.shape
    signal_probs = μ.T @ prior
    numerators = μ.T * prior
    posteriors = np.zeros((M, N))
    np.divide(
        numerators,
        signal_probs[:, None],
        out=posteriors,
        where=signal_probs[:, None] > tol,
    )
    return posteriors, signal_probs


def check_mean_preservation(posteriors, signal_probs, prior):
    """Verify E[posterior] == prior."""
    expected_posterior = (posteriors * signal_probs[:, None]).sum(axis=0)
    return expected_posterior, np.allclose(expected_posterior, prior)


N = 2
prior = np.array([0.5, 0.5])

μ_info = np.array([[0.8, 0.2],
                   [0.2, 0.8]])

ν_info = np.array([[0.6, 0.4],
                   [0.4, 0.6]])

post_μ, probs_μ = compute_posteriors(μ_info, prior)
post_ν, probs_ν = compute_posteriors(ν_info, prior)

print("Experiment μ (more informative):\n")
print("Signal probabilities:", probs_μ.round(3))
print("Posteriors (row = signal, col = state):")
print(post_μ.round(3))
mean_μ, ok_μ = check_mean_preservation(post_μ, probs_μ, prior)
print(f"E[posterior] = {mean_μ.round(4)}  (equals prior: {ok_μ})")

print("\n Experiment ν (less informative):\n")
print("Signal probabilities:", probs_ν.round(3))
print("Posteriors:")
print(post_ν.round(3))
mean_ν, ok_ν = check_mean_preservation(post_ν, probs_ν, prior)
print(f"E[posterior] = {mean_ν.round(4)}  (equals prior: {ok_ν})")
Experiment μ (more informative):

Signal probabilities: [0.5 0.5]
Posteriors (row = signal, col = state):
[[0.8 0.2]
 [0.2 0.8]]
E[posterior] = [0.5 0.5]  (equals prior: True)

 Experiment ν (less informative):

Signal probabilities: [0.5 0.5]
Posteriors:
[[0.6 0.4]
 [0.4 0.6]]
E[posterior] = [0.5 0.5]  (equals prior: True)
For \(N = 2\) states, the simplex \(P\) is the unit interval \([0, 1]\) (the probability of state \(s_1\)).
We can directly plot the distribution of posteriors under experiments \(\mu\) and \(\nu\).
def plot_posterior_distributions(μ_matrix, ν_matrix, prior,
                                 labels=("μ (more informative)",
                                         "ν (less informative)")):
    """
    For a two-state experiment, plot the distribution of posteriors
    (i.e., the standard experiment distribution) on [0,1].
    """
    posts_μ, probs_μ = compute_posteriors(μ_matrix, prior)
    posts_ν, probs_ν = compute_posteriors(ν_matrix, prior)

    fig, axes = plt.subplots(1, 2, figsize=(11, 4), sharey=False)
    prior_val = prior[0]

    for ax, posts, probs, label in zip(
        axes, [posts_μ, posts_ν], [probs_μ, probs_ν], labels):
        p_s1 = posts[:, 0]
        ax.vlines(p_s1, 0, probs, linewidth=6, color="steelblue", alpha=0.7)
        ax.axvline(prior_val, color="tomato", linestyle="--", linewidth=2,
                   label=f"prior = {prior_val:.2f}")
        ax.set_xlim(0, 1)
        ax.set_xlabel(r"posterior $p(s_1 \mid x)$", fontsize=12)
        ax.set_ylabel("probability mass", fontsize=12)
        mean_post = (p_s1 * probs).sum()
        ax.axvline(mean_post, color="green", linestyle=":", linewidth=2,
                   label=f"E[post] = {mean_post:.2f}")
        ax.text(0.03, 0.94, label, transform=ax.transAxes, va="top")
        ax.legend()

    plt.tight_layout()
    plt.show()

plot_posterior_distributions(μ_info, ν_info, prior)
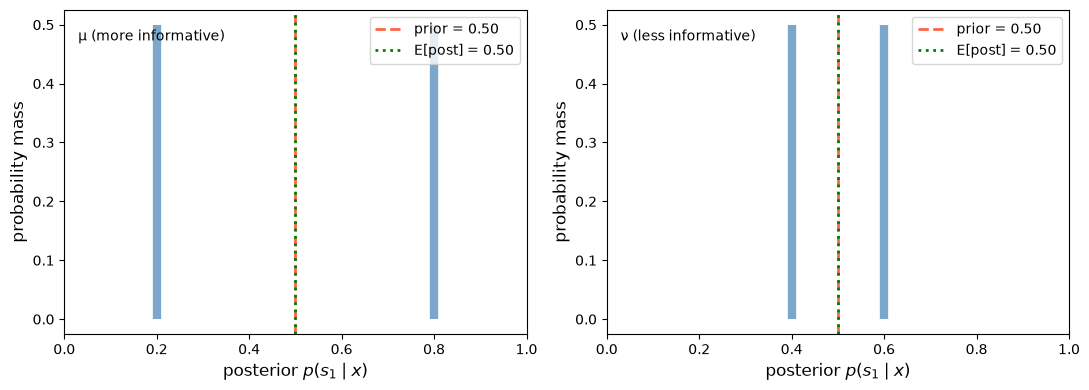
Fig. 30.1 Posterior distributions in the two-state case#
This is the mean-preserving spread in action: both distributions have the same mean (equal to the prior), but the more informative experiment \(\mu\) spreads its posteriors farther apart.
We can verify the mean-preserving spread condition numerically.
The key fact is that, up to an affine term, any convex function can be represented as a mixture of “call option” payoffs \(g_t(p) = \max(p - t, 0)\).
Because the two posterior distributions being compared have the same mean, that affine term cancels in the comparison.
So it suffices to check \(E[g_t(p^\mu)] \geq E[g_t(p^\nu)]\) for all thresholds \(t \in [0, 1]\).
def check_mps_convex_functions(μ_matrix, ν_matrix, prior, n_functions=200):
    """
    Verify the mean-preserving spread condition using
    convex functions g(p) = max(p - t, 0).
    """
    posts_μ, probs_μ = compute_posteriors(μ_matrix, prior)
    posts_ν, probs_ν = compute_posteriors(ν_matrix, prior)

    p_μ = posts_μ[:, 0]
    p_ν = posts_ν[:, 0]

    thresholds = np.linspace(0, 1, n_functions)
    diffs = []
    for t in thresholds:
        Eg_μ = (np.maximum(p_μ - t, 0) * probs_μ).sum()
        Eg_ν = (np.maximum(p_ν - t, 0) * probs_ν).sum()
        diffs.append(Eg_μ - Eg_ν)

    fig, ax = plt.subplots(figsize=(8, 4))
    ax.plot(thresholds, diffs, color="steelblue", linewidth=2)
    ax.axhline(0, color="tomato", linestyle="--", linewidth=2)
    ax.fill_between(thresholds, diffs, 0,
                    where=np.array(diffs) >= 0,
                    alpha=0.25, color="steelblue",
                    label="$E[g(p^μ)] - E[g(p^ν)] \\geq 0$")
    ax.set_xlabel("threshold $t$", fontsize=12)
    ax.set_ylabel(r"$E[\max(p-t,0)]$ difference", fontsize=12)
    ax.legend(fontsize=11)
    plt.tight_layout()
    plt.show()

    all_non_negative = all(d >= -1e-10 for d in diffs)
    print(f"μ is a mean-preserving spread of ν: {all_non_negative}")
    return diffs

_ = check_mps_convex_functions(μ_info, ν_info, prior)
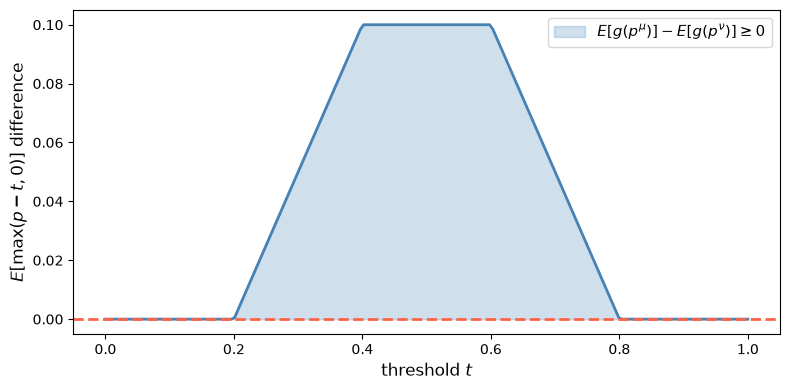
Fig. 30.2 Convex-order check in the two-state case#
μ is a mean-preserving spread of ν: True
The difference \(E[g_t(p^\mu)] - E[g_t(p^\nu)]\) is non-negative for every threshold \(t\), confirming that \(\hat\mu^c\) is a mean-preserving spread of \(\hat\nu^c\) and therefore \(\mu \geq \nu\) in the Blackwell order.
30.5.3. Convex order and second-order stochastic dominance#
A random variable \(X\) dominates \(Y\) in the concave order if \(E[u(X)] \geq E[u(Y)]\) for every concave function \(u\).
Taking \(u(x) = x\) and \(u(x) = -x\) shows that the two means must be equal.
\(X\) dominates \(Y\) in the concave order if and only if \(Y\) is a mean-preserving spread of \(X\).
Second-order stochastic dominance uses only increasing concave \(u\) and allows the means to differ; when the means are equal it coincides with the concave order.
Because uncertainty functions are concave, the condition
says that the posterior under \(\nu\) dominates the posterior under \(\mu\) in the concave order, so that \(\hat\mu^c\) dominates \(\hat\nu^c\) in convex order on \(P\).
When \(N = 2\), posterior beliefs are scalars in \([0, 1]\), and the comparison reduces to the classical integrated-CDF test.
Given equal means, \(\hat\mu^c\) is a mean-preserving spread of \(\hat\nu^c\) if and only if \(\int_0^t F_\mu(s)\,ds \geq \int_0^t F_\nu(s)\,ds\) for all \(t \in [0,1]\), where \(F_\mu\) and \(F_\nu\) are the CDFs of the posterior on \(s_1\) under each experiment.
Both posterior distributions have mean equal to the prior, so the test applies.
We verify it for the two-state example above.
def cdf_data_1d(weights, values):
    """Sort support points and cumulative masses for a discrete distribution."""
    idx = np.argsort(values)
    sorted_vals = values[idx]
    sorted_wts = weights[idx]
    cum_mass = np.cumsum(sorted_wts)
    return sorted_vals, cum_mass


def plot_sosd_posteriors(μ_matrix, ν_matrix, prior):
    """Plot CDFs and integrated CDFs for the posterior-on-s1 distributions."""
    posts_μ, probs_μ = compute_posteriors(μ_matrix, prior)
    posts_ν, probs_ν = compute_posteriors(ν_matrix, prior)

    p_μ = posts_μ[:, 0]
    p_ν = posts_ν[:, 0]

    sv_μ, cm_μ = cdf_data_1d(probs_μ, p_μ)
    sv_ν, cm_ν = cdf_data_1d(probs_ν, p_ν)

    fig, axes = plt.subplots(1, 2, figsize=(11, 4))

    ax = axes[0]
    for sv, cm, lbl, c in [(sv_μ, cm_μ, "μ", "steelblue"),
                           (sv_ν, cm_ν, "ν", "darkorange")]:
        xs = np.concatenate([[0], sv, [1]])
        ys = np.concatenate([[0], cm, [1]])
        ax.step(xs, ys, where="post", label=lbl, color=c, linewidth=2)
    ax.axvline(prior[0], linestyle="--", color="gray", alpha=0.6, linewidth=2,
               label="prior")
    ax.set_xlabel(r"posterior $p(s_1 \mid x)$", fontsize=12)
    ax.set_ylabel("cumulative probability", fontsize=12)
    ax.text(0.03, 0.94, "CDFs", transform=ax.transAxes, va="top")
    ax.legend(fontsize=11)

    ax2 = axes[1]
    grid = np.linspace(0, 1, 200)

    def integrated_cdf(sorted_vals, cum_mass, grid):
        cdf = np.array([cum_mass[sorted_vals <= t].max()
                        if np.any(sorted_vals <= t) else 0.0
                        for t in grid])
        return np.cumsum(cdf) * (grid[1] - grid[0])

    int_μ = integrated_cdf(sv_μ, cm_μ, grid)
    int_ν = integrated_cdf(sv_ν, cm_ν, grid)

    ax2.plot(grid, int_μ, label=r"$\int F_\mu$", color="steelblue", linewidth=2)
    ax2.plot(grid, int_ν, color="darkorange",
             label=r"$\int F_\nu$", linewidth=2)
    ax2.fill_between(grid, int_ν, int_μ,
                     where=int_μ >= int_ν,
                     alpha=0.2, color="steelblue",
                     label=(r"$\int F_\mu \geq \int F_\nu$"
                            r" ($\mu$ is an MPS of $\nu$)"))
    ax2.set_xlabel(r"$t$", fontsize=12)
    ax2.set_ylabel("integrated CDF", fontsize=12)
    ax2.text(0.03, 0.94, "integrated CDFs", transform=ax2.transAxes, va="top")
    ax2.legend(fontsize=10)

    plt.tight_layout()
    plt.show()

plot_sosd_posteriors(μ_info, ν_info, prior)
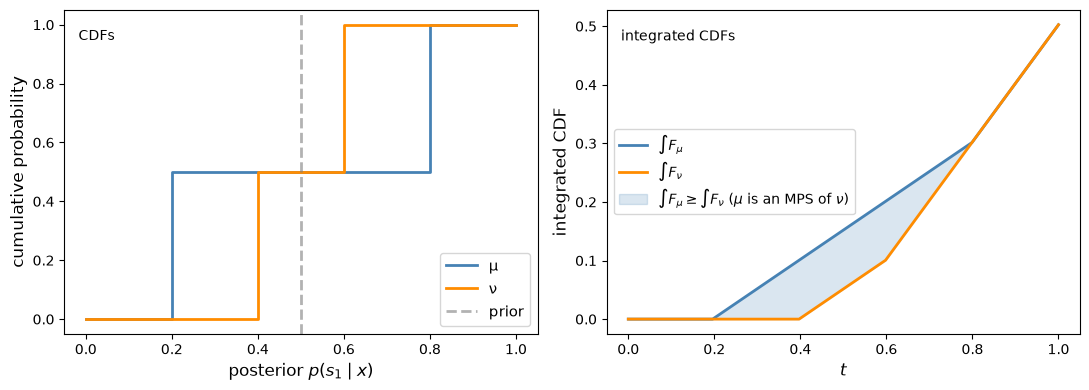
Fig. 30.3 Integrated-CDF check in the two-state case#
30.6. Simulating the Blackwell order with many states#
We now move to a three-state example.
Experiment \(\mu\) is strongly correlated with the state, and experiment \(\nu\) is a garbling of \(\mu\).
N3 = 3
prior3 = np.array([1/3, 1/3, 1/3])

μ3 = np.array([[0.7, 0.2, 0.1],
               [0.1, 0.7, 0.2],
               [0.2, 0.1, 0.7]])

Q3 = np.array([[0.9, 0.05, 0.05],
               [0.05, 0.8, 0.15],
               [0.05, 0.15, 0.8]])

ν3 = μ3 @ Q3

print("μ (3×3):")
print(np.round(μ3, 2))
print("\nQ (garbling):")
print(np.round(Q3, 2))
print("\nν = μ @ Q:")
print(np.round(ν3, 3))
μ (3×3):
[[0.7 0.2 0.1]
 [0.1 0.7 0.2]
 [0.2 0.1 0.7]]

Q (garbling):
[[0.9  0.05 0.05]
 [0.05 0.8  0.15]
 [0.05 0.15 0.8 ]]

ν = μ @ Q:
[[0.645 0.21  0.145]
 [0.135 0.595 0.27 ]
 [0.22  0.195 0.585]]
For three states, posterior beliefs live in a 2-simplex.
Let’s plot the posterior atoms under \(\mu\) and \(\nu\), with marker area proportional to probability
def simplex_to_cart(pts):
    """Convert barycentric coordinates on the 2-simplex to 2-D Cartesian coordinates."""
    corners = np.array([[0.0, 0.0],
                        [1.0, 0.0],
                        [0.5, np.sqrt(3)/2]])
    return pts @ corners


def plot_simplex_posteriors(μ_matrix, ν_matrix, prior3):
    """Plot posterior atoms on the 2-simplex, with area proportional to probability."""
    corners = simplex_to_cart(np.eye(3))
    prior_cart = simplex_to_cart(prior3[None, :])[0]

    fig, axes = plt.subplots(1, 2, figsize=(12, 5))
    panel_labels = ["μ (more informative)", "ν (garbled)"]
    colors = ["steelblue", "darkorange"]
    labels = ["$s_1$", "$s_2$", "$s_3$"]
    offsets = [(-0.07, -0.05), (0.02, -0.05), (-0.02, 0.03)]

    for ax, m, c, panel_label in zip(axes, [μ_matrix, ν_matrix],
                                     colors, panel_labels):
        posts, probs = compute_posteriors(m, prior3)
        cart = simplex_to_cart(posts)
        tri = plt.Polygon(corners, fill=False, edgecolor="black", linewidth=2)
        ax.add_patch(tri)
        ax.scatter(cart[:, 0], cart[:, 1], s=3000 * probs, alpha=0.6, color=c)
        ax.scatter(*prior_cart, s=120, color="red", zorder=5,
                   label="prior", marker="*")
        for i, (lbl, off) in enumerate(zip(labels, offsets)):
            ax.text(corners[i][0] + off[0], corners[i][1] + off[1],
                    lbl, fontsize=13)
        ax.set_xlim(-0.15, 1.15)
        ax.set_ylim(-0.1, np.sqrt(3)/2 + 0.1)
        ax.set_aspect("equal")
        ax.set_xticks([])
        ax.set_yticks([])
        ax.text(0.03, 0.94, panel_label, transform=ax.transAxes, va="top")
        ax.legend(fontsize=11, loc="upper right")

    plt.tight_layout()
    plt.show()

plot_simplex_posteriors(μ3, ν3, prior3)
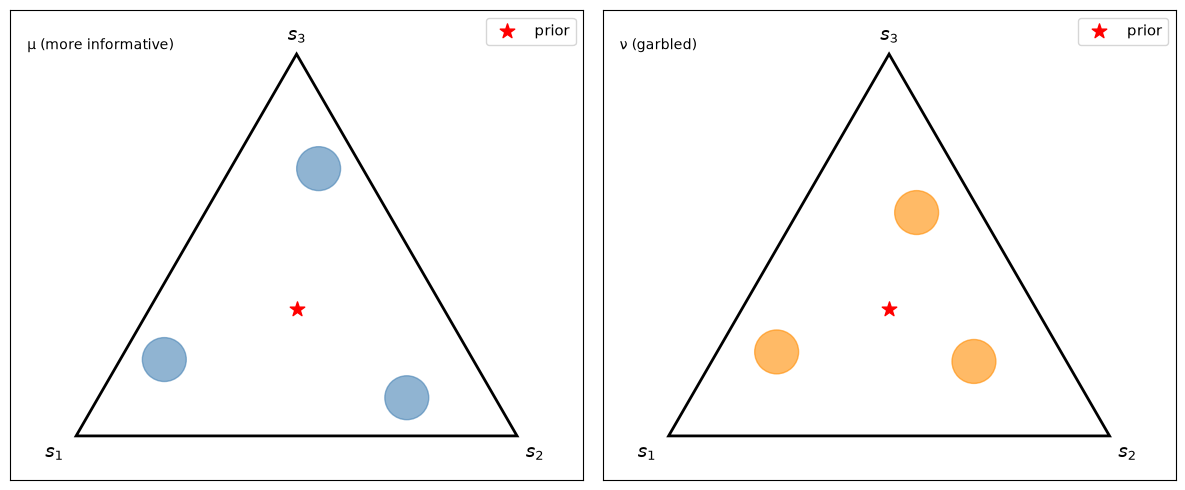
Fig. 30.4 Posterior atoms on the 2-simplex#
Under \(\mu\), the posterior atoms lie farther toward the vertices.
Under the garbled experiment \(\nu\), they lie closer to the prior.
The call-option test does not extend to the simplex.
The garbling \(Q_3\) itself certifies that \(\mu_3 \geq \nu_3\), and the next section checks several concave uncertainty functions in this example.
30.7. The DeGroot uncertainty function#
30.7.1. Concave uncertainty functions and the value of information#
[DeGroot, 1962] formalizes the value of information through an uncertainty function \(U: P \to \mathbb{R}\).
DeGroot’s definition requires only concavity, so that observing any signal weakly reduces expected uncertainty.
Common examples, such as Shannon entropy, are also symmetric in the components of \(p\) and maximized at the uniform prior.
Blackwell’s equivalence uses every concave \(U\), symmetric or not; Exercise 30.2 shows why asymmetric functions matter.
The value of experiment \(\mu\) given prior \(p\) is
This quantity is the expected reduction in uncertainty.
Blackwell’s order is equivalent to the statement that \(I(\tilde{x}_\mu; \tilde{s}; U) \geq I(\tilde{x}_\nu; \tilde{s}; U)\) for every concave \(U\).
30.7.2. Shannon entropy as a special case#
The canonical uncertainty function is Shannon entropy
For any prior \(p\), DeGroot’s value formula becomes
where \(H(\tilde{s}) = U_H(p)\) is the entropy of the prior and \(H(\tilde{s} \mid \tilde{x}_\mu)\) is the conditional entropy of the state given the signal.
Under the uniform prior, \(H(\tilde{s}) = \log N\).
To see why, write \(H(\tilde{s} \mid \tilde{x}_\mu) = \sum_x \Pr(\tilde{x}_\mu = x) \, H(\tilde{s} \mid \tilde{x}_\mu = x)\), where each conditional entropy term equals \(-\sum_i p_i^\mu(x) \log p_i^\mu(x) = U_H(p^\mu(x))\).
Substituting into DeGroot’s formula gives \(I = U_H(p) - \mathbb{E}[U_H(p^\mu)] = H(\tilde{s}) - H(\tilde{s} \mid \tilde{x}_\mu)\), which is exactly the mutual information between \(\tilde{x}_\mu\) and \(\tilde{s}\).
Note
Blackwell’s order implies the entropy inequality.
Because entropy is strictly concave, a strict Blackwell improvement raises mutual information strictly.
The converse fails: a ranking by mutual information does not imply a ranking by Blackwell’s order.
Two experiments can be incomparable in Blackwell’s order while one has higher mutual information, or while both have the same mutual information, as in Exercise 30.2.
The full Blackwell ordering requires the inequality to hold for every concave \(U\), not just Shannon entropy.
def entropy(p, ε=1e-12):
    """Shannon entropy of a probability vector."""
    p = np.asarray(p, dtype=float)
    p = np.clip(p, ε, 1.0)
    return -np.sum(p * np.log(p))


def degroot_value(μ_matrix, prior, U_func):
    """
    Compute DeGroot's value of information I = U(prior) - E[U(posterior)].
    """
    posts, probs = compute_posteriors(μ_matrix, prior)
    prior_uncertainty = U_func(prior)
    expected_post_uncertainty = sum(
        probs[j] * U_func(posts[j]) for j in range(len(probs)))
    return prior_uncertainty - expected_post_uncertainty


def gini_impurity(p):
    """Gini impurity: 1 - sum(p_i^2)."""
    return 1.0 - np.sum(np.asarray(p)**2)


def tsallis_entropy(p, q=2):
    """Tsallis entropy of order q (concave for q>1)."""
    p = np.clip(p, 1e-12, 1.0)
    return (1 - np.sum(p**q)) / (q - 1)


def tsallis_q15(p):
    """Tsallis entropy with q=1.5 for an independent concavity check."""
    return tsallis_entropy(p, q=1.5)


def sqrt_index(p):
    """Concave uncertainty index based on sum(sqrt(p_i))."""
    p = np.clip(np.asarray(p), 0.0, 1.0)
    return np.sum(np.sqrt(p)) - 1.0

uncertainty_functions = {
    "Shannon entropy": entropy,
    "Gini impurity": gini_impurity,
    "Tsallis (q=1.5)": tsallis_q15,
    "Square-root index": sqrt_index,
}

header = (f"{'Uncertainty function':<22}  "
          f"{'I(μ)':<10}  {'I(ν)':<10}  "
          f"{'I(μ)>=I(ν)?'}")
print(header)
print("-" * 58)
for name, U in uncertainty_functions.items():
    I_μ = degroot_value(μ_info, prior, U)
    I_ν = degroot_value(ν_info, prior, U)
    print(f"{name:<22}  {I_μ:<10.4f}  {I_ν:<10.4f}  {I_μ >= I_ν - 1e-10}")

print("\nThree-state example (μ3, ν3, uniform prior):")
print(header)
print("-" * 58)
for name, U in uncertainty_functions.items():
    I_μ = degroot_value(μ3, prior3, U)
    I_ν = degroot_value(ν3, prior3, U)
    print(f"{name:<22}  {I_μ:<10.4f}  {I_ν:<10.4f}  {I_μ >= I_ν - 1e-10}")
Uncertainty function    I(μ)        I(ν)        I(μ)>=I(ν)?
----------------------------------------------------------
Shannon entropy         0.1927      0.0201      True
Gini impurity           0.1800      0.0200      True
Tsallis (q=1.5)         0.1958      0.0213      True
Square-root index       0.0726      0.0072      True

Three-state example (μ3, ν3, uniform prior):
Uncertainty function    I(μ)        I(ν)        I(μ)>=I(ν)?
----------------------------------------------------------
Shannon entropy         0.2968      0.1690      True
Gini impurity           0.2067      0.1183      True
Tsallis (q=1.5)         0.2588      0.1487      True
Square-root index       0.1319      0.0734      True
As predicted by the theorem, \(I(\mu) \geq I(\nu)\) for every concave uncertainty function in both examples, because \(\mu \geq \nu\) in the Blackwell sense.
30.7.3. Value of information as a function of experiment quality#
We now parameterize a continuum of experiments between the uninformative and perfectly informative cases.
For \(N = 2\) states, a natural family is
The first term is the completely mixed matrix and \(I_2\) is the identity.
The family is ordered by Blackwell’s criterion: for \(\theta' < \theta\), \(\mu(\theta') = \mu(\theta) \, \mu(\theta' / \theta)\), so a lower-quality experiment is a garbling of a higher-quality one.
def make_experiment(θ, N=2):
    """Parameterized experiment: θ=0 is uninformative, θ=1 is perfect."""
    return (1 - θ) * np.ones((N, N)) / N + θ * np.eye(N)


θs = np.linspace(0, 1, 100)
prior2 = np.array([0.5, 0.5])

fig, ax = plt.subplots(figsize=(9, 4))
for name, U in uncertainty_functions.items():
    values = [degroot_value(make_experiment(θ), prior2, U) for θ in θs]
    vmin, vmax = values[0], values[-1]
    normed = (np.array(values) - vmin) / (vmax - vmin + 1e-15)
    ax.plot(θs, normed, label=name, linewidth=2)

ax.set_xlabel("experiment quality θ  (0 = uninformative, 1 = perfect)",
              fontsize=11)
ax.set_ylabel("normalized value of information I(μ(θ))", fontsize=11)
ax.legend(fontsize=10)
plt.tight_layout()
plt.show()
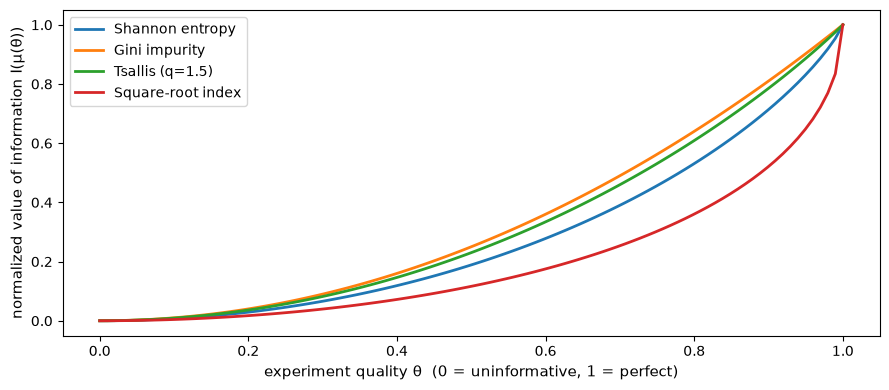
Fig. 30.5 Value of information and experiment quality#
Every concave uncertainty function assigns weakly higher value to a more informative experiment.
30.8. Application 1: demand for information about product quality#
Kihlstrom [1974] applies Blackwell’s theorem to a consumer’s demand for information about product quality.
The unknown state \(\tilde{s}\) is the quality of a product.
A consumer can purchase \(\lambda\) units of information at cost \(c \lambda^2\).
As \(\lambda\) rises, the experiment becomes more informative in Blackwell’s sense.
Absent costs, the Blackwell order says that more information is better for every expected-utility maximizer.
With costs, the consumer chooses \(\lambda\) to maximize the net value of information.
We let the accuracy of the experiment rise with diminishing returns, \(\phi(\lambda) = 1 - e^{-a \lambda}\), and feed it into the family \(\mu(\phi)\) above.
We measure the gross value of information by DeGroot’s entropy value, a stand-in for the consumer’s expected-utility gain in Kihlstrom [1974].
The Design and Price of Information studies the sale of information to buyers whose values for it differ.
def gross_value(λ, prior2, U=entropy, rate=2):
    """Gross value of buying λ units of information."""
    accuracy = 1 - np.exp(-rate * λ)
    return degroot_value(make_experiment(accuracy), prior2, U)


λ_grid = np.linspace(0, 1, 200)
c = 0.6

gross_vals = np.array([gross_value(λ, prior2) for λ in λ_grid])
cost_vals = c * λ_grid**2
net_vals = gross_vals - cost_vals
marginal_vals = np.gradient(gross_vals, λ_grid)
marginal_cost = 2 * c * λ_grid
opt_idx = int(np.argmax(net_vals))

fig, axes = plt.subplots(1, 2, figsize=(12, 4))

ax = axes[0]
ax.plot(λ_grid, gross_vals, label="Gross value I(λ)",
        color="steelblue", linewidth=2)
ax.plot(λ_grid, cost_vals, label=r"Cost $c\lambda^2$",
        color="tomato", linestyle="--", linewidth=2)
ax.plot(λ_grid, net_vals, label="Net value", color="green", linewidth=2)
ax.axvline(λ_grid[opt_idx], color="green", linestyle=":", linewidth=2,
           label=f"λ* ≈ {λ_grid[opt_idx]:.2f}")
ax.set_xlabel("information purchased λ", fontsize=11)
ax.set_ylabel("value (entropy units)", fontsize=11)
ax.legend(fontsize=10)

ax2 = axes[1]
ax2.plot(λ_grid, marginal_vals, label="Marginal value I'(λ)",
         color="steelblue", linewidth=2)
ax2.plot(λ_grid, marginal_cost, label=r"Marginal cost $2c\lambda$",
         color="tomato", linestyle="--", linewidth=2)
ax2.axvline(λ_grid[opt_idx], color="green", linestyle=":", linewidth=2,
            label=f"λ* ≈ {λ_grid[opt_idx]:.2f}")
ax2.set_xlabel("information purchased λ", fontsize=11)
ax2.set_ylabel("marginal value / cost", fontsize=11)
ax2.legend(fontsize=10)

plt.tight_layout()
plt.show()
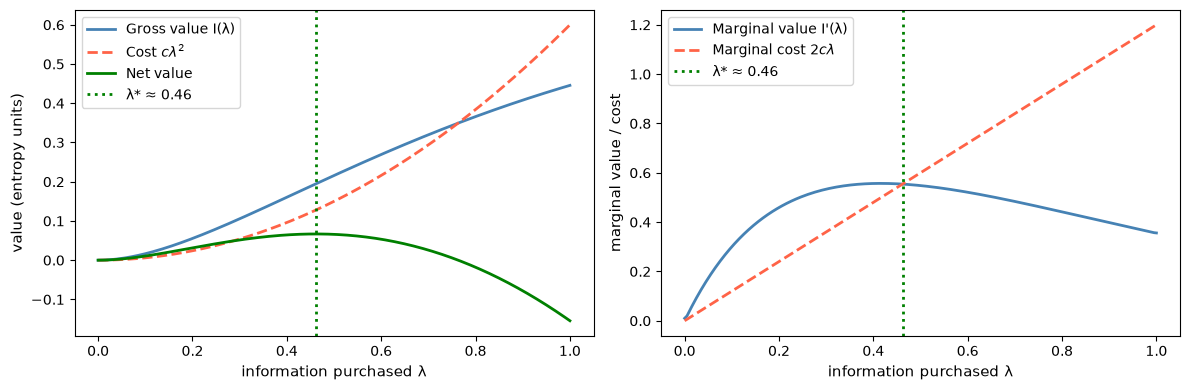
Fig. 30.6 Demand for information with a quadratic cost#
The optimal purchase \(\lambda^*\) occurs where marginal value equals marginal cost.
The marginal value first rises and then falls.
Near \(\lambda = 0\) the value of information is convex: it grows only quadratically in the accuracy of the experiment.
Radner and Stiglitz [1984] show that this nonconcavity of the value of information is general, so that demand for information can jump from zero to a positive amount as its price falls.
Because accuracy has diminishing returns, the marginal value eventually falls below the rising marginal cost, which yields an interior optimum here.
Raising \(c\) shifts the marginal cost curve up and reduces \(\lambda^*\), while a more asymmetric prior shifts the marginal value curve and changes the optimum.
30.9. Application 2: sequential experimental design#
DeGroot [1962] applies the uncertainty-function framework to sequential experimental design.
Each period a statistician observes one draw and updates the posterior.
The question is which sequence of experiments minimizes cumulative expected uncertainty.
If one experiment is more informative than another at every stage, then the Blackwell order favors using the better experiment at every date.
A Problem that Stumped Milton Friedman and A Bayesian Formulation of Friedman and Wald’s Problem study a complementary question: when to stop sampling from a fixed experiment.
We now simulate sequential belief updating for experiments of different quality.
def sequential_update(μ_matrix, prior, T=20, seed=0):
    """Simulate T sequential belief updates under experiment μ."""
    rng = np.random.default_rng(seed)
    N, M = μ_matrix.shape
    beliefs = np.zeros((T + 1, N))
    beliefs[0] = prior.copy()

    true_state = rng.choice(N, p=prior)

    for t in range(T):
        p = beliefs[t]
        signal = rng.choice(M, p=μ_matrix[true_state])
        unnorm = μ_matrix[:, signal] * p
        beliefs[t + 1] = unnorm / unnorm.sum()

    return beliefs, true_state


def plot_sequential_beliefs(θs_compare, prior2, T=25):
    fig, axes = plt.subplots(1, len(θs_compare), figsize=(14, 4), sharey=True)

    for ax, θ in zip(axes, θs_compare):
        μ_t = make_experiment(θ, N=2)
        for seed in range(15):
            beliefs, ts = sequential_update(μ_t, prior2, T=T, seed=seed)
            c = "steelblue" if ts == 0 else "darkorange"
            ax.plot(beliefs[:, 0], alpha=0.35, color=c, linewidth=2)
        ax.axhline(prior2[0], linestyle="--", color="gray", linewidth=2,
                   label="prior")
        ax.axhline(1.0, linestyle=":", color="steelblue", linewidth=2)
        ax.axhline(0.0, linestyle=":", color="darkorange", linewidth=2)
        ax.set_xlabel(r"period $t$", fontsize=11)
        if θ == θs_compare[0]:
            ax.set_ylabel(r"posterior $p(s_1 \mid x^t)$", fontsize=11)
        ax.set_ylim(-0.05, 1.05)
        ax.text(0.03, 0.94, f"θ = {θ}", transform=ax.transAxes, va="top")
        ax.legend(fontsize=9)

    plt.tight_layout()
    plt.show()

plot_sequential_beliefs([0.2, 0.5, 0.9], prior2, T=30)
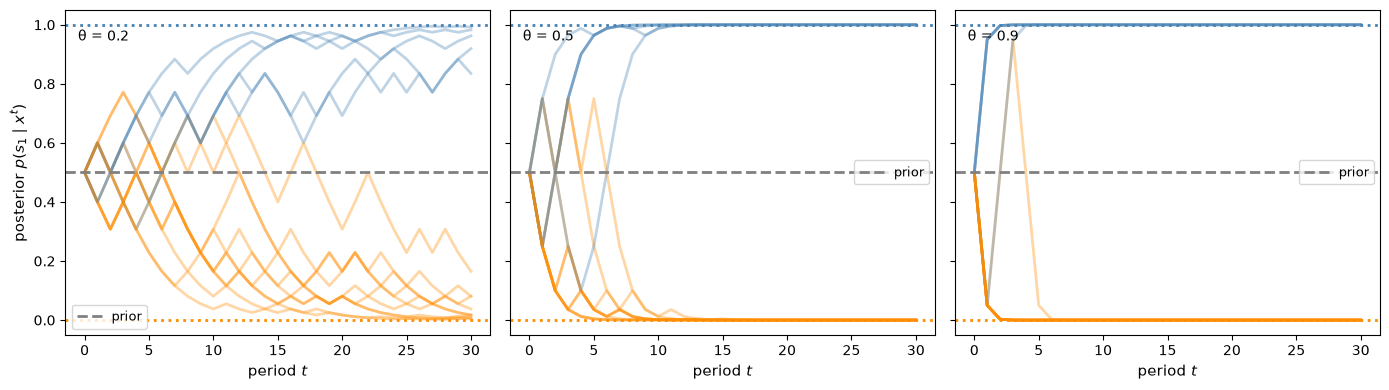
Fig. 30.7 Sequential posterior paths for different experiment qualities#
More informative experiments make beliefs converge faster to the truth.
Likelihood Ratio Processes shows that the log likelihood ratio drifts at a rate equal to a Kullback–Leibler divergence between the two rows of the experiment, and that divergence rises with \(\theta\).
Under the correct prior, the posterior process is a martingale.
def check_martingale_mean(μ_matrix, prior, T=15, n_paths=2000, seed=0):
    """
    Simulate many belief paths and check E[p_t] = p_0.
    """
    rng = np.random.default_rng(seed)
    N, M = μ_matrix.shape
    all_paths = np.zeros((n_paths, T + 1, N))

    for k in range(n_paths):
        true_state = rng.choice(N, p=prior)
        p = prior.copy()
        all_paths[k, 0] = p
        for t in range(T):
            signal = rng.choice(M, p=μ_matrix[true_state])
            unnorm = μ_matrix[:, signal] * p
            p = unnorm / unnorm.sum()
            all_paths[k, t + 1] = p

    mean_path = all_paths[:, :, 0].mean(axis=0)

    fig, ax = plt.subplots(figsize=(8, 4))
    ax.plot(mean_path, color="steelblue", linewidth=2,
            label=r"$\bar p_t(s_1)$ (mean over paths)")
    ax.axhline(prior[0], linestyle="--", color="tomato", linewidth=2,
               label=fr"Prior $p_0 = {prior[0]:.2f}$")
    ax.set_xlabel(r"period $t$", fontsize=12)
    ax.set_ylabel(r"$E[p_t(s_1)]$", fontsize=12)
    ax.legend(fontsize=11)
    ax.set_ylim(0, 1)
    plt.tight_layout()
    plt.show()

    print(f"Prior = {prior[0]:.4f}")
    print(f"Average mean belief across dates: {mean_path.mean():.4f}")

check_martingale_mean(μ_info, prior, T=20, n_paths=5000)
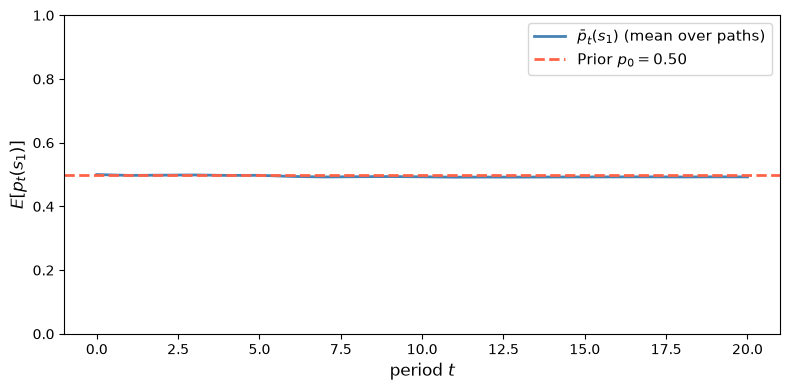
Fig. 30.8 Unconditional implication of the posterior martingale property#
Prior = 0.5000
Average mean belief across dates: 0.4942
The simulated cross-sectional mean stays close to the prior at every date.
This is the unconditional implication of the posterior martingale property.
Merging of Opinions: The Blackwell–Dubins Theorem studies the almost-sure convergence of such belief martingales and the Blackwell–Dubins theorem on the merging of opinions.
30.10. The Data Processing Inequality and Coarse-Graining#
Blackwell’s condition that \(\nu = \mu Q\) for some Markov kernel \(Q\) is the same mathematical operation that underlies the data processing inequality (DPI) and the coarse-graining theorem in information theory, information geometry, and machine learning.
30.10.1. The DPI for f-divergences#
An f-divergence between two probability distributions \(P\) and \(Q\) over a finite space \(\Omega\) is
where \(f : (0,\infty) \to \mathbb{R}\) is a convex function with \(f(1) = 0\).
Special cases include:
Divergence |
Generator \(f(t)\) |
|---|---|
KL-divergence |
\(t \log t\) |
Squared Hellinger \(H^2\) |
\((\sqrt{t} - 1)^2 / 2\) |
Total variation TV |
\(\lvert t - 1 \rvert / 2\) |
Chi-squared \(\chi^2\) |
\((t-1)^2\) |
The class of f-divergences was introduced independently by Ali and Silvey [1966], Csiszár [1963], and Morimoto [1963]; see also Liese [2012].
Statistical Divergence Measures studies several of these divergences for continuous distributions.
Theorem 30.3 (Data Processing Inequality)
For any f-divergence \(D_f\) and any Markov kernel (stochastic transformation) \(\kappa\), with \(P \kappa\) denoting the image of \(P\) under \(\kappa\), we have
If \(\kappa\) is induced by a sufficient statistic for the pair \(\{P, Q\}\), then equality holds.
A converse of this form requires additional hypotheses; a clean binary-model characterization is given below.
The proof follows from Jensen’s inequality applied to the convex function \(f\), using the fact that \(\kappa\) is a stochastic matrix [Csiszár, 1963].
30.10.2. Connection to Blackwell’s sufficiency condition#
In Blackwell’s framework, \(\mu\) and \(\nu\) are experiments over the same state space \(S = \{s_1, \ldots, s_N\}\).
For two states, each experiment has two rows: \(\mu_1 = \mu(s_1, \cdot)\) and \(\mu_2 = \mu(s_2, \cdot)\).
If \(\nu = \mu Q\) (i.e., \(\nu\) is a garbling of \(\mu\)), then the pair \((\nu_1, \nu_2) = (\mu_1 Q, \mu_2 Q)\) is obtained by applying the Markov kernel \(Q\) to the pair \((\mu_1, \mu_2)\).
The coarse-graining theorem then implies immediately:
whenever \(\mu \geq \nu\) in the Blackwell order.
For two states the converse also holds, with the usual conventions for zero probabilities: if \(D_f(\mu_1 \| \mu_2) \geq D_f(\nu_1 \| \nu_2)\) for every convex \(f\), then \(\mu \geq \nu\).
With more than two states, divergences between pairs of rows do not characterize Blackwell’s order.
So a more informative experiment always produces more separated conditional signal distributions, in the sense of every f-divergence simultaneously.
The DPI is thus a statement about the distinguishability of states: garbling an experiment makes the states harder to tell apart under every statistical measure of separability.
For binary experiments, the equality condition links the DPI directly back to Blackwell: \(D_f(\mu_1 Q \| \mu_2 Q) = D_f(\mu_1 \| \mu_2)\) for some strictly convex \(f\) if and only if \(Q\) is a sufficient statistic for \((\mu_1, \mu_2)\).
Once sufficiency holds, equality follows for every convex \(f\) [Liese, 2012].
30.10.3. Information geometry: Chentsov’s theorem#
The DPI has an infinitesimal, differential-geometric companion.
Chentsov’s theorem [Čencov, 1981] states that the Fisher information metric is, up to a constant factor, the unique Riemannian metric on the probability simplex that is invariant under Markov embeddings, the transformations induced by sufficient statistics.
The Fisher information matrix \(I_F(\theta)\) also contracts under every Markov kernel:
Equality holds if and only if \(\kappa\) is a sufficient statistic for \(\theta\).
The uniqueness clause says that invariance under sufficient statistics singles out the Fisher metric among all Riemannian metrics.
In Which Moments to Match?, the Fisher information of the structural model sets the efficiency bound that score matching attains when the auxiliary model nests the structural model.
See Amari and Nagaoka [2000] for a thorough treatment of information geometry and its connections to sufficiency.
30.10.4. The information bottleneck in machine learning#
The information bottleneck method of Tishby et al. [1999] provides a prominent application of the DPI in machine learning.
Given a joint distribution \(p(X, Y)\) over an input \(X\) and a target \(Y\), the goal is to find a compressed representation \(T\), formed by a stochastic mapping \(p(T \mid X)\), that retains as much information about \(Y\) as possible while using as few bits as possible to describe \(X\).
The method minimizes the Lagrangian
where \(I(\cdot\,;\,\cdot)\) denotes mutual information and \(\beta \geq 0\) governs the compression–relevance trade-off.
Because \(Y - X - T\) forms a Markov chain (T is derived from X alone), the DPI implies
with equality if and only if \(T\) is a sufficient statistic of \(X\) for \(Y\), that is, if \(Y - T - X\) is also a Markov chain.
The Blackwell ordering explains why no deterministic or random post-processing of \(X\) can increase the mutual information with \(Y\): any Markov kernel applied to \(X\) is a garbling in Blackwell’s sense, and the DPI is the mutual-information form of the coarse-graining theorem.
In machine learning language the information bottleneck searches among all garblings of \(X\) for the one that best preserves relevant information about \(Y\) subject to a compression budget.
In a deep neural network with input \(X\) and target \(Y\) and layers \(X \to T_1 \to T_2 \to \cdots \to T_L \to \hat{Y}\), each layer’s representation is a garbling of the previous one.
The DPI then implies the chain of inequalities
so successive layers can only lose, never gain, information about \(Y\).
This observation was placed at the center of the study of what deep networks learn by [Shwartz-Ziv and Tishby, 2017].
Fig. 30.5 already illustrates this: as experiment quality \(\theta\) increases, every measure of informativeness rises monotonically.
The DPI says the same thing in reverse: garbling (decreasing \(\theta\)) can only contract these measures.
30.10.5. Summary of the DPI–Blackwell correspondence#
The table below collects the precise correspondence between Blackwell’s framework and the data-processing and coarse-graining literature.
Blackwell / DeGroot |
Data processing / coarse-graining |
|---|---|
Garbling \(\nu = \mu Q\) |
Applying Markov kernel \(\kappa\) to a pair \((P, Q) = (\mu_1, \mu_2)\) |
\(\mu \geq \nu\) in Blackwell order |
\(D_f(\mu_1 | \mu_2) \geq D_f(\nu_1 | \nu_2)\) for every f-divergence |
Sufficiency (\(Q\) discards nothing) |
Equality in DPI; in binary models, one strictly convex \(f\) already characterizes sufficiency |
DeGroot value \(I(\mu; U_H)\) |
Mutual information \(I(\tilde{x}_\mu;\, \tilde{s})\) (Shannon DPI) |
Posterior spreads under \(\mu\) vs \(\nu\) |
\(D_f\) between rows larger under \(\mu\) |
Blackwell theorem for two states |
\(D_f\) dominance for every \(f\) \(\Leftrightarrow\) a single Markov kernel witnesses dominance |
Chentsov’s uniqueness theorem |
Fisher information is the unique metric invariant under Markov embeddings (sufficient statistics); it also contracts under Markov kernels |
Information bottleneck \(I(T;Y) \leq I(X;Y)\) |
DPI for mutual information applied to Markov chain \(Y{-}X{-}T\) |
30.11. Relation to Bayesian likelihood-ratio learning#
The lecture Likelihood Ratio Processes and Bayesian Learning is a dynamic two-state special case of the framework developed here.
Let \(S = \{s_1, s_2\}\) with \(s_1 \leftrightarrow f\) and \(s_2 \leftrightarrow g\), where \(f\) and \(g\) are the two candidate data-generating densities.
Then a single observation is a Blackwell experiment with rows \(f(\cdot)\) and \(g(\cdot)\), and the history \(w^t = (w_1, \ldots, w_t)\) defines a richer experiment \(\mu_t\).
Here we date the first draw \(t = 1\) and write the prior as \(\pi_0\), as in Likelihood Ratio Processes; Likelihood Ratio Processes and Bayesian Learning dates the first draw \(t = 0\) and writes the prior as \(\pi_{-1}\).
Because one can always discard the last \(t-s\) observations, \(\mu_t\) Blackwell-dominates \(\mu_s\) for every \(t > s\).
The likelihood-ratio process
is a sufficient statistic for \(\mu_t\), and the posterior
is Kihlstrom’s standard experiment in this two-state setting.
Its martingale property, \(E[\pi_t] = \pi_0\), is exactly the mean-preservation result proved above for posterior distributions.
Likewise, \(\mu_t \geq \mu_s\) implies that the distribution of \(\pi_t\) is a mean-preserving spread of the distribution of \(\pi_s\), so additional data pushes beliefs farther toward \(0\) and \(1\) while lowering expected uncertainty under every concave uncertainty function.
30.11.1. Summary table#
The table below records the dictionary between the two lectures without repeating the earlier arguments.
Concept in this lecture |
|
|---|---|
States \(\{f, g\}\) |
State space \(S = \{s_1, s_2\}\) |
Densities \(f(\cdot)\), \(g(\cdot)\) |
Rows of experiment matrix \(\mu\) |
Single draw \(w_t\) |
Blackwell experiment with continuous signal space |
History \(w^t\) of \(t\) IID draws |
Richer experiment \(\mu_t\) Blackwell-dominating \(\mu_s\), \(s < t\) |
Likelihood ratio \(L(w^t)\) |
Sufficient statistic for \(\mu_t\) |
Prior \(\pi_0\) |
Prior \(p \in P\) on the 1-simplex \([0,1]\) |
Posterior \(\pi_t\) |
Posterior on \(P = [0,1]\) (Kihlstrom’s standard experiment) |
Distribution of \(\pi_t\) across histories |
\(\hat{\mu}^c\) (Kihlstrom’s posterior distribution) |
Martingale property \(E[\pi_t] = \pi_0\) |
Mean preservation of \(\hat{\mu}^c\) |
\(\pi_t \to 0\) or \(1\) almost surely |
Posteriors spread to vertices (MPS in the limit) |
Expected fall in the entropy of \(\pi_t\) |
DeGroot value \(I(\mu_t; U_H)\), the mutual information |
More draws \(\Rightarrow\) better for all decision makers |
Blackwell ordering \(\mu_t \geq \mu_s\) |
Garbling (discard last \(t - s\) draws) |
Stochastic transformation \(Q\) with \(\mu_s = \mu_t Q\) |
30.12. Summary#
Blackwell’s theorem identifies a partial order on statistical experiments with three equivalent characterizations:
Criterion |
Condition |
|---|---|
Economic |
Every decision maker weakly prefers \(\mu\) to \(\nu\): \(B(\mu, A, u) \supseteq B(\nu, A, u)\) |
Sufficiency |
\(\nu\) is a garbling of \(\mu\): \(\nu = \mu Q\) for some Markov \(Q\) |
Uncertainty |
\(\mu\) reduces expected uncertainty more for every prior \(p\) and every concave \(U\) |
Kihlstrom’s Bayesian exposition places the posterior distribution at the center.
A more informative experiment generates a more dispersed posterior distribution with the same mean prior.
The right probabilistic language is convex order on the simplex of posterior beliefs.
In the two-state case this reduces to the familiar SOSD / integrated-CDF test on \([0, 1]\).
DeGroot’s contribution is to extend the comparison from particular utility functions to the full class of concave uncertainty functions.
Blackwell’s order implies the data processing inequality for every f-divergence, and the likelihood-ratio learning of Likelihood Ratio Processes and Bayesian Learning is a dynamic special case of the framework.
30.13. Exercises#
Exercise 30.1
The first section found that no stochastic transformation maps \(\nu = \mu Q\) back into \(\mu\), but it offered only a numerical residual as evidence.
This exercise supplies a proof.
Suppose that \(\mu = \nu Q'\) for some Markov matrix \(Q'\), so that \(\tilde{x}_\mu\) is generated from \(\tilde{x}_\nu\) by a randomization that does not depend on \(\tilde{s}\).
Show that each posterior under \(\mu\) is a weighted average of posteriors under \(\nu\):
Under the uniform prior, compute the posterior probabilities of \(s_1\) that \(\mu\) and \(\nu\) from the first section generate.
Conclude that \(\mu\) is not a garbling of \(\nu\).
Solution
For part 1, the state and the two signals form a Markov chain \(\tilde{s} \to \tilde{x}_\nu \to \tilde{x}_\mu\), because \(Q'\) does not depend on the state.
Hence \(\Pr(\tilde{s} = s_i \mid \tilde{x}_\nu = y, \tilde{x}_\mu = x) = \Pr(\tilde{s} = s_i \mid \tilde{x}_\nu = y)\), and
Every posterior of a garbled experiment therefore lies in the convex hull of the posteriors of the original experiment.
c2 = np.array([0.5, 0.5])
post_μ1, _ = compute_posteriors(μ, c2)
post_ν1, _ = compute_posteriors(ν, c2)

lo, hi = post_ν1[:, 0].min(), post_ν1[:, 0].max()
outside = (post_μ1[:, 0] < lo - 1e-12) | (post_μ1[:, 0] > hi + 1e-12)

print("posteriors on s1 under μ:", post_μ1[:, 0].round(4))
print("posteriors on s1 under ν:", post_ν1[:, 0].round(4))
print(f"interval spanned by ν's posteriors: [{lo:.4f}, {hi:.4f}]")
print("μ's posteriors outside that interval:", post_μ1[outside, 0].round(4))
posteriors on s1 under μ: [0.8571 0.5    0.1429]
posteriors on s1 under ν: [0.75 0.25]
interval spanned by ν's posteriors: [0.2500, 0.7500]
μ's posteriors outside that interval: [0.8571 0.1429]
Under \(\nu\) the posteriors on \(s_1\) are \(3/4\) and \(1/4\).
Under \(\mu\) they are \(6/7\), \(1/2\) and \(1/7\).
The posteriors \(6/7\) and \(1/7\) lie outside \([1/4, 3/4]\), so no Markov matrix \(Q'\) produces \(\mu\) from \(\nu\).
The argument explains the large residual in the first section: a garbling can only pull posteriors toward the prior, and \(\mu\) places posteriors farther from the prior than \(\nu\) can reach.
Exercise 30.2
Blackwell’s order is a partial order, and The Design and Price of Information builds on that fact.
Consider two experiments with two states and two signals,
and the uniform prior.
Compute the distribution of the posterior probability of \(s_1\) under each experiment, and the mutual information between signal and state.
Use the call-option test \(\mathbb{E}[\max(p - t, 0)]\) to show that neither posterior distribution is a mean-preserving spread of the other.
For the concave uncertainty functions \(U_t(p) = -\max(p_1 - t, 0)\) with \(t = 0.2\) and \(t = 0.6\), compute DeGroot’s value of each experiment and interpret the result.
Solution
Under \(\mu_a\), signal \(x_2\) occurs only in state \(s_2\), so it reveals \(s_2\).
Under \(\mu_b\), signal \(x_1\) occurs only in state \(s_1\), so it reveals \(s_1\).
μ_a = np.array([[1.0, 0.0],
                [0.5, 0.5]])
μ_b = np.array([[0.5, 0.5],
                [0.0, 1.0]])

for name, m in [("μ_a", μ_a), ("μ_b", μ_b)]:
    posts, probs = compute_posteriors(m, c2)
    print(f"{name}: posteriors on s1 = {posts[:, 0].round(4)}, "
          f"probabilities = {probs.round(4)}, "
          f"mutual information = {degroot_value(m, c2, entropy):.4f}")
μ_a: posteriors on s1 = [0.6667 0.    ], probabilities = [0.75 0.25], mutual information = 0.2158
μ_b: posteriors on s1 = [1.     0.3333], probabilities = [0.25 0.75], mutual information = 0.2158
The two posterior distributions are mirror images.
Relabeling states and signals maps one experiment into the other, so the two have the same mutual information.
def call_values(m, prior, ts):
    "E[max(p_1 - t, 0)] under experiment m for each threshold t."
    posts, probs = compute_posteriors(m, prior)
    return np.array([(np.maximum(posts[:, 0] - t, 0) * probs).sum() for t in ts])

ts = np.linspace(0, 1, 201)
diff_ab = call_values(μ_a, c2, ts) - call_values(μ_b, c2, ts)

fig, ax = plt.subplots(figsize=(8, 4))
ax.plot(ts, diff_ab, linewidth=2)
ax.axhline(0, color="black", linewidth=1)
ax.set_xlabel("threshold $t$")
ax.set_ylabel(r"$E[\max(p - t, 0)]$ under $\mu_a$ minus under $\mu_b$")
plt.show()
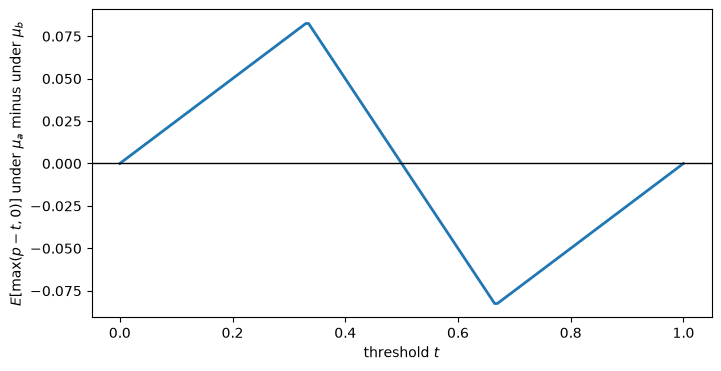
The difference changes sign.
Neither posterior distribution is a mean-preserving spread of the other, so by Kihlstrom’s theorem neither experiment is Blackwell sufficient for the other.
def U_call(t):
    "The concave uncertainty function -max(p_1 - t, 0)."
    return lambda p: -max(p[0] - t, 0.0)

for t in (0.2, 0.6):
    print(f"t = {t}:  I(μ_a) = {degroot_value(μ_a, c2, U_call(t)):.4f},  "
          f"I(μ_b) = {degroot_value(μ_b, c2, U_call(t)):.4f}")
t = 0.2:  I(μ_a) = 0.0500,  I(μ_b) = 0.0000
t = 0.6:  I(μ_a) = 0.0500,  I(μ_b) = 0.1000
With \(t = 0.2\), \(\mu_a\) has value \(0.05\) and \(\mu_b\) has value zero.
With \(t = 0.6\), the ranking reverses.
Up to sign and an affine term, \(U_t\) is the value function of a decision maker who chooses between two actions and switches actions at the belief \(t\).
A decision maker who switches at \(t = 0.2\) values only signals that push the posterior below \(0.2\), and \(\mu_b\) never does so.
A decision maker who switches at \(t = 0.6\) values \(\mu_b\)’s signal that reveals \(s_1\) more than \(\mu_a\)’s signal that raises the posterior to \(2/3\).
Mutual information ranks the two experiments equally, yet decision makers disagree about them.
A single uncertainty function cannot settle a Blackwell comparison.
Exercise 30.3
This exercise connects Blackwell’s order to the learning dynamics of Likelihood Ratio Processes and Bayesian Learning.
Let a single draw come from the experiment make_experiment(θ) with \(\theta = 0.3\), so that the signal matches the state with probability \((1 + \theta) / 2\).
Observe \(t\) independent draws.
Explain why the number \(k\) of draws equal to \(x_1\) is a sufficient statistic, and write the \(2 \times (t + 1)\) experiment matrix \(\mu_t\) for \(k\).
Construct the Markov matrix \(Q_t\) that discards the last of \(t + 1\) draws, and verify numerically that \(\mu_t = \mu_{t+1} Q_t\).
Under the uniform prior, use the call-option test to verify that the posterior distribution after \(t + 1\) draws is a mean-preserving spread of the posterior distribution after \(t\) draws, for \(t = 1, \ldots, 29\).
Plot the mutual information between \(k\) and the state against \(t\), and compare it with its upper bound \(\log 2\).
Solution
Write \(a = (1 + \theta)/2\) and \(b = (1 - \theta)/2\).
The likelihood of \(t\) draws containing \(k\) copies of \(x_1\) is \(a^k b^{t-k}\) in state \(s_1\) and \(b^k a^{t-k}\) in state \(s_2\).
The likelihood ratio depends on the data only through \(k\), so \(k\) is sufficient.
The rows of \(\mu_t\) are the binomial distributions \(\text{Bin}(t, a)\) and \(\text{Bin}(t, b)\).
The draws are exchangeable, as in Exchangeability and Bayesian Updating.
Given \(k'\) copies of \(x_1\) among \(t + 1\) draws, the last draw equals \(x_1\) with probability \(k' / (t + 1)\) in either state.
Discarding it moves \(k'\) to \(k' - 1\) with that probability and leaves \(k'\) unchanged otherwise.
The kernel does not depend on the state, so it is a garbling.
from scipy.stats import binom

def draws_experiment(θ, t):
    "Experiment matrix for the number of x_1 signals in t independent draws."
    a, b = (1 + θ) / 2, (1 - θ) / 2
    k = np.arange(t + 1)
    return np.vstack([binom.pmf(k, t, a), binom.pmf(k, t, b)])

def discard_last(t):
    "Markov matrix from k' in {0, ..., t+1} to k in {0, ..., t}."
    Q_t = np.zeros((t + 2, t + 1))
    for kp in range(t + 2):
        if kp >= 1:
            Q_t[kp, kp - 1] = kp / (t + 1)
        if kp <= t:
            Q_t[kp, kp] = 1 - kp / (t + 1)
    return Q_t

θ_ex = 0.3
for t in (1, 4, 9):
    err = np.abs(draws_experiment(θ_ex, t + 1) @ discard_last(t)
                 - draws_experiment(θ_ex, t)).max()
    print(f"t = {t}:  max |μ_(t+1) Q_t - μ_t| = {err:.1e}")

is_mps = all(
    (call_values(draws_experiment(θ_ex, t + 1), c2, ts)
     - call_values(draws_experiment(θ_ex, t), c2, ts)).min() >= -1e-12
    for t in range(1, 30))
print(f"\nposteriors after t + 1 draws are an MPS of those after t draws: {is_mps}")
t = 1:  max |μ_(t+1) Q_t - μ_t| = 1.1e-16
t = 4:  max |μ_(t+1) Q_t - μ_t| = 9.7e-17
t = 9:  max |μ_(t+1) Q_t - μ_t| = 1.1e-16

posteriors after t + 1 draws are an MPS of those after t draws: True
t_grid = np.arange(1, 81)
mi = [degroot_value(draws_experiment(θ_ex, t), c2, entropy) for t in t_grid]

fig, ax = plt.subplots(figsize=(8, 4))
ax.plot(t_grid, mi, linewidth=2, label="mutual information")
ax.axhline(np.log(2), color="black", linestyle="--", linewidth=1, label=r"$\log 2$")
ax.set_xlabel("number of draws $t$")
ax.set_ylabel("mutual information")
ax.legend()
plt.show()
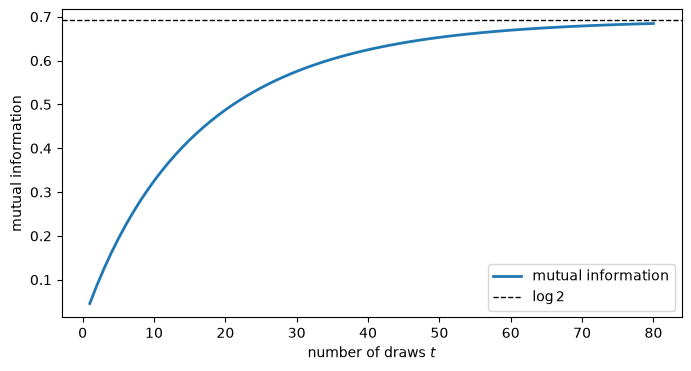
Each additional draw spreads the posterior distribution while its mean stays at the prior, the martingale property studied in Likelihood Ratio Processes and Bayesian Learning.
Mutual information rises toward \(\log 2\), the entropy of the uniform prior, as the posterior concentrates on the true state.